Chart Annotation Toolkit Examples and graphics for overlaying






- Slides: 166
Chart Annotation Toolkit Examples and graphics for overlaying visual annotations onto a chart
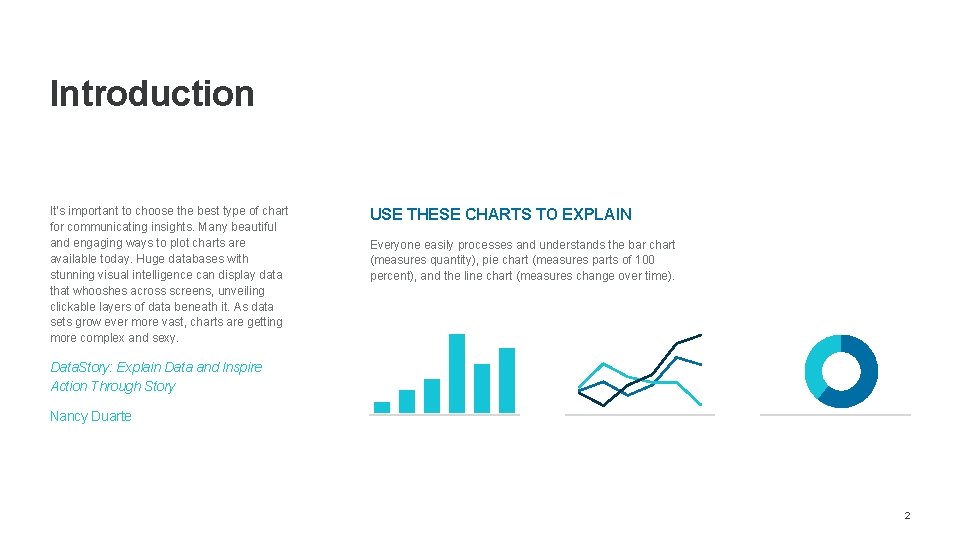
Introduction It’s important to choose the best type of chart for communicating insights. Many beautiful and engaging ways to plot charts are available today. Huge databases with stunning visual intelligence can display data that whooshes across screens, unveiling clickable layers of data beneath it. As data sets grow ever more vast, charts are getting more complex and sexy. USE THESE CHARTS TO EXPLAIN Everyone easily processes and understands the bar chart (measures quantity), pie chart (measures parts of 100 percent), and the line chart (measures change over time). Data. Story: Explain Data and Inspire Action Through Story Nancy Duarte 2
How to Use This Document CHAPTERS 1 Amplify Highlight This document is set up to introduce you first to the simpler annotation methods—formatting parts of a chart—and grows towards more complicated annotation methods—adding information to a chart. Within each sub-section the complexity of the annotation formatting will increase, as well. Label 2 Bracket The charts and graphics on these pages have been built using the Microsoft Power. Point® theme so they will automatically take on the look and feel of your own documents when pasted into them (e. g. , fonts and colors). Some of the charts’ options have been customized away from the default settings in order to give you a sense of how a chart can be designed to minimize chart noise and to maximize clarity for the audience. When copying/pasting these charts into your own documents, reset the chart axis options and number settings so your own data will present properly. Add Math Delineate Explode 3 Callout Library 3
CHAPTER ONE Amplify Call out a portion of data with simple chart formatting or by customizing data labels 4
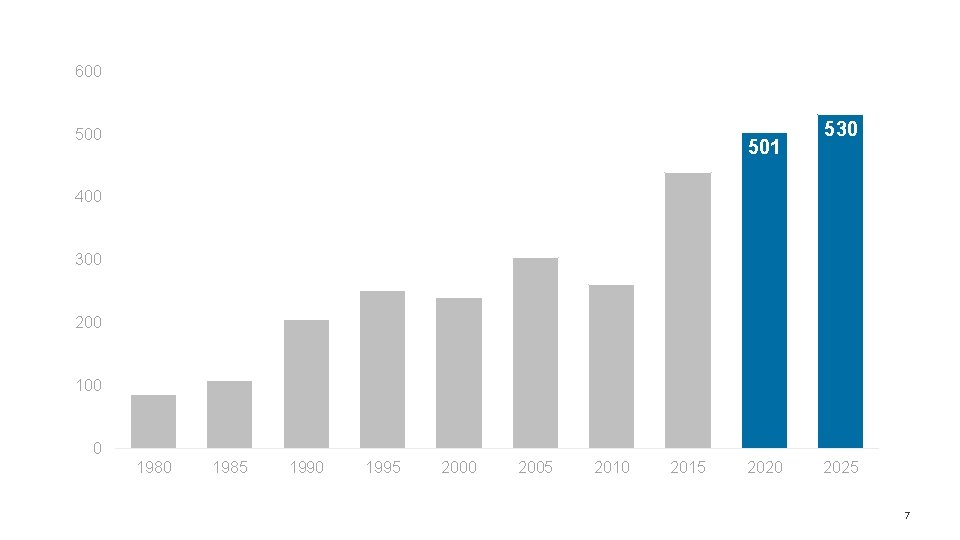
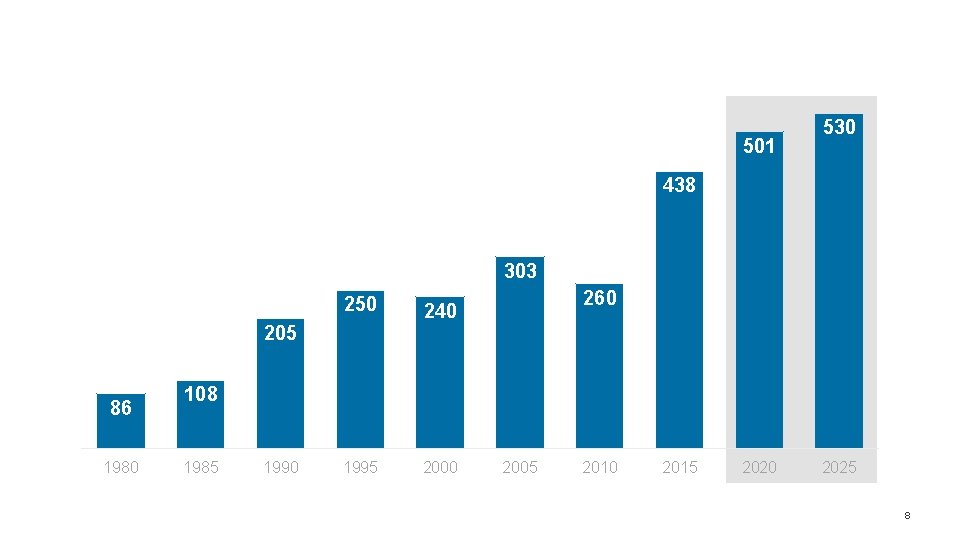
CHAPTER ONE: AMPLIFY Highlight Data Color a data point with a contrasting color so the main point stands out Tints and shades of color make the most important parts of the data story stand out. Deliberate coloring on a chart is the first and easiest formatting applied before adding any further elements. Use color to subdue contextual information, highlight primary information, and to group and associate data across the chart. 5
AMPLIFY » HIGHLIGHT Column, Bar & Stack 6
600 501 530 400 300 200 100 0 1985 1990 1995 2000 2005 2010 2015 2020 2025 7
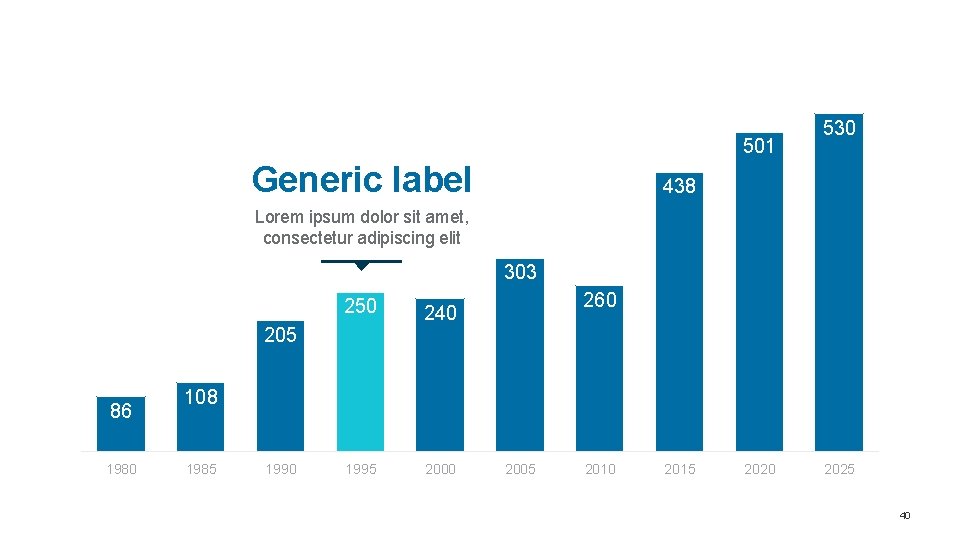
501 530 438 303 250 240 1995 2000 205 86 1980 260 108 1985 1990 2005 2010 2015 2020 2025 8
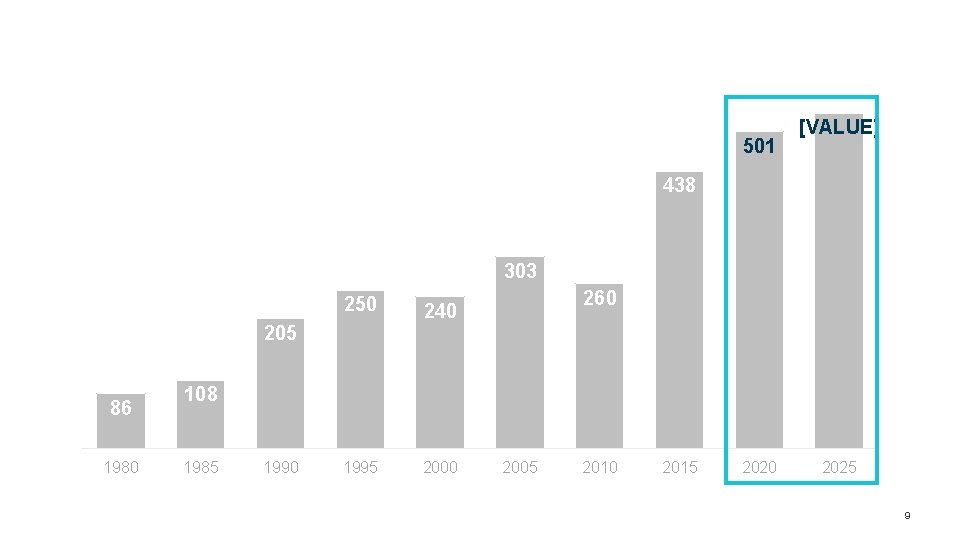
501 [VALUE] 438 303 250 240 1995 2000 205 86 1980 260 108 1985 1990 2005 2010 2015 2020 2025 9
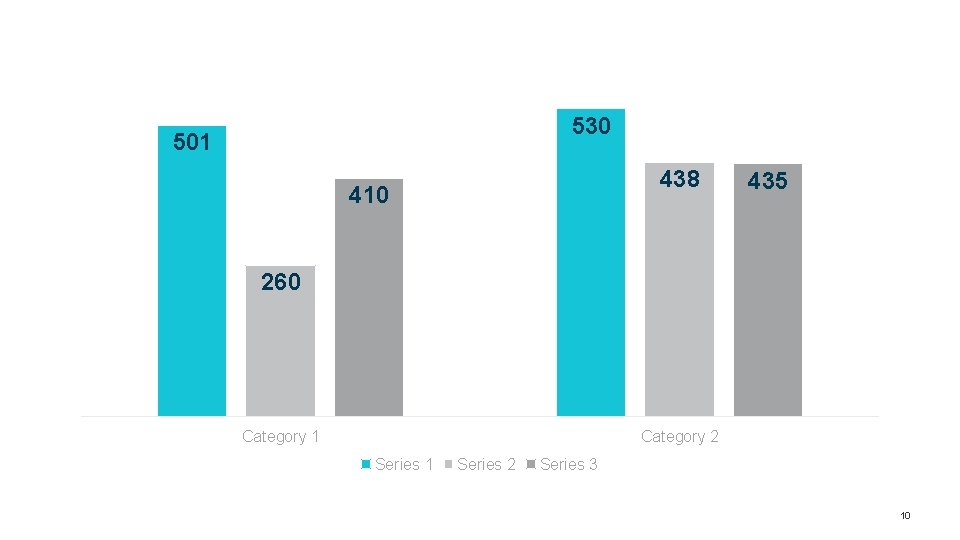
530 501 438 410 435 260 Category 1 Category 2 Series 1 Series 2 Series 3 10
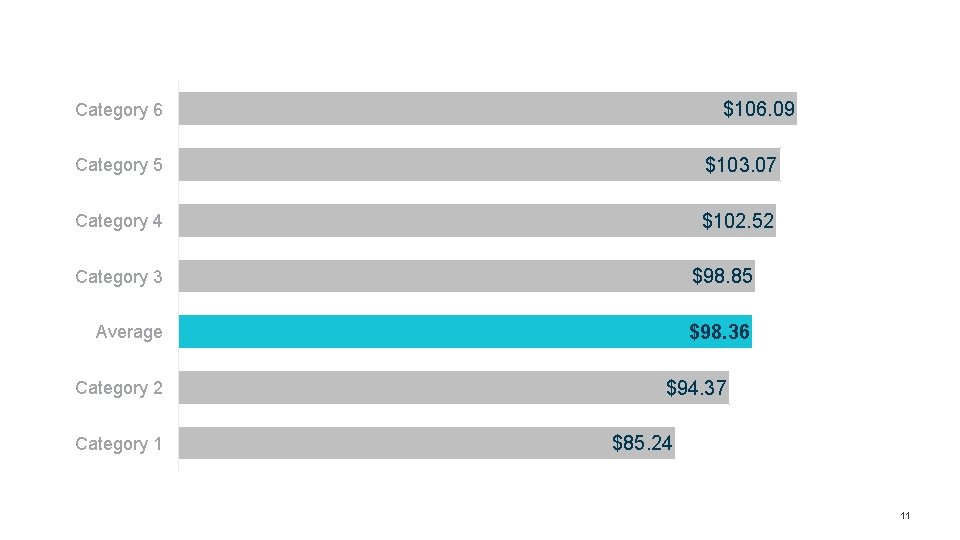
$106. 09 Category 6 Category 5 $103. 07 Category 4 $102. 52 Category 3 $98. 85 Average $98. 36 Category 2 Category 1 $94. 37 $85. 24 11
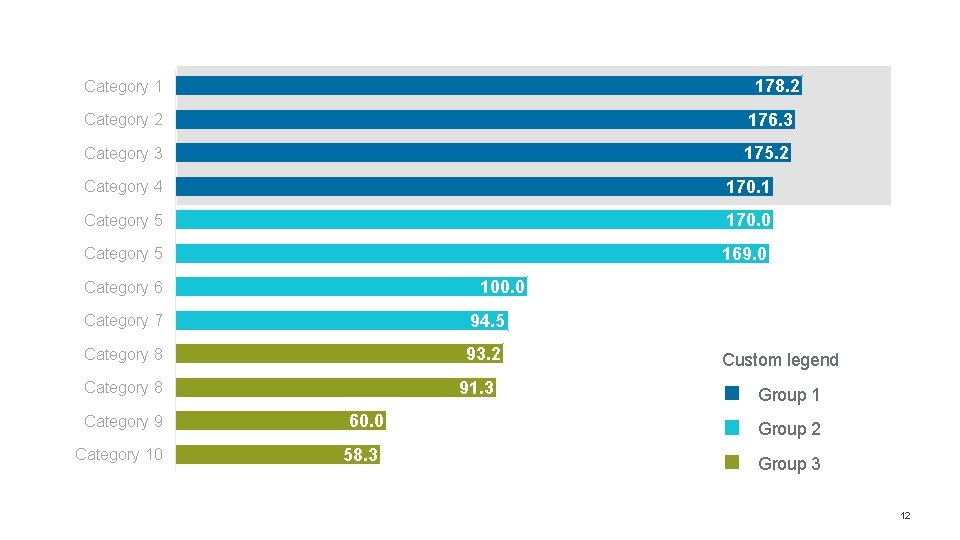
178. 2 Category 1 Category 2 176. 3 Category 3 175. 2 Category 4 170. 1 Category 5 170. 0 Category 5 169. 0 100. 0 Category 6 Category 7 94. 5 Category 8 93. 2 91. 3 Category 8 Category 9 Category 10 60. 0 58. 3 Custom legend Group 1 Group 2 Group 3 12
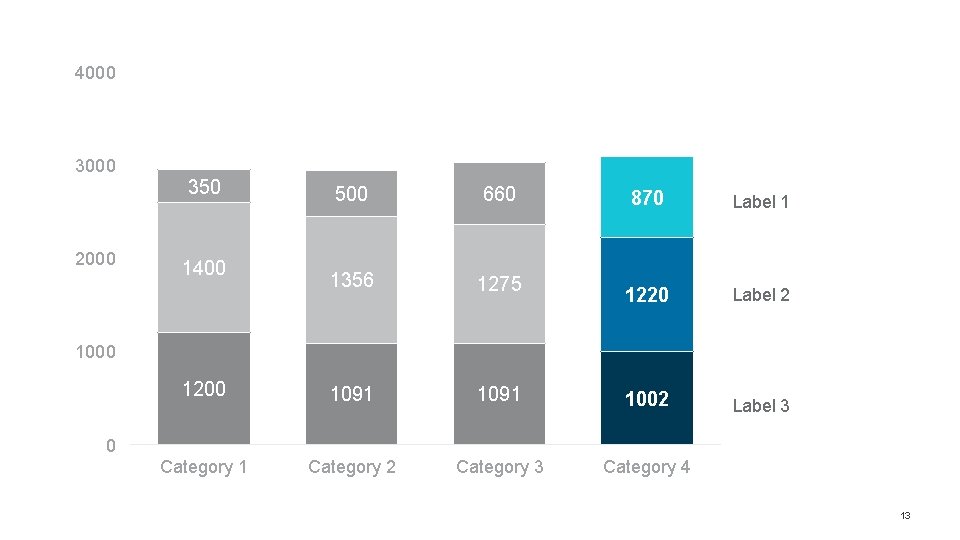
4000 3000 2000 350 500 660 1356 1275 1200 1091 Category 2 1400 870 Label 1 1220 Label 2 1091 1002 Label 3 Category 4 1000 0 13
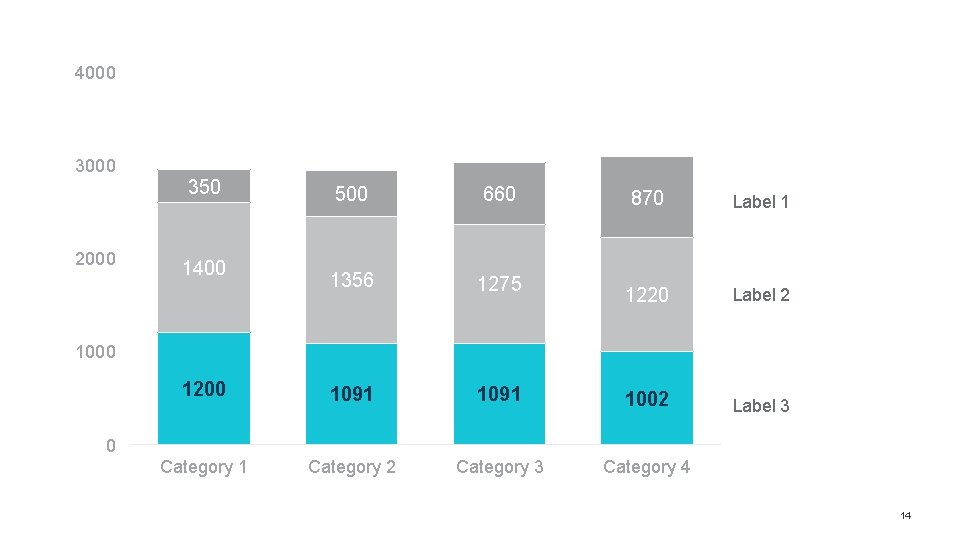
4000 3000 2000 350 500 660 1356 1275 1200 1091 Category 2 1400 870 Label 1 1220 Label 2 1091 1002 Label 3 Category 4 1000 0 14
AMPLIFY » HIGHLIGHT Line 15
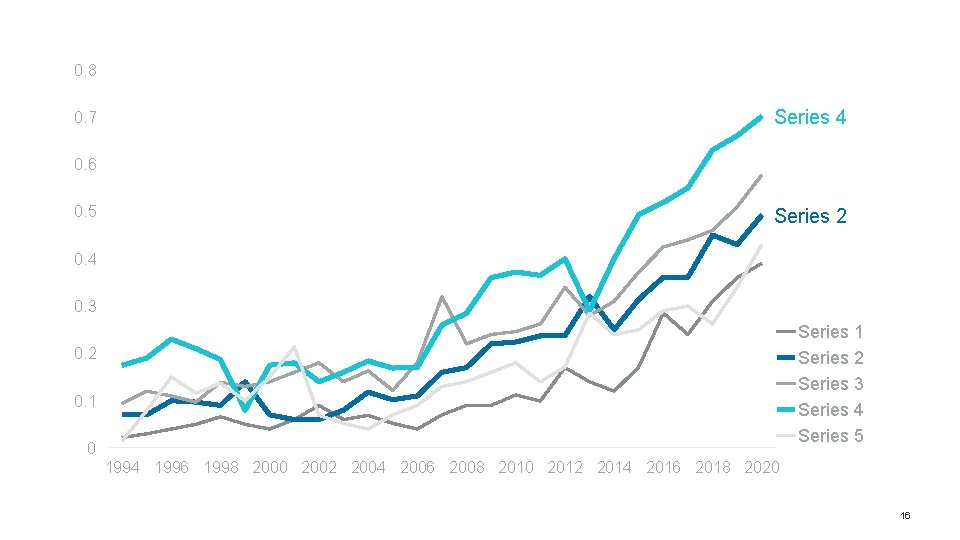
0. 8 0. 7 Series 4 0. 6 0. 5 Series 2 0. 4 0. 3 Series 1 Series 2 Series 3 Series 4 Series 5 0. 2 0. 1 0 1994 1996 1998 2000 2002 2004 2006 2008 2010 2012 2014 2016 2018 2020 16
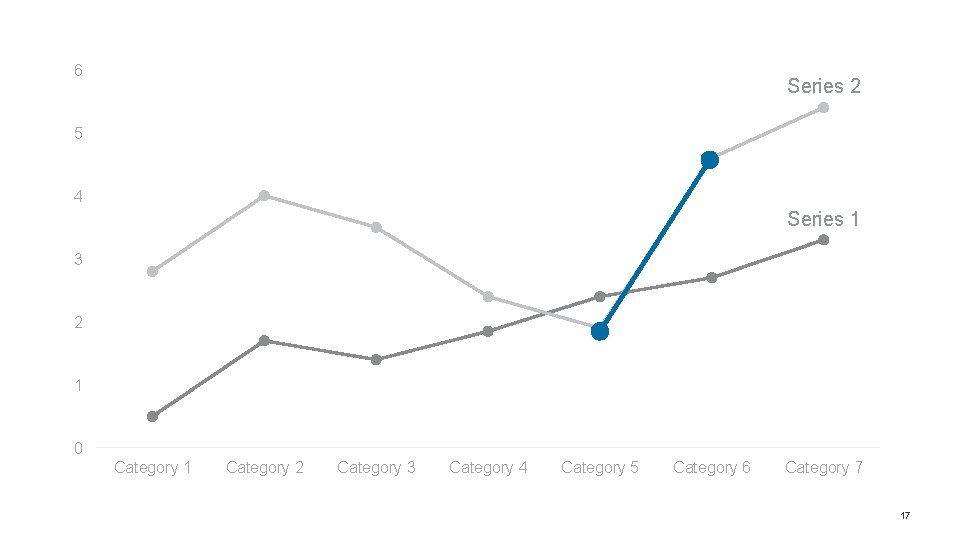
6 Series 2 5 4 Series 1 3 2 1 0 Category 1 Category 2 Category 3 Category 4 Category 5 Category 6 Category 7 17
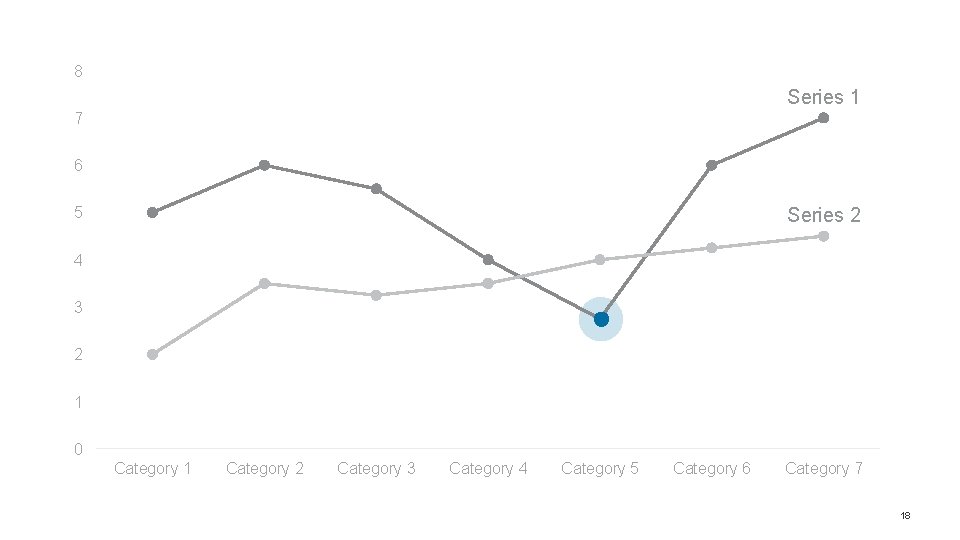
8 Series 1 7 6 5 Series 2 4 3 2 1 0 Category 1 Category 2 Category 3 Category 4 Category 5 Category 6 Category 7 18
AMPLIFY » HIGHLIGHT Pie & Donut 19
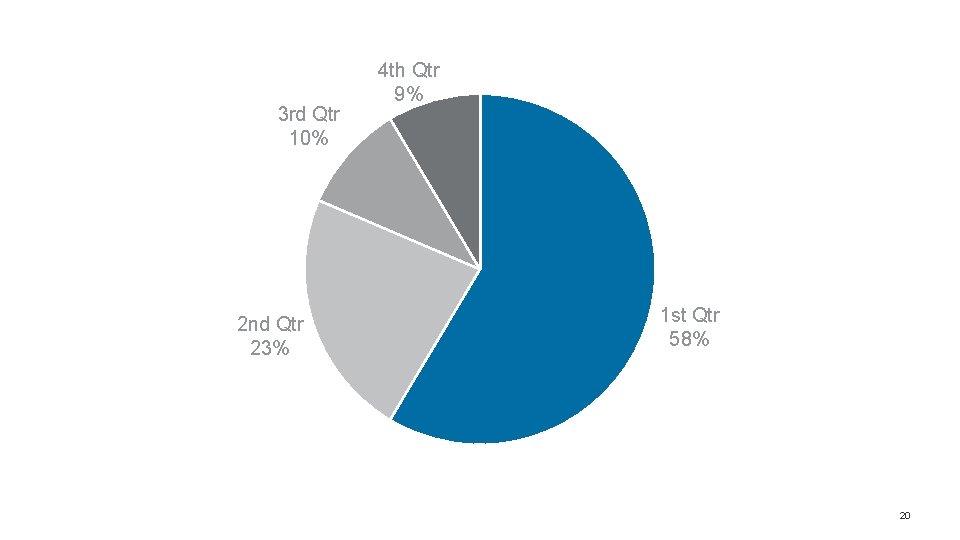
3 rd Qtr 10% 2 nd Qtr 23% 4 th Qtr 9% 1 st Qtr 58% 20
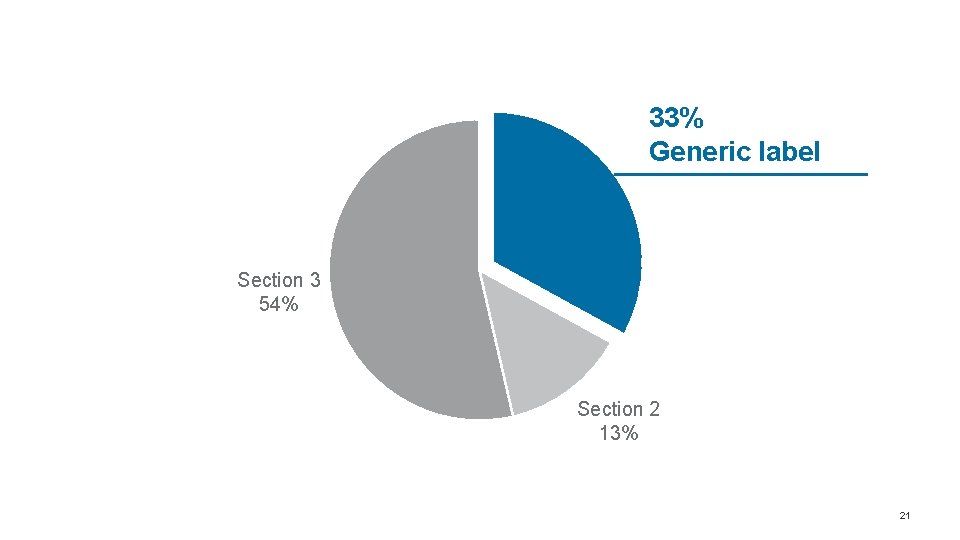
33% Generic label Section 3 54% Section 2 13% 21
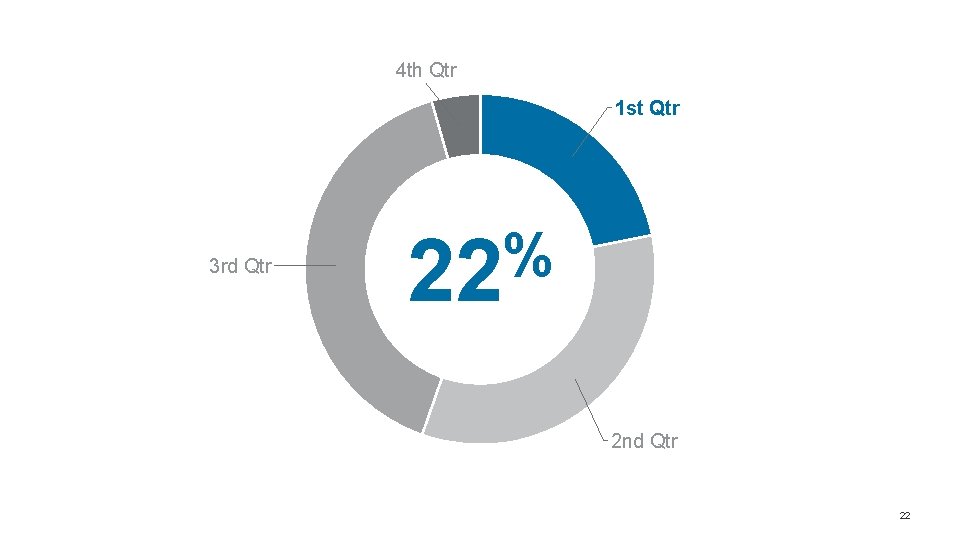
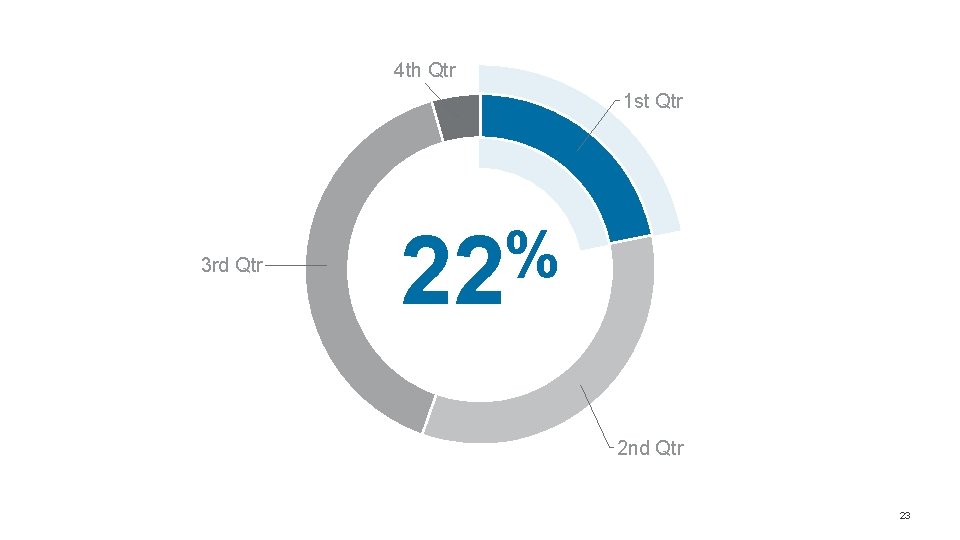
4 th Qtr 1 st Qtr 3 rd Qtr % 22 2 nd Qtr 22
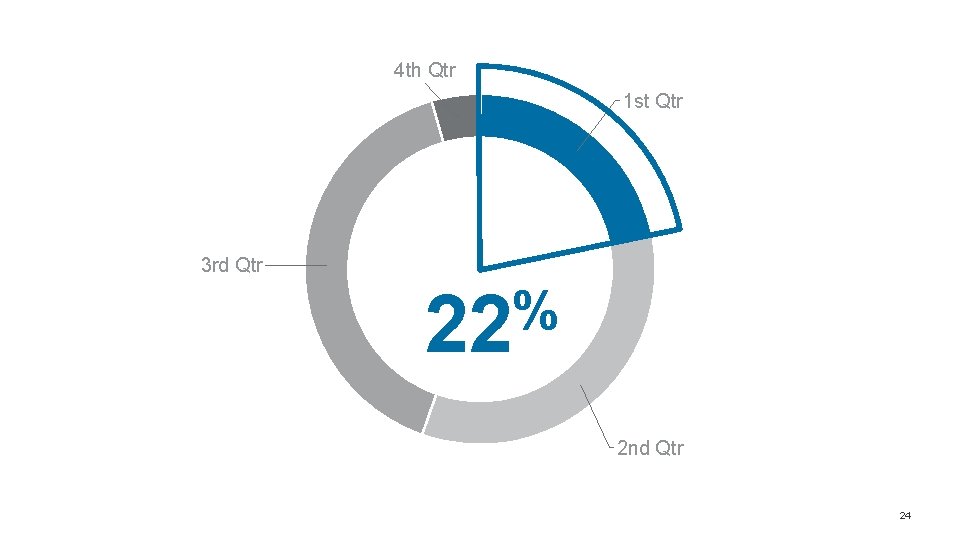
4 th Qtr 1 st Qtr 3 rd Qtr % 22 2 nd Qtr 23
4 th Qtr 1 st Qtr 3 rd Qtr % 22 2 nd Qtr 24
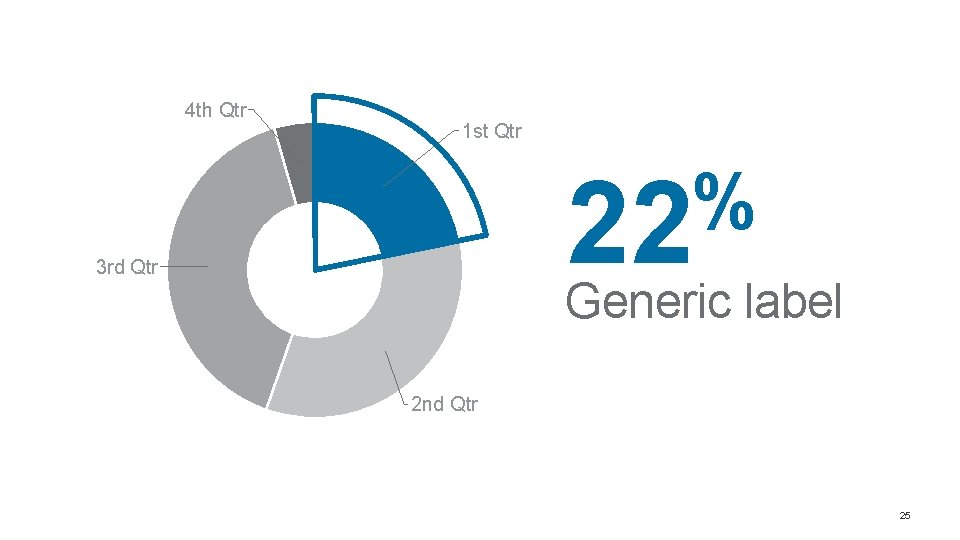
4 th Qtr 1 st Qtr % 22 3 rd Qtr Generic label 2 nd Qtr 25
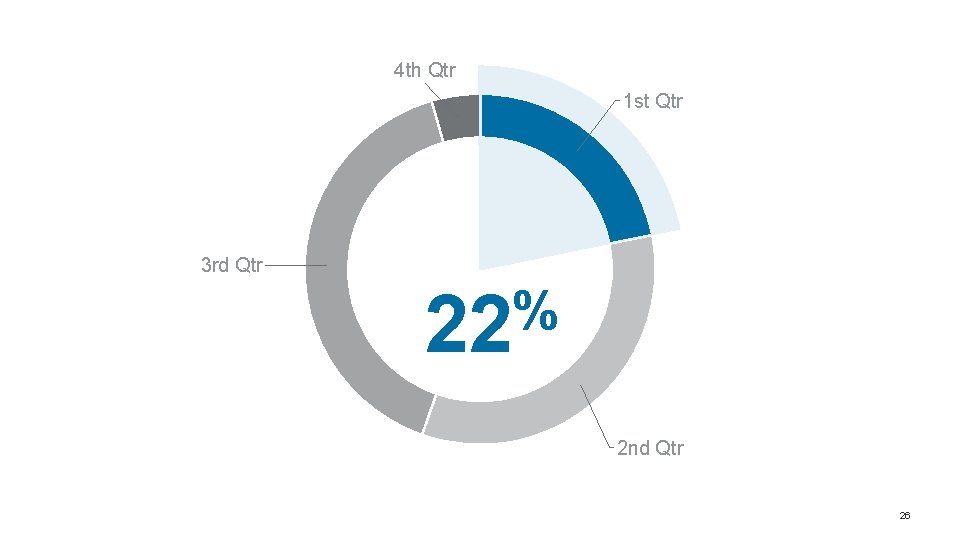
4 th Qtr 1 st Qtr 3 rd Qtr % 22 2 nd Qtr 26
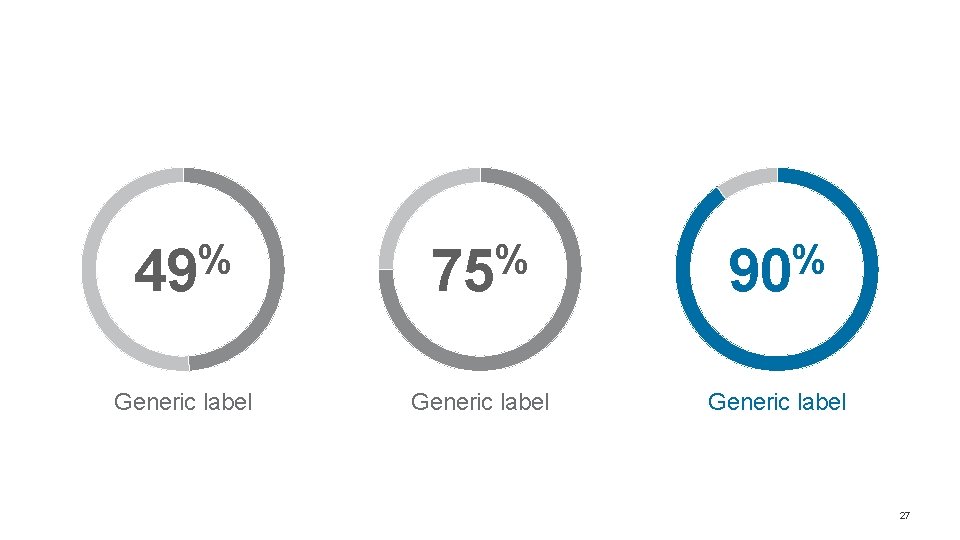
% 49 % 75 % 90 Generic label 27
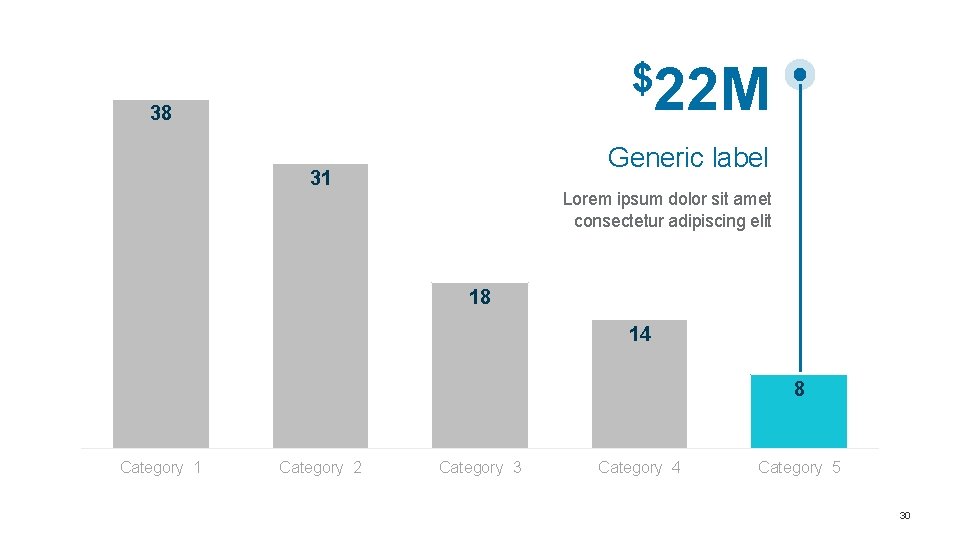
CHAPTER ONE: AMPLIFY Label Data Create large, graphical labels to make data points clear Good data labeling not only reduces chart noise, but also increases legibility and hierarchy. Be careful not to over-label. Rather, show required default labels subtly for context, and then custom format strategically to amplify the narrative in the chart. 28
AMPLIFY » LABEL Column, Bar & Stack 29
$22 M 38 Generic label 31 Lorem ipsum dolor sit amet consectetur adipiscing elit 18 14 8 Category 1 Category 2 Category 3 Category 4 Category 5 30
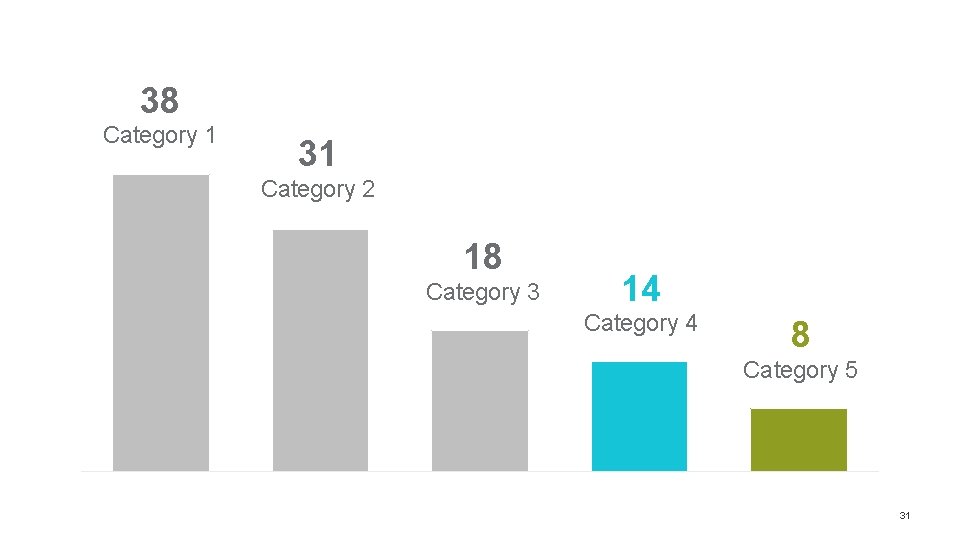
38 Category 1 31 Category 2 18 Category 3 14 Category 4 8 Category 5 31
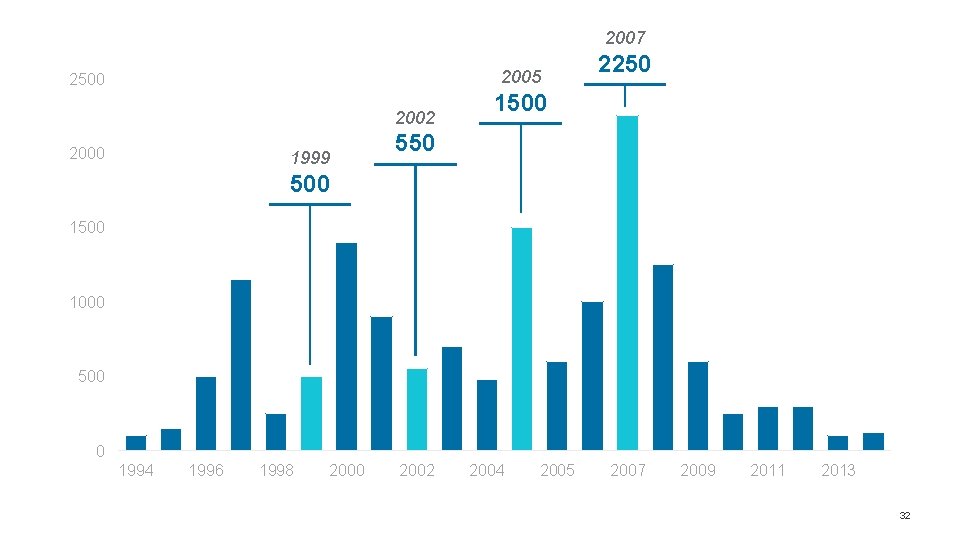
2007 2005 2500 2002 2000 1999 2250 1500 550 500 1000 500 0 1994 1996 1998 2000 2002 2004 2005 2007 2009 2011 2013 32
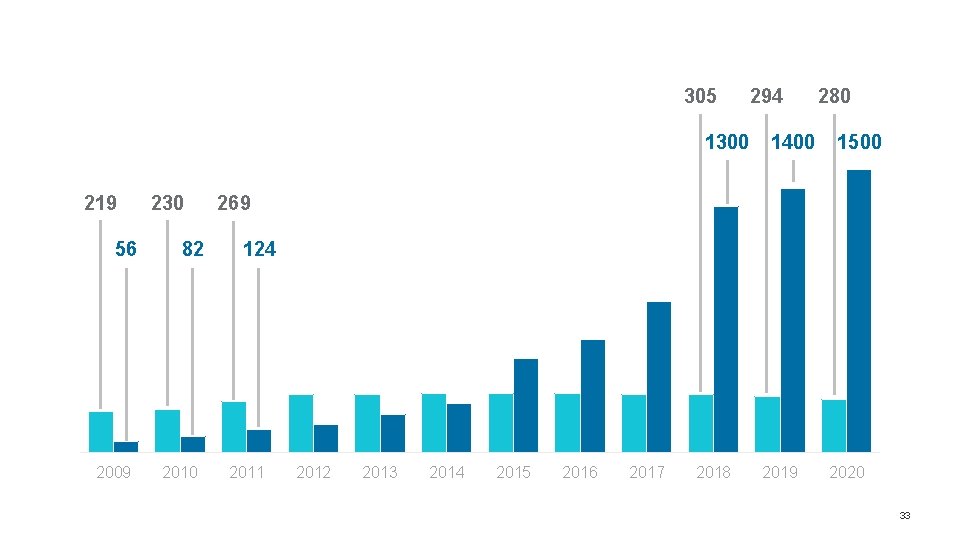
305 1300 219 56 2009 230 82 2010 294 1400 280 1500 269 124 2011 2012 2013 2014 2015 2016 2017 2018 2019 2020 33
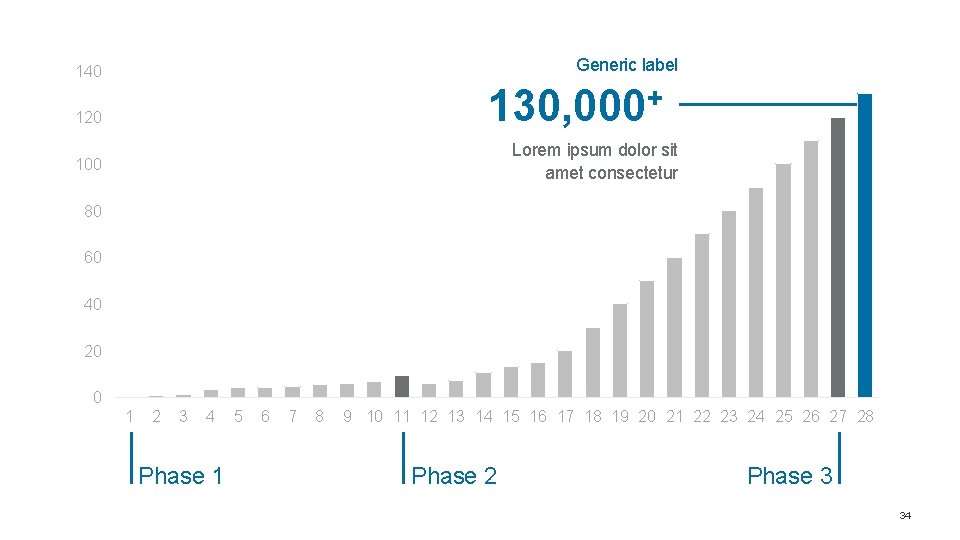
Generic label 140 130, 000+ 120 Lorem ipsum dolor sit amet consectetur 100 80 60 40 20 0 1 2 3 4 Phase 1 5 6 7 8 9 10 11 12 13 14 15 16 17 18 19 20 21 22 23 24 25 26 27 28 Phase 2 Phase 3 34
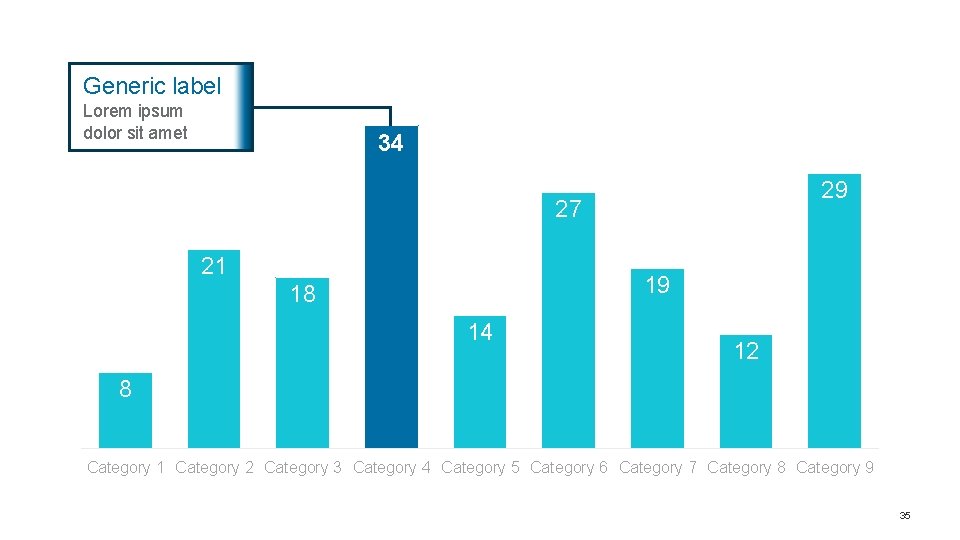
Generic label Lorem ipsum dolor sit amet 34 29 27 21 19 18 14 12 8 Category 1 Category 2 Category 3 Category 4 Category 5 Category 6 Category 7 Category 8 Category 9 35
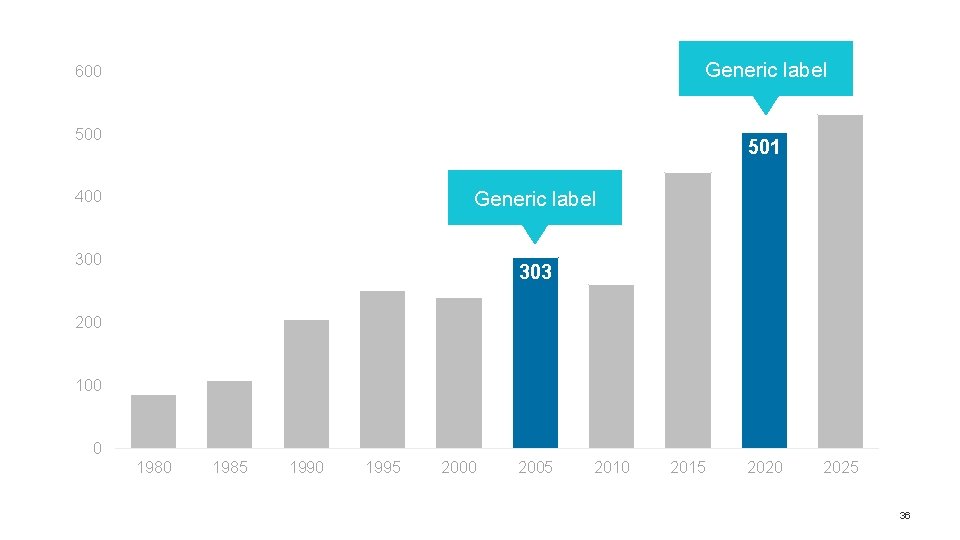
Generic label 600 501 Generic label 400 303 200 100 0 1985 1990 1995 2000 2005 2010 2015 2020 2025 36
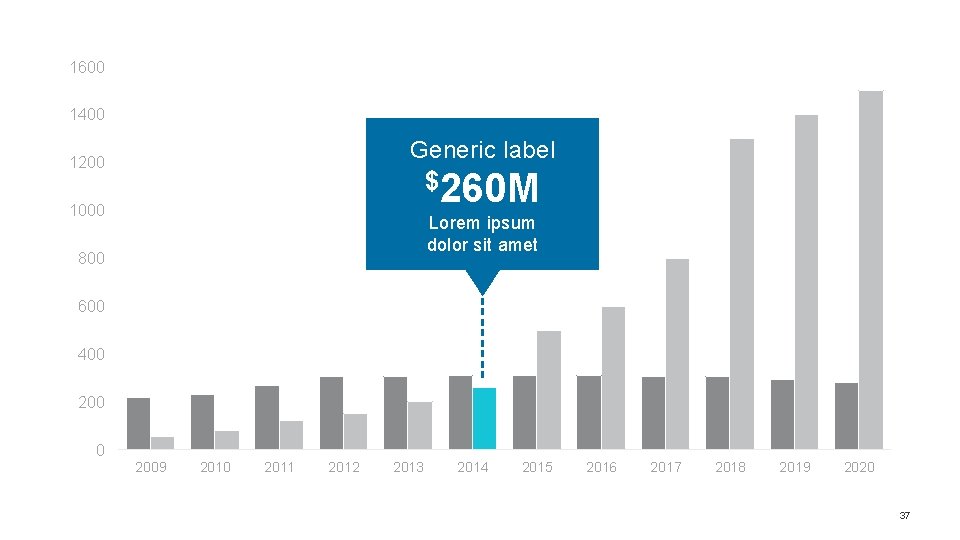
1600 1400 Generic label 1200 $260 M 1000 Lorem ipsum dolor sit amet 800 600 400 2009 2010 2011 2012 2013 2014 2015 2016 2017 2018 2019 2020 37
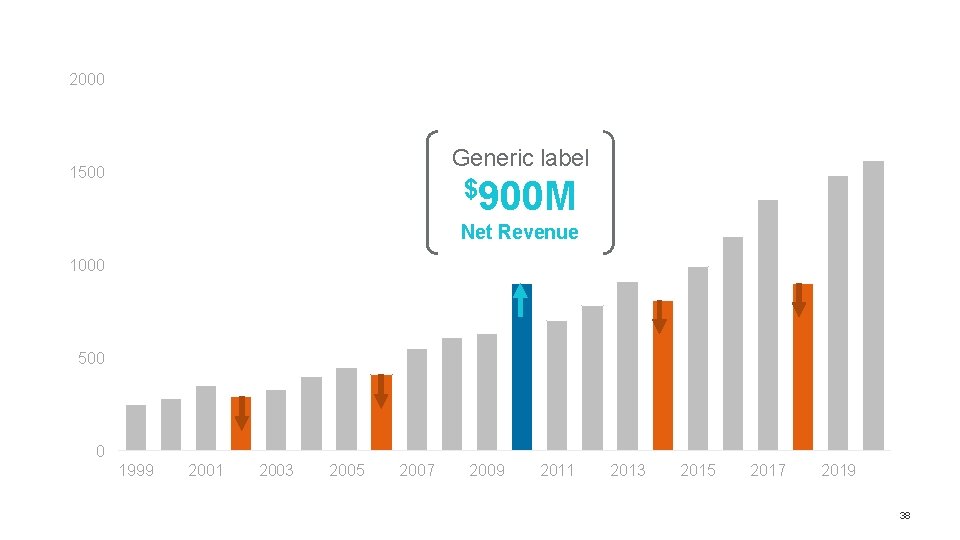
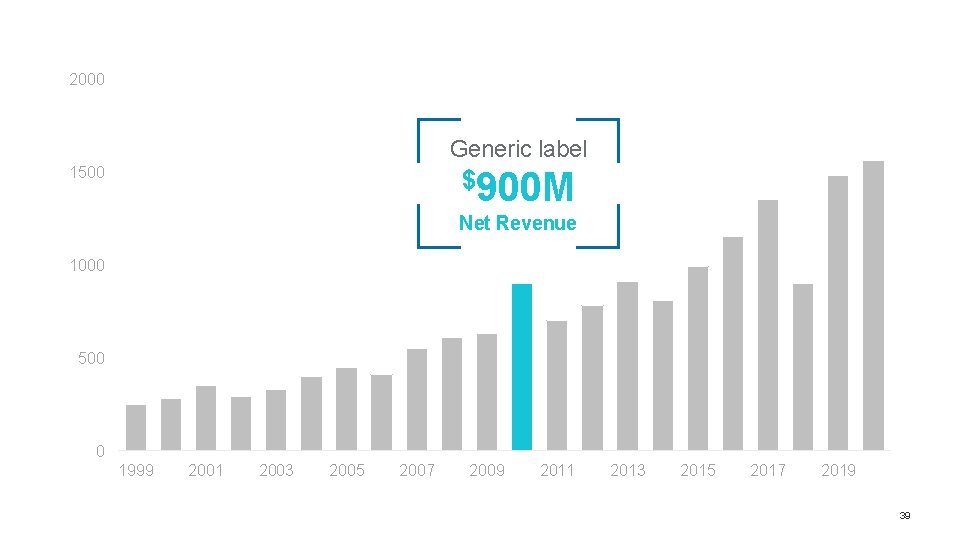
2000 Generic label 1500 $900 M Net Revenue 1000 500 0 1999 2001 2003 2005 2007 2009 2011 2013 2015 2017 2019 38
2000 Generic label 1500 $900 M Net Revenue 1000 500 0 1999 2001 2003 2005 2007 2009 2011 2013 2015 2017 2019 39
501 Generic label 530 438 Lorem ipsum dolor sit amet, consectetur adipiscing elit 303 250 240 1995 2000 260 205 86 1980 108 1985 1990 2005 2010 2015 2020 2025 40
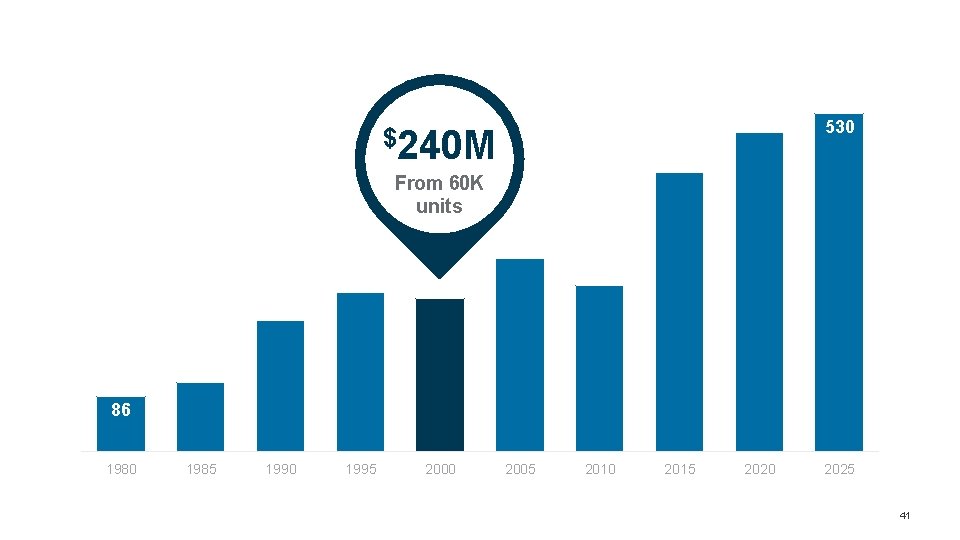
530 $240 M From 60 K units 86 1980 1985 1990 1995 2000 2005 2010 2015 2020 2025 41
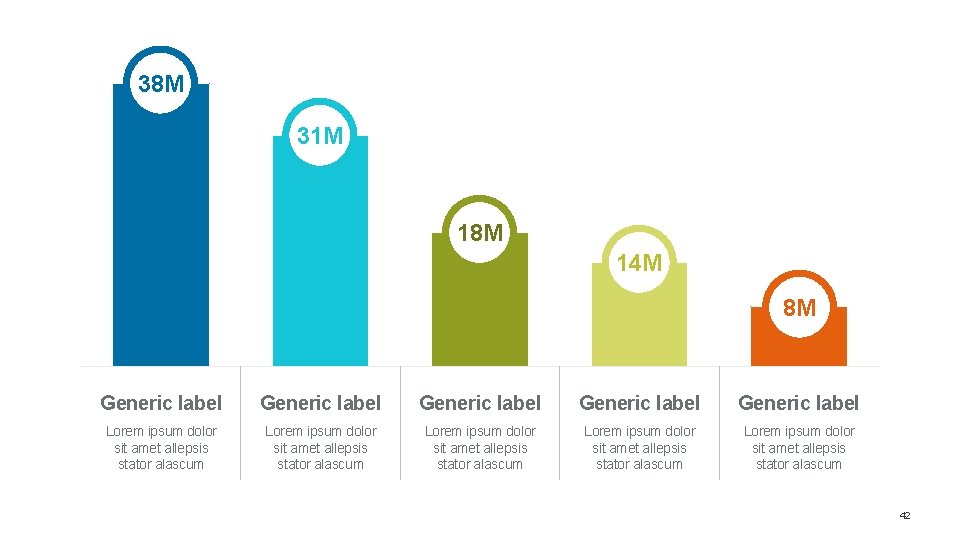
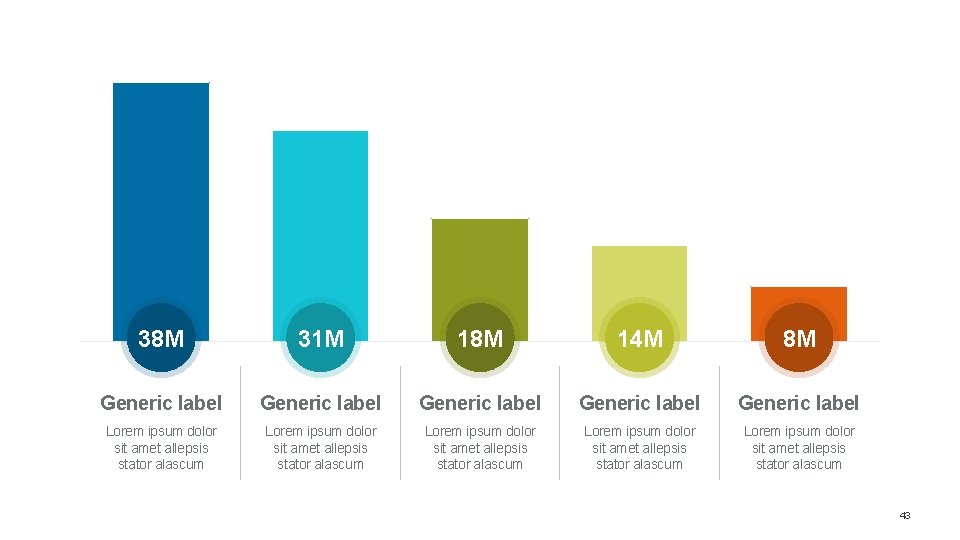
38 M 31 M 18 M 14 M 8 M Generic label Generic label Lorem ipsum dolor sit amet allepsis stator alascum Lorem ipsum dolor sit amet allepsis stator alascum 42
38 M 31 M 18 M 14 M 8 M Generic label Generic label Lorem ipsum dolor sit amet allepsis stator alascum Lorem ipsum dolor sit amet allepsis stator alascum 43
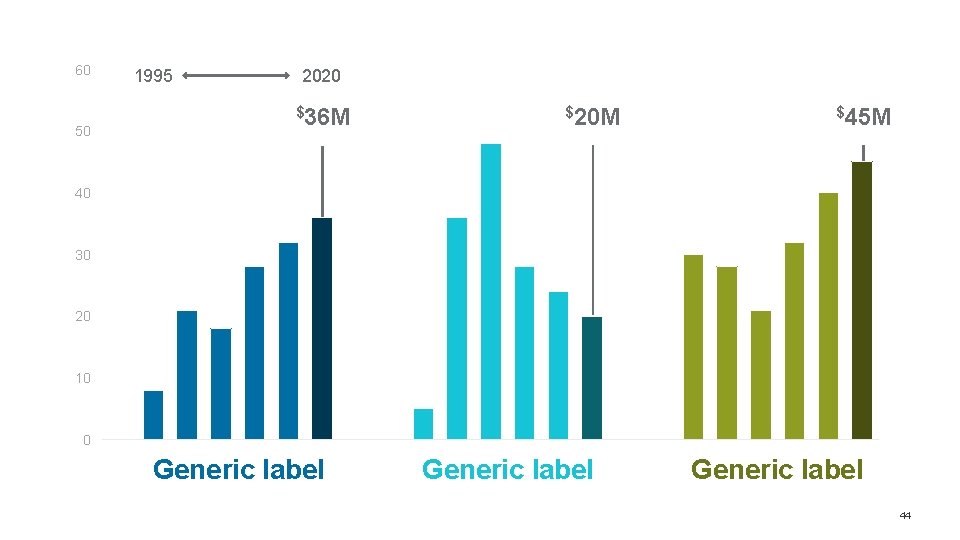
60 50 1995 2020 $36 M $20 M $45 M 40 30 20 10 0 Generic label 44
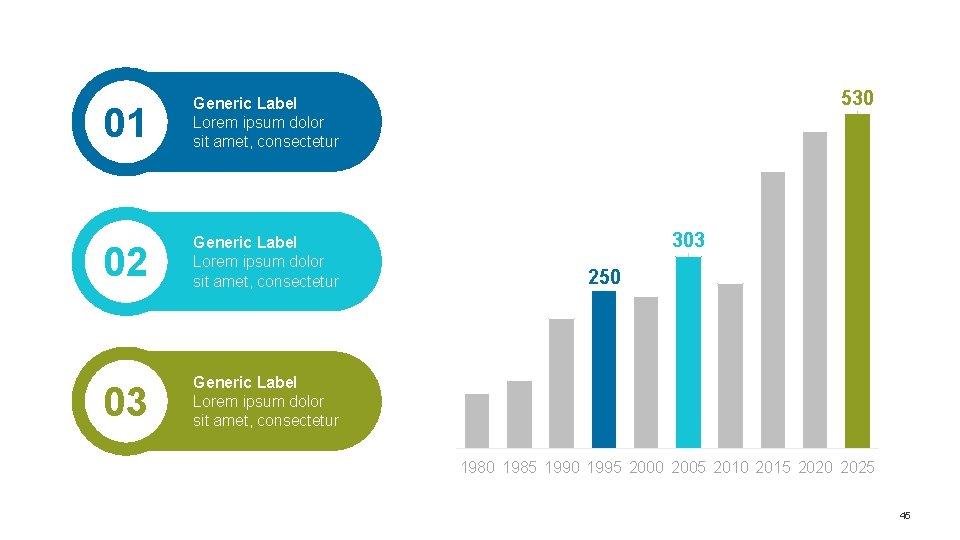
01 Generic Label Lorem ipsum dolor sit amet, consectetur 02 Generic Label Lorem ipsum dolor sit amet, consectetur 03 Generic Label Lorem ipsum dolor sit amet, consectetur 530 303 250 1985 1990 1995 2000 2005 2010 2015 2020 2025 45
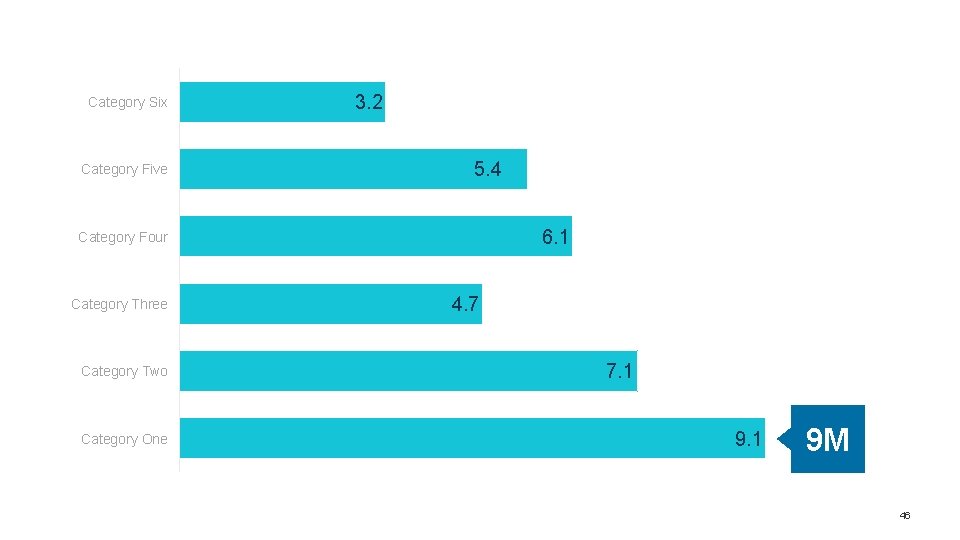
Category Six Category Five 3. 2 5. 4 6. 1 Category Four Category Three Category Two Category One 4. 7 7. 1 9 M 46
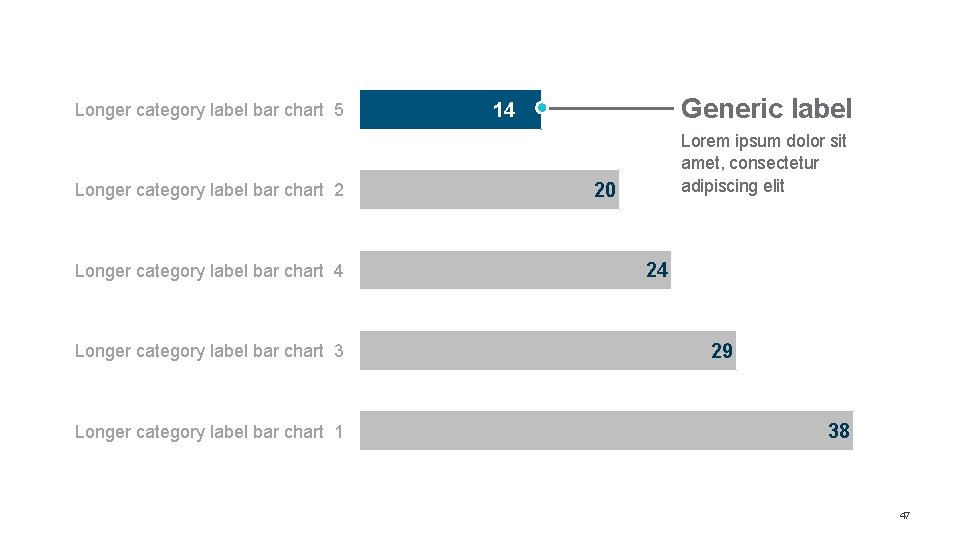
Longer category label bar chart 5 Longer category label bar chart 2 Longer category label bar chart 4 Longer category label bar chart 3 Longer category label bar chart 1 Generic label 14 Lorem ipsum dolor sit amet, consectetur adipiscing elit 20 24 29 38 47
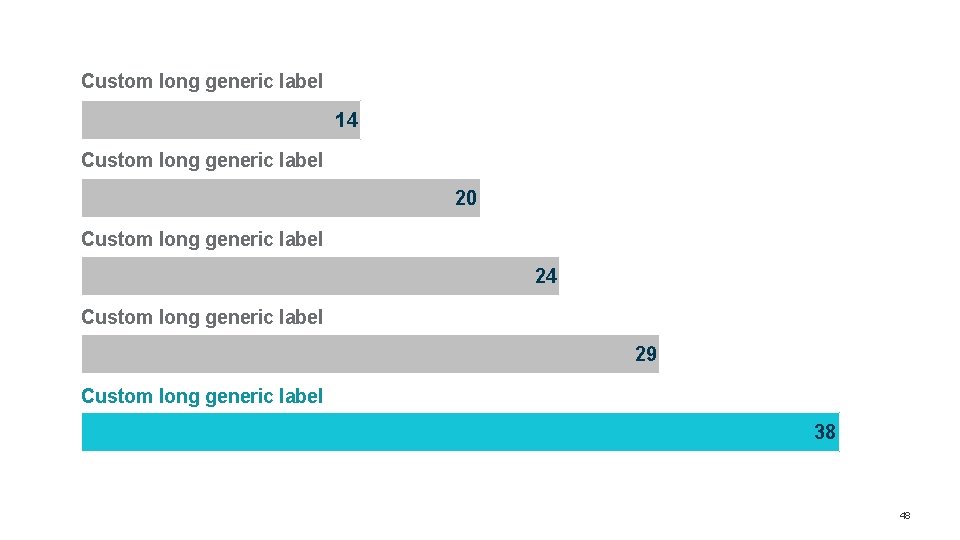
Custom long generic label 14 Custom long generic label 20 Custom long generic label 24 Custom long generic label 29 Custom long generic label 38 48
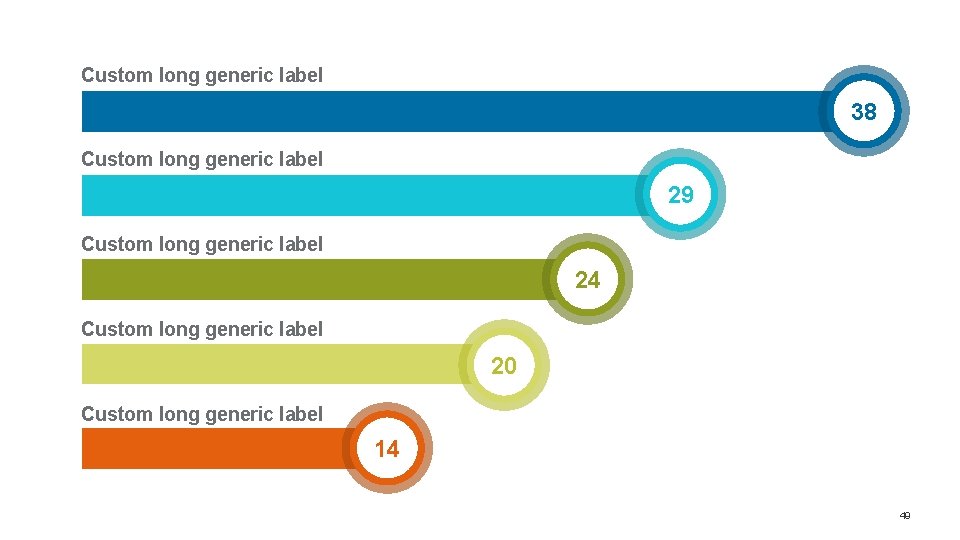
Custom long generic label 38 Custom long generic label 29 Custom long generic label 24 Custom long generic label 20 Custom long generic label 14 49
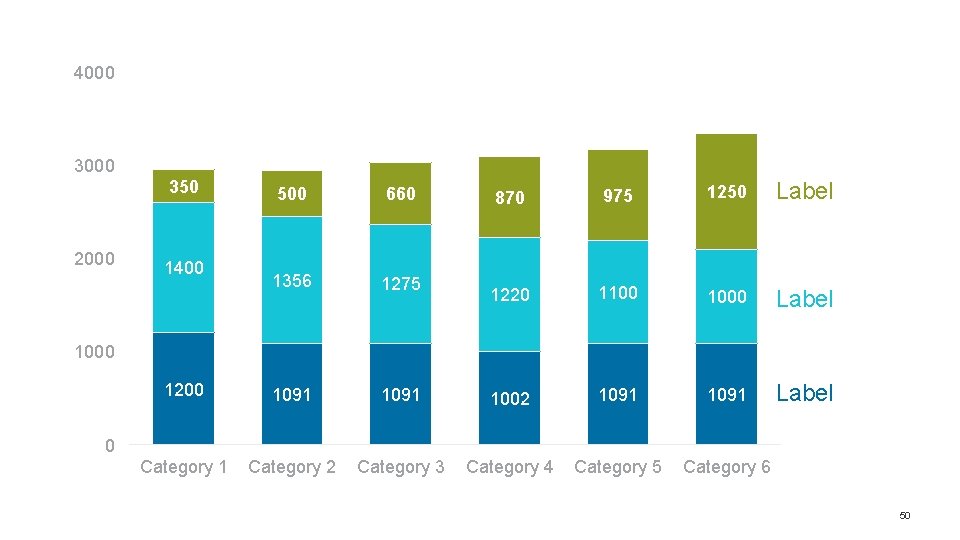
4000 350 2000 870 975 1250 Label 1220 1100 1000 Label 1091 1002 1091 Label Category 3 Category 4 Category 5 Category 6 500 660 1356 1275 1200 1091 Category 2 1400 1000 0 50
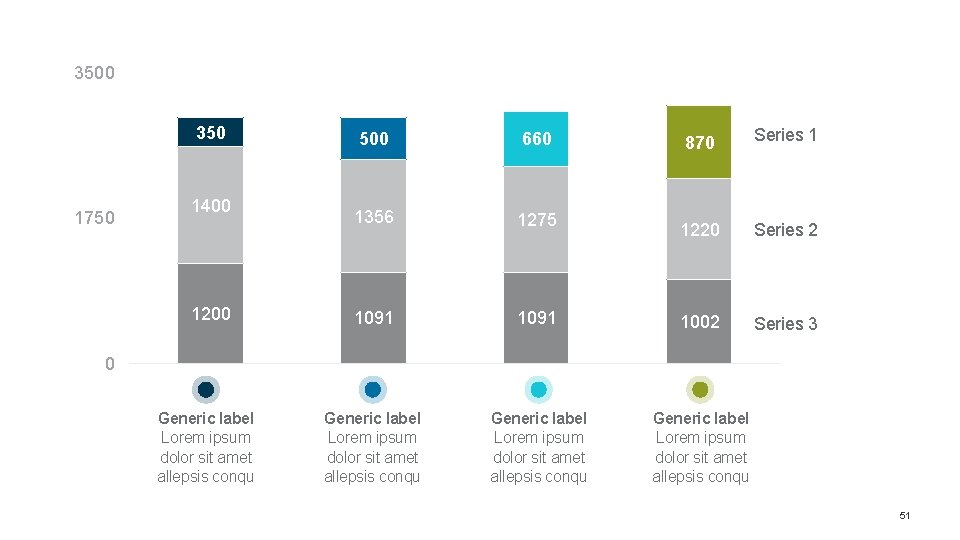
3500 350 1750 1400 1200 870 Series 1 1220 Series 2 1091 1002 Series 3 Generic label Lorem ipsum dolor sit amet allepsis conqu 500 660 1356 1275 1091 Generic label Lorem ipsum dolor sit amet allepsis conqu 0 Generic label Lorem ipsum dolor sit amet allepsis conqu 51
AMPLIFY » LABEL Line 52
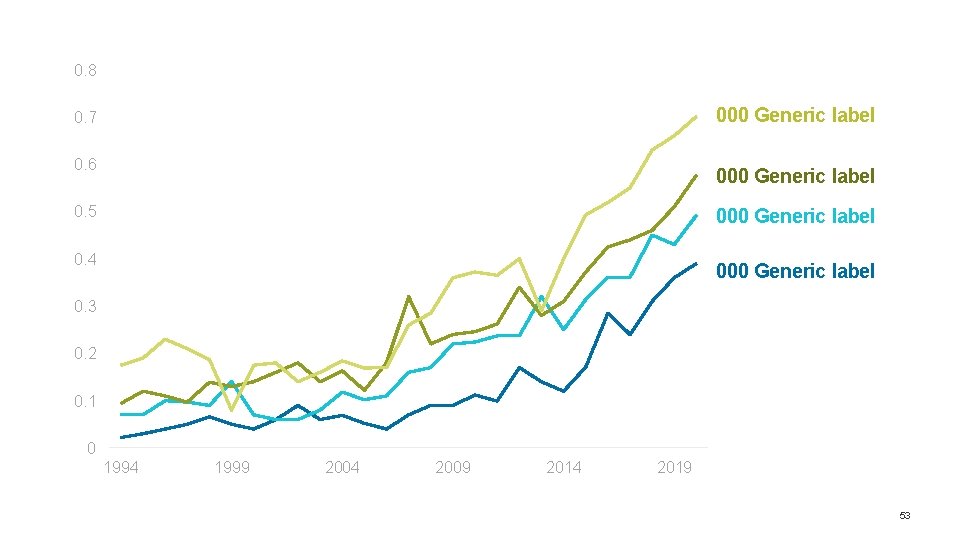
0. 8 000 Generic label 0. 7 0. 6 000 Generic label 0. 5 000 Generic label 0. 4 000 Generic label 0. 3 0. 2 0. 1 0 1994 1999 2004 2009 2014 2019 53
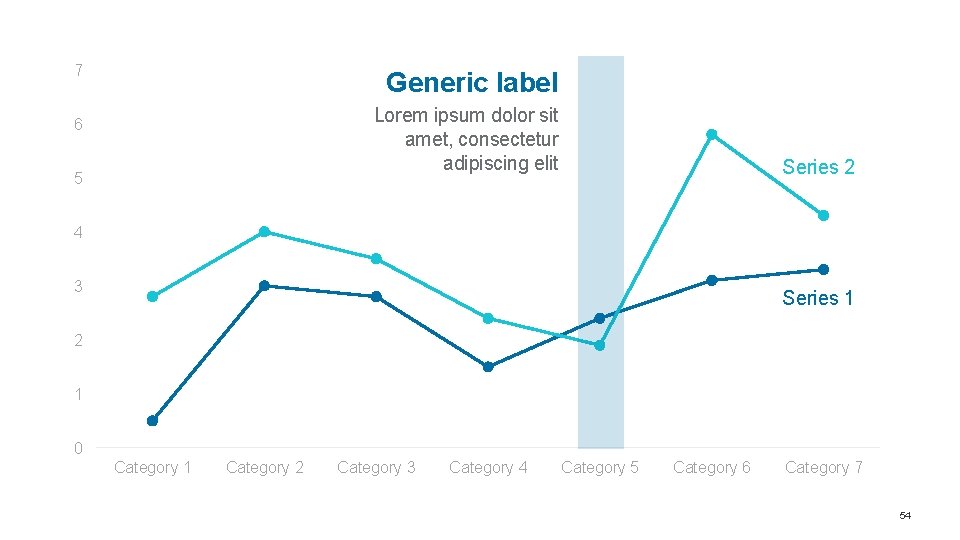
7 Generic label Lorem ipsum dolor sit amet, consectetur adipiscing elit 6 5 Series 2 4 3 Series 1 2 1 0 Category 1 Category 2 Category 3 Category 4 Category 5 Category 6 Category 7 54
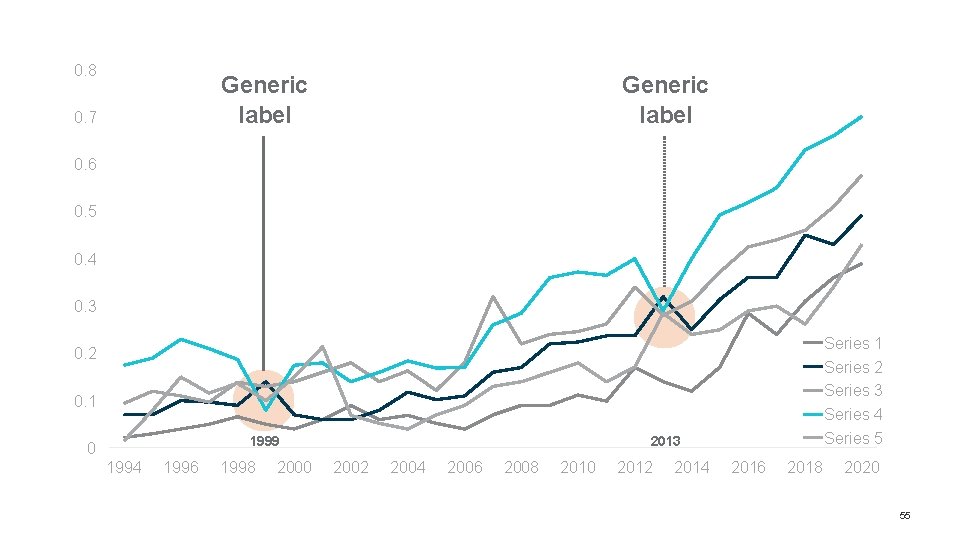
0. 8 Generic label 0. 7 Generic label 0. 6 0. 5 0. 4 0. 3 Series 1 Series 2 Series 3 Series 4 Series 5 0. 2 0. 1 1999 0 1994 1996 1998 2000 2013 2002 2004 2006 2008 2010 2012 2014 2016 2018 2020 55
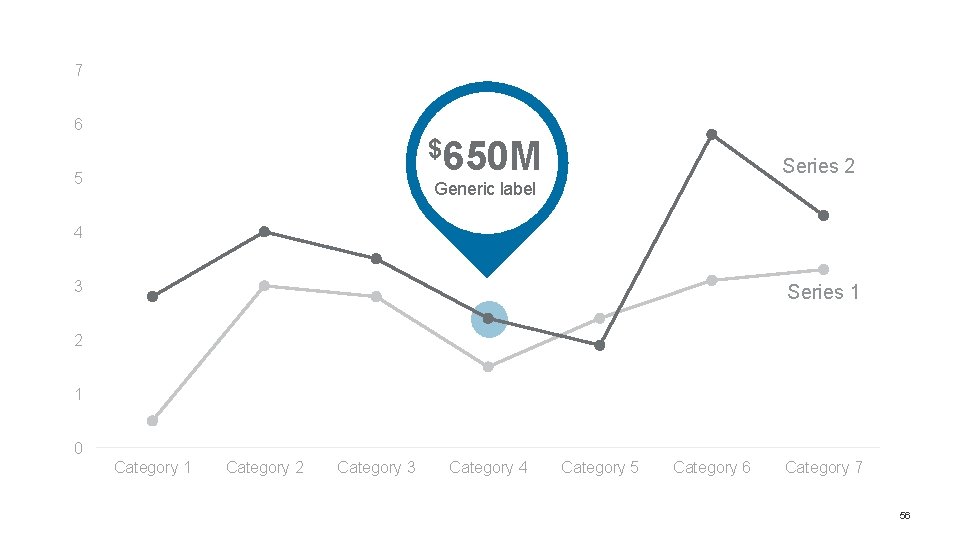
7 6 $650 M 5 Series 2 Generic label 4 3 Series 1 2 1 0 Category 1 Category 2 Category 3 Category 4 Category 5 Category 6 Category 7 56
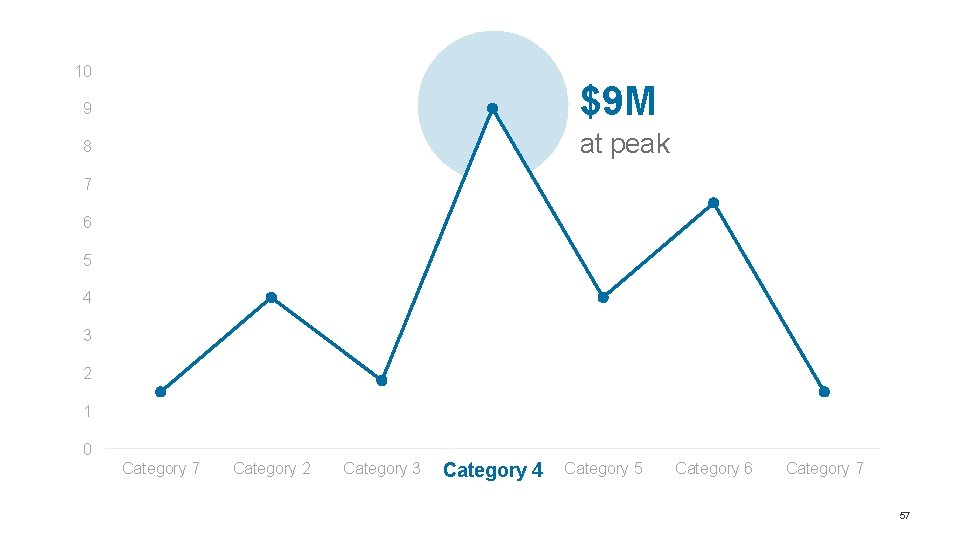
10 9 $9 M 8 at peak 7 6 5 4 3 2 1 0 Category 7 Category 2 Category 3 Category 44 Category 5 Category 6 Category 7 57
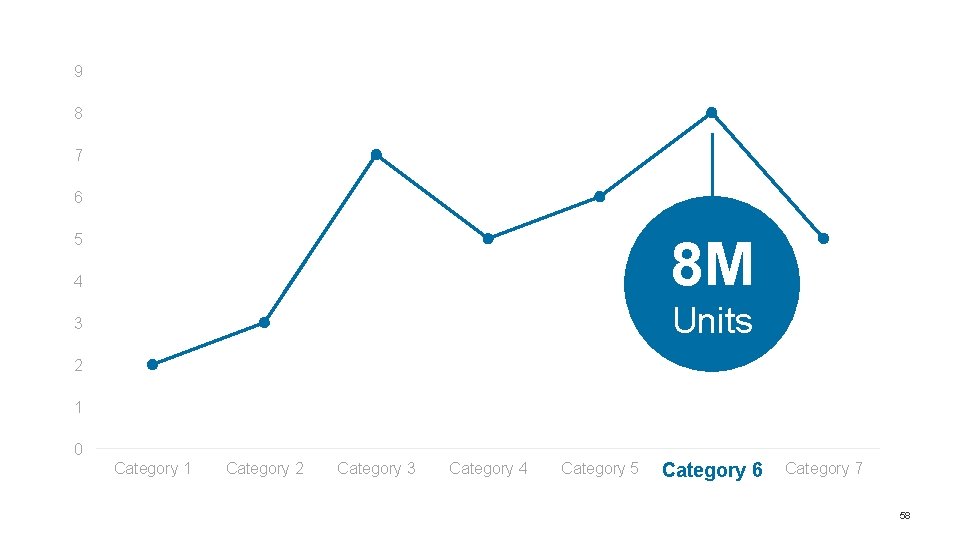
9 8 7 6 5 8 M 4 Units 3 2 1 0 Category 1 Category 2 Category 3 Category 4 Category 5 Category 66 Category 7 58
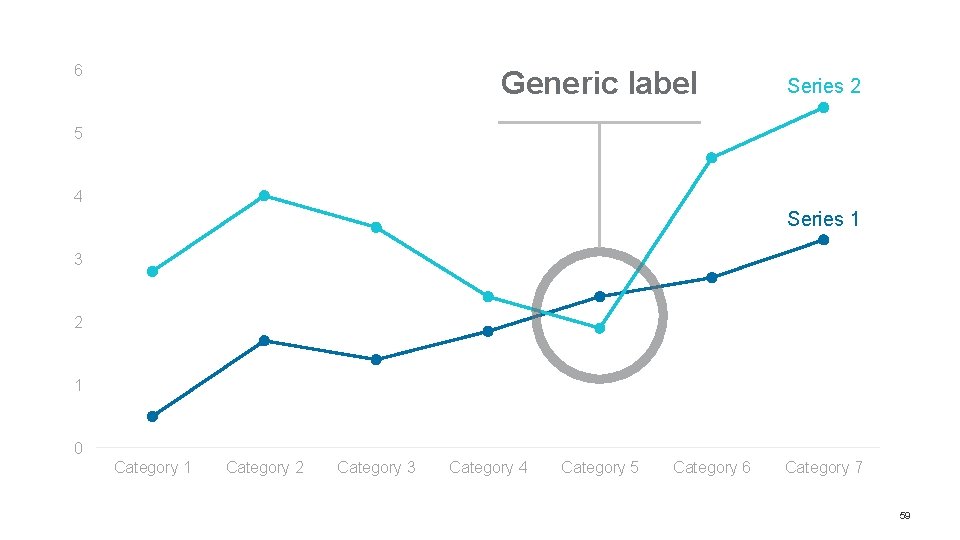
6 Generic label Series 2 5 4 Series 1 3 2 1 0 Category 1 Category 2 Category 3 Category 4 Category 5 Category 6 Category 7 59
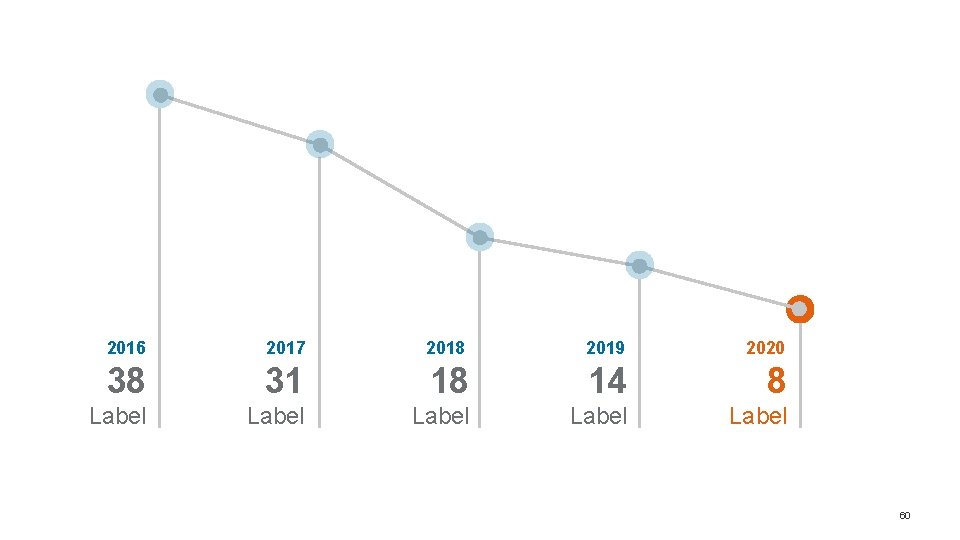
2016 2017 2018 2019 2020 38 31 18 14 8 Label Label 60
AMPLIFY » LABEL Pie & Donut 61
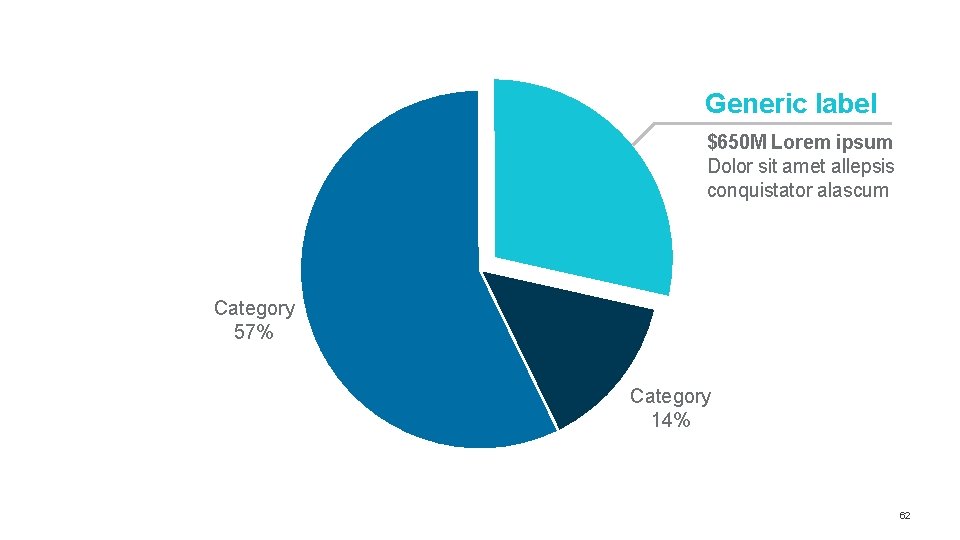
Generic label $650 M Lorem ipsum Dolor sit amet allepsis conquistator alascum Category 57% Category 14% 62
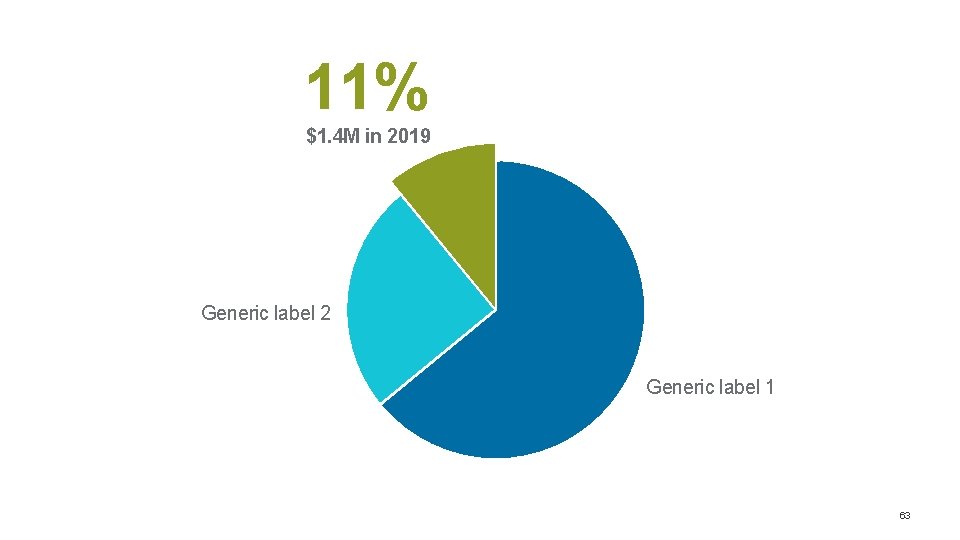
11% $1. 4 M in 2019 Generic label 2 Generic label 1 63
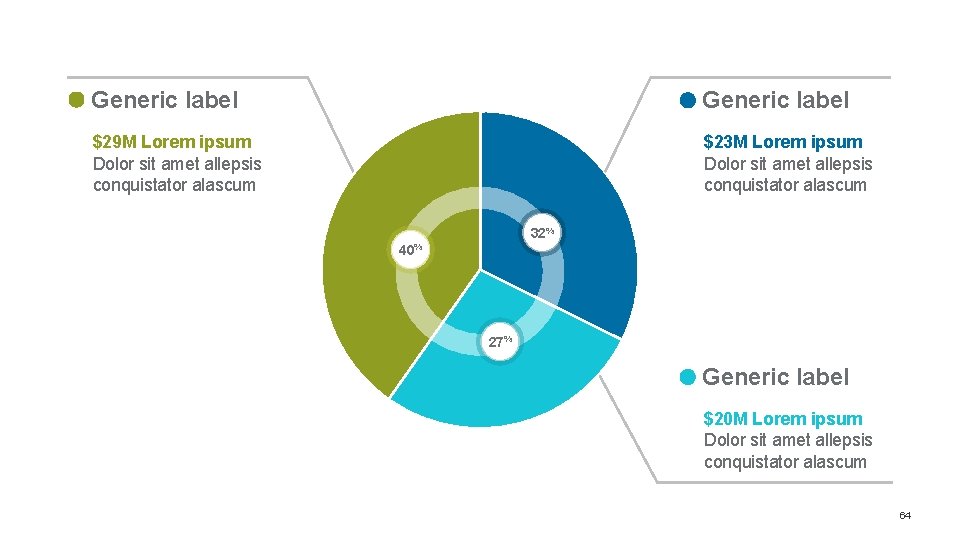
Generic label $29 M Lorem ipsum Dolor sit amet allepsis conquistator alascum $23 M Lorem ipsum Dolor sit amet allepsis conquistator alascum 32% 40% 27% Generic label $20 M Lorem ipsum Dolor sit amet allepsis conquistator alascum 64
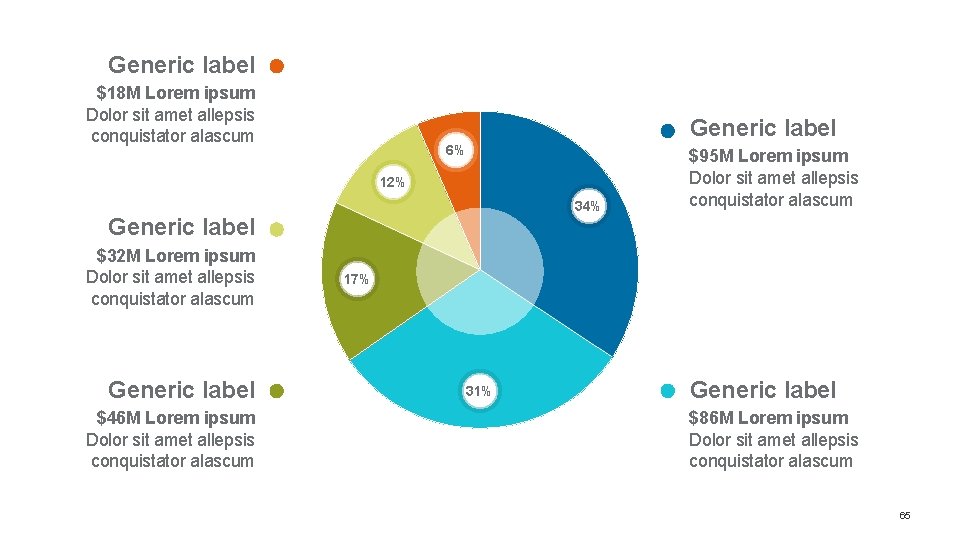
Generic label $18 M Lorem ipsum Dolor sit amet allepsis conquistator alascum Generic label 6% 12% 34% Generic label $32 M Lorem ipsum Dolor sit amet allepsis conquistator alascum Generic label $46 M Lorem ipsum Dolor sit amet allepsis conquistator alascum $95 M Lorem ipsum Dolor sit amet allepsis conquistator alascum 17% 31% Generic label $86 M Lorem ipsum Dolor sit amet allepsis conquistator alascum 65
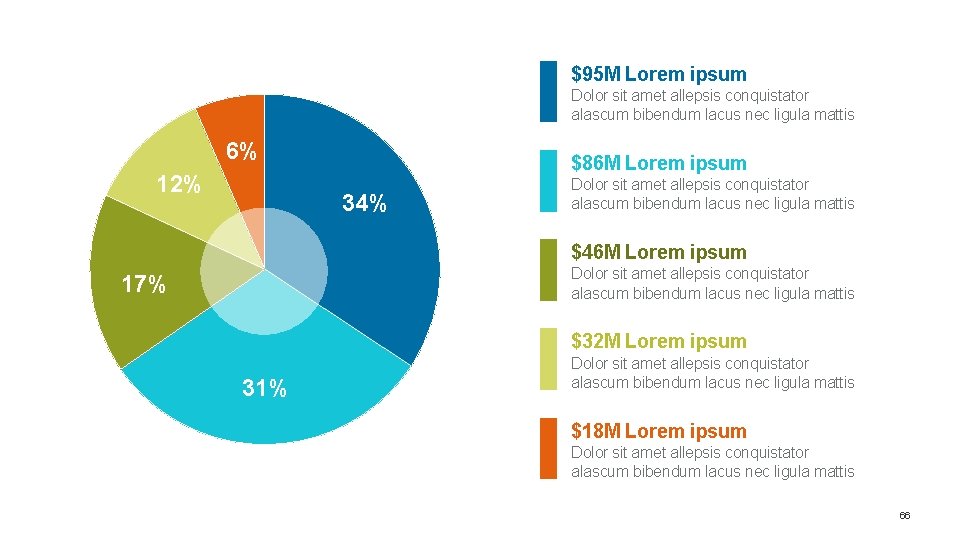
$95 M Lorem ipsum Dolor sit amet allepsis conquistator alascum bibendum lacus nec ligula mattis 6% 12% $86 M Lorem ipsum 34% Dolor sit amet allepsis conquistator alascum bibendum lacus nec ligula mattis $46 M Lorem ipsum Dolor sit amet allepsis conquistator alascum bibendum lacus nec ligula mattis 17% $32 M Lorem ipsum 31% Dolor sit amet allepsis conquistator alascum bibendum lacus nec ligula mattis $18 M Lorem ipsum Dolor sit amet allepsis conquistator alascum bibendum lacus nec ligula mattis 66
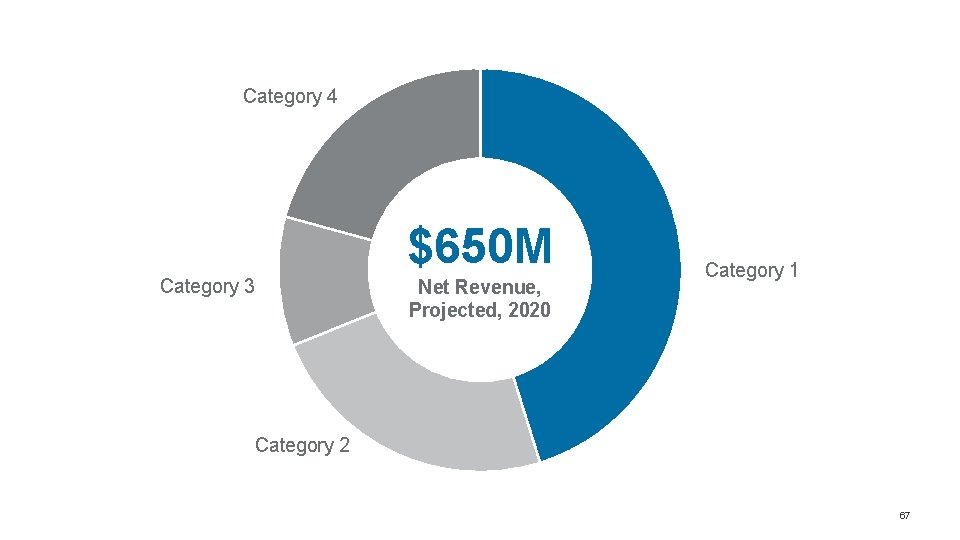
Category 4 $650 M Category 3 Net Revenue, Projected, 2020 Category 1 Category 2 67
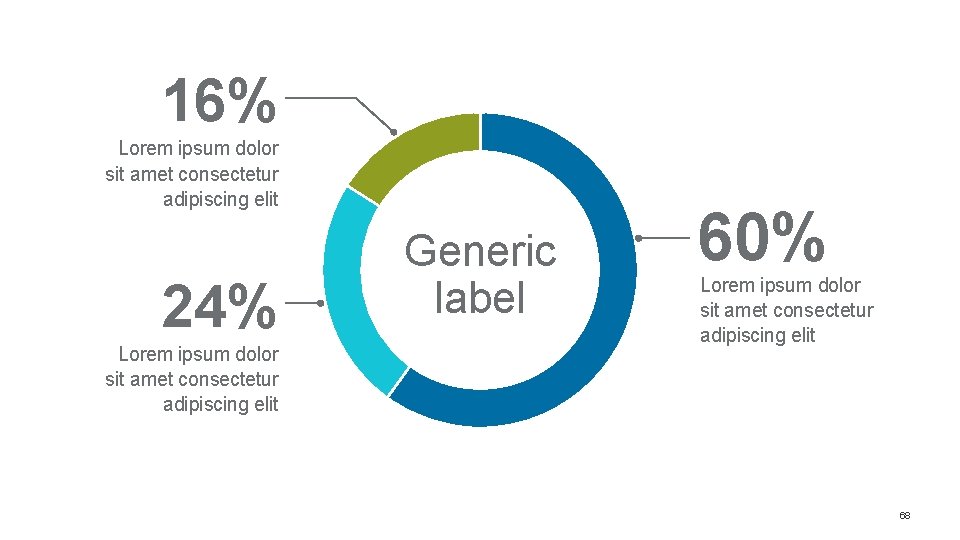
16% Lorem ipsum dolor sit amet consectetur adipiscing elit 24% Lorem ipsum dolor sit amet consectetur adipiscing elit Generic label 60% Lorem ipsum dolor sit amet consectetur adipiscing elit 68
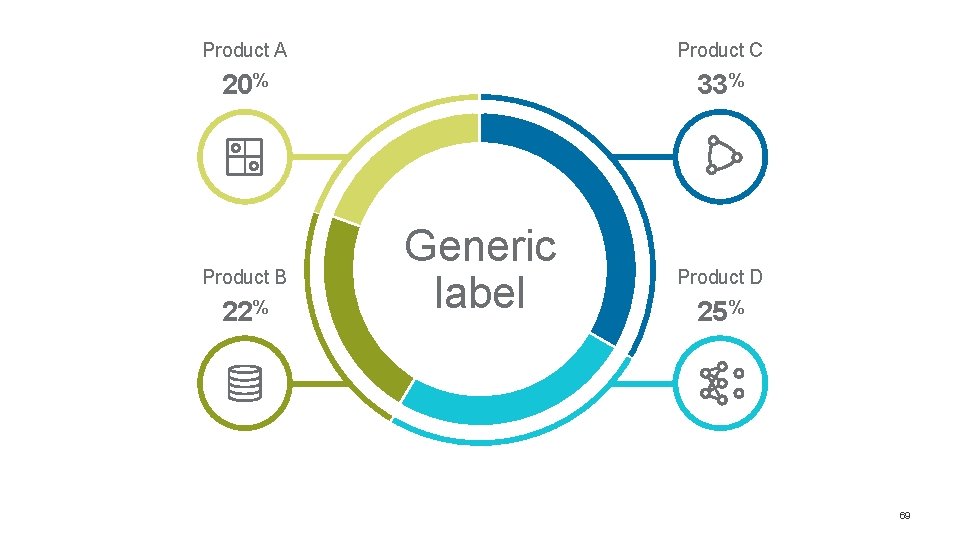
Product A Product C 20% 33% Product B 22% Generic label Product D 25% 69
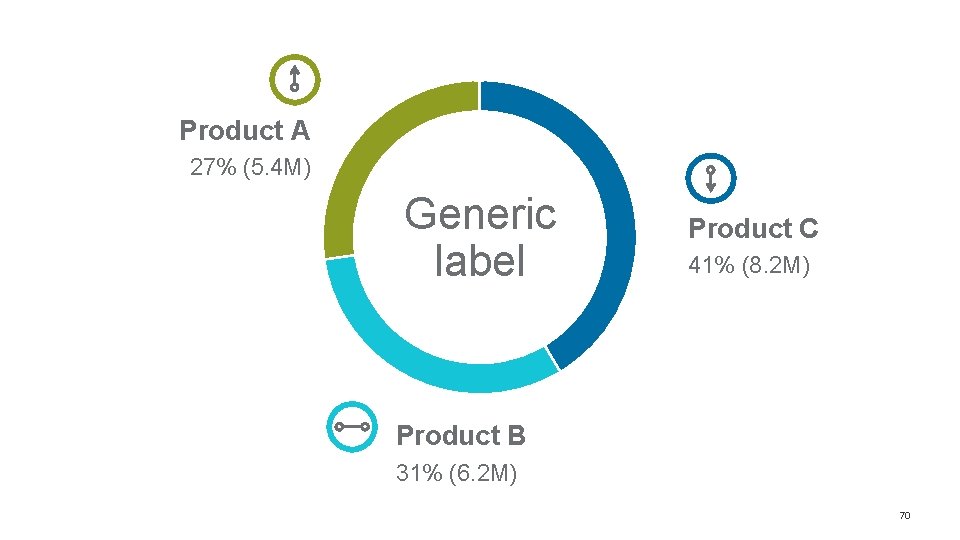
Product A 27% (5. 4 M) Generic label Product C 41% (8. 2 M) Product B 31% (6. 2 M) 70
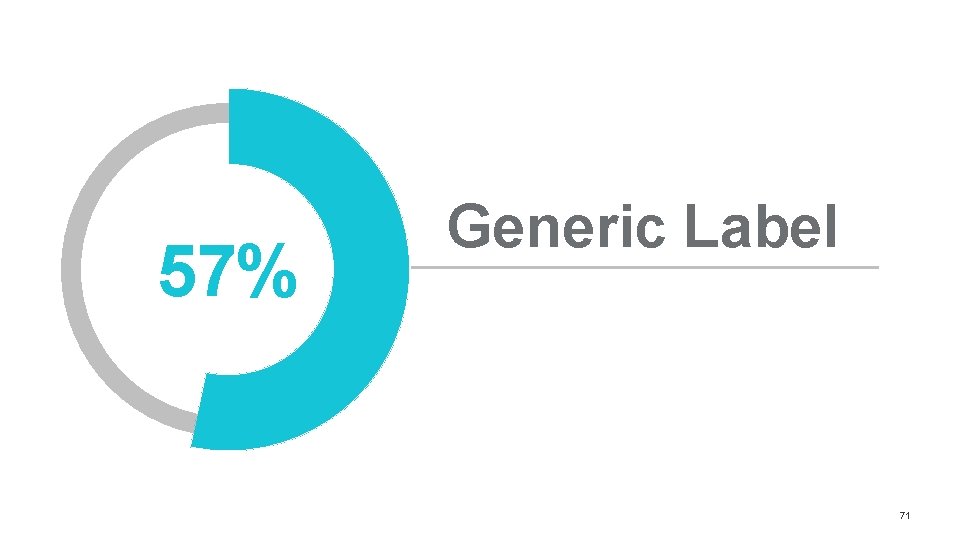
57% Generic Label 71
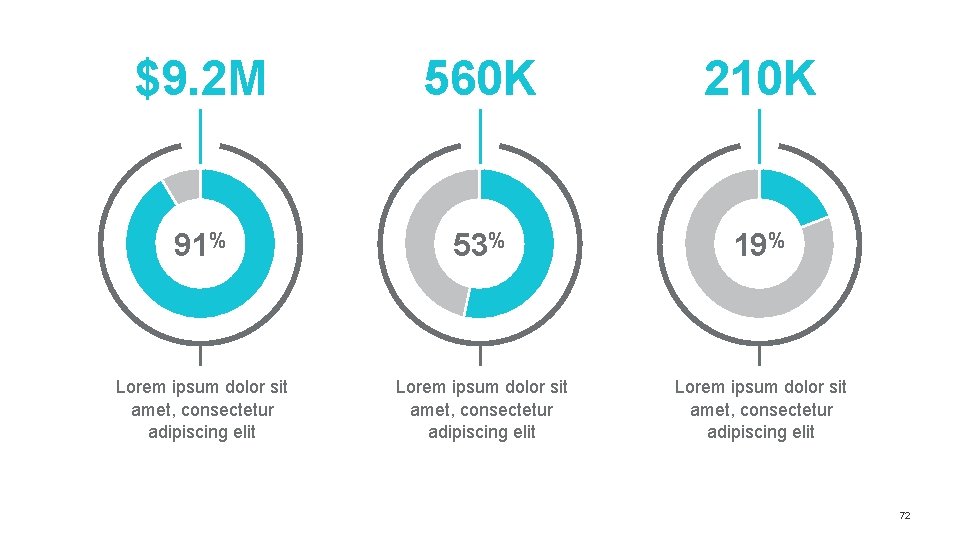
$9. 2 M 560 K 210 K 91% 53% 19% Lorem ipsum dolor sit amet, consectetur adipiscing elit 72
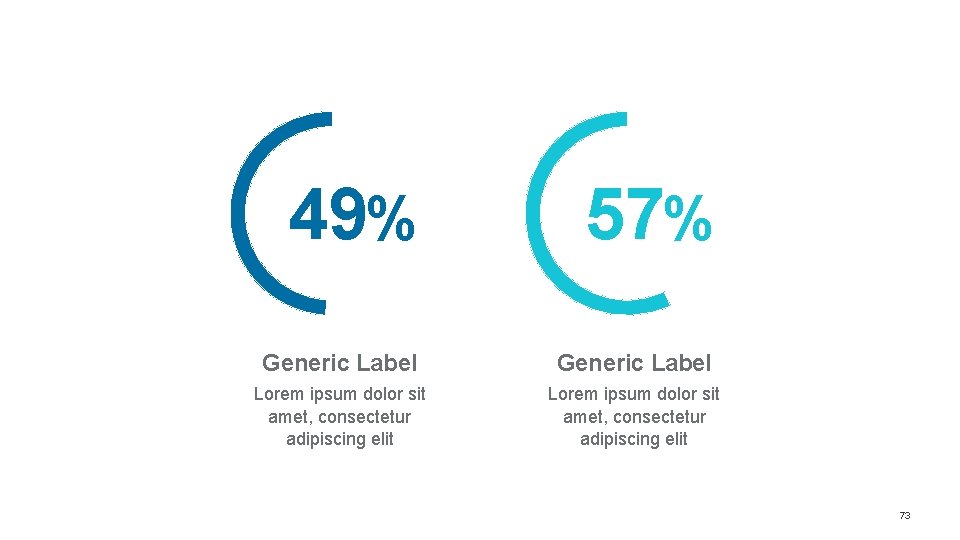
49% 57% Generic Label Lorem ipsum dolor sit amet, consectetur adipiscing elit 73
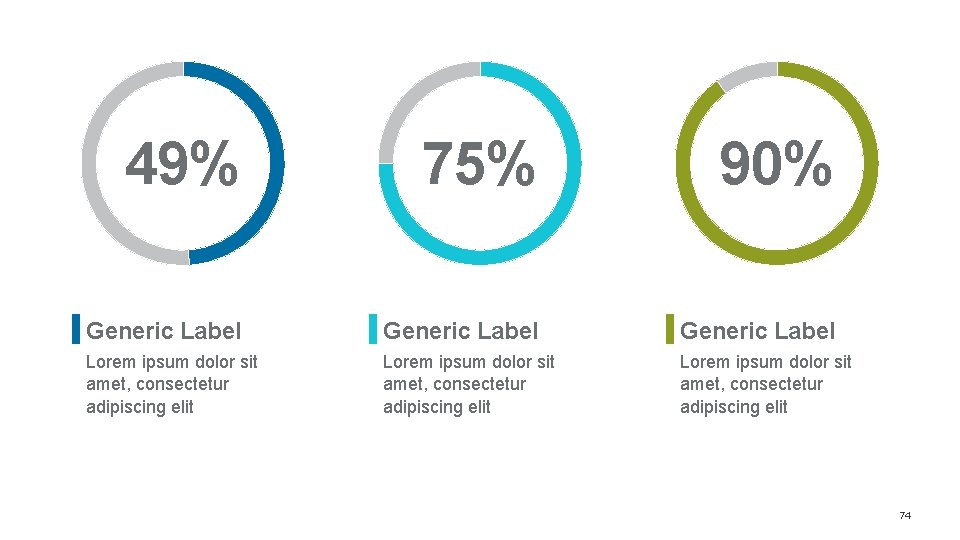
49% 75% 90% Generic Label Lorem ipsum dolor sit amet, consectetur adipiscing elit 74
CHAPTER TWO Add Math Include aggregate information on a chart in order to make the data meaning more clear 75
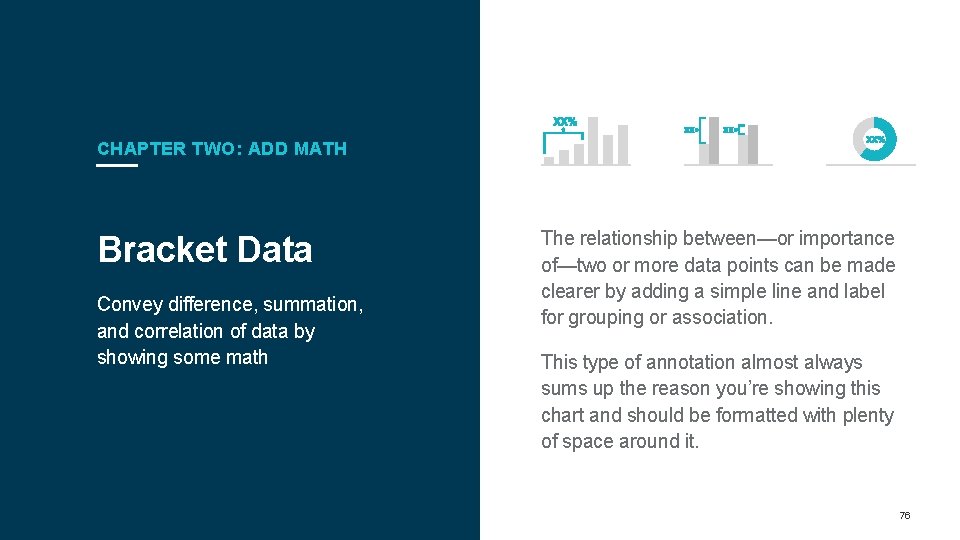
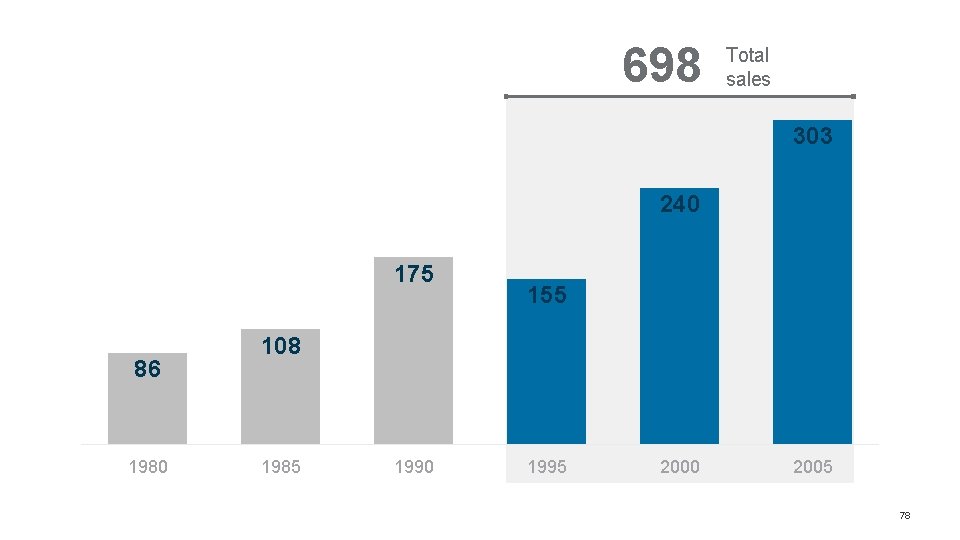
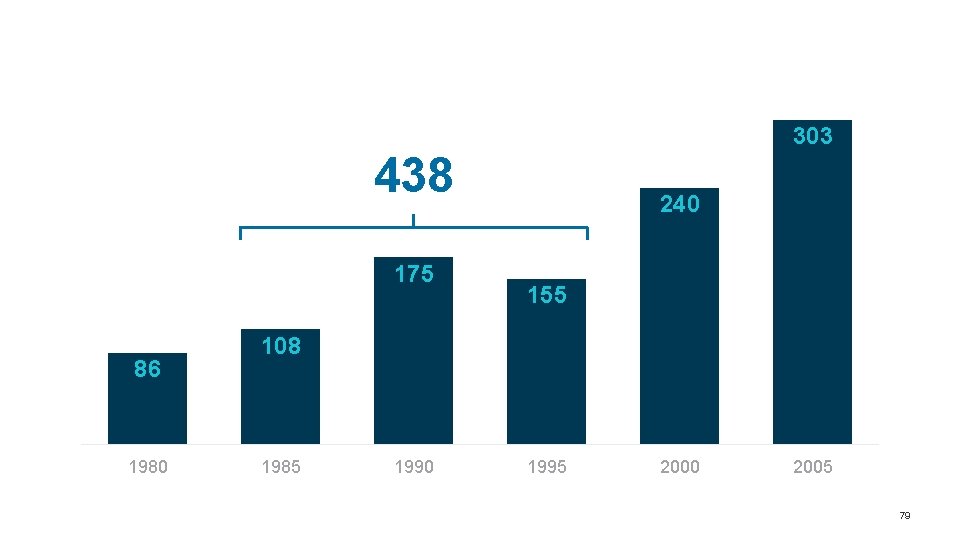
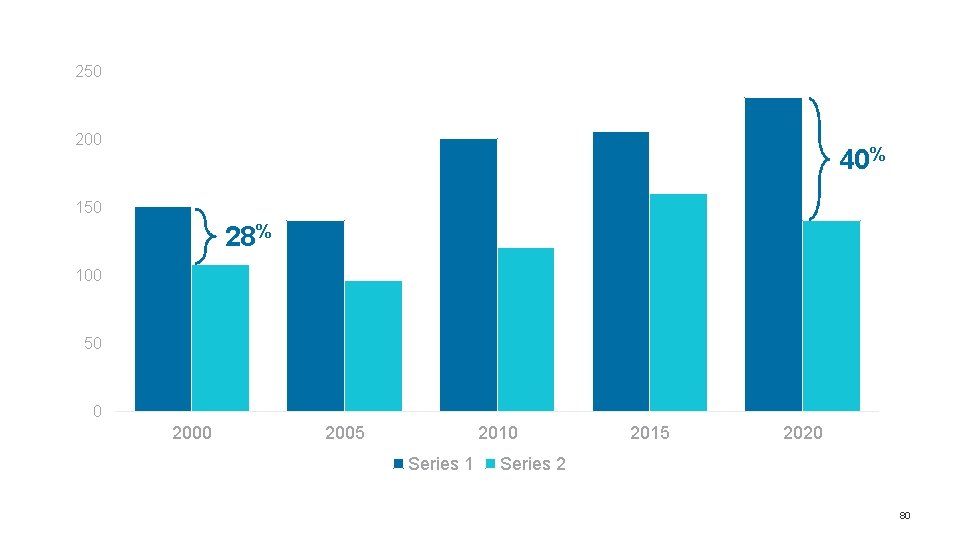
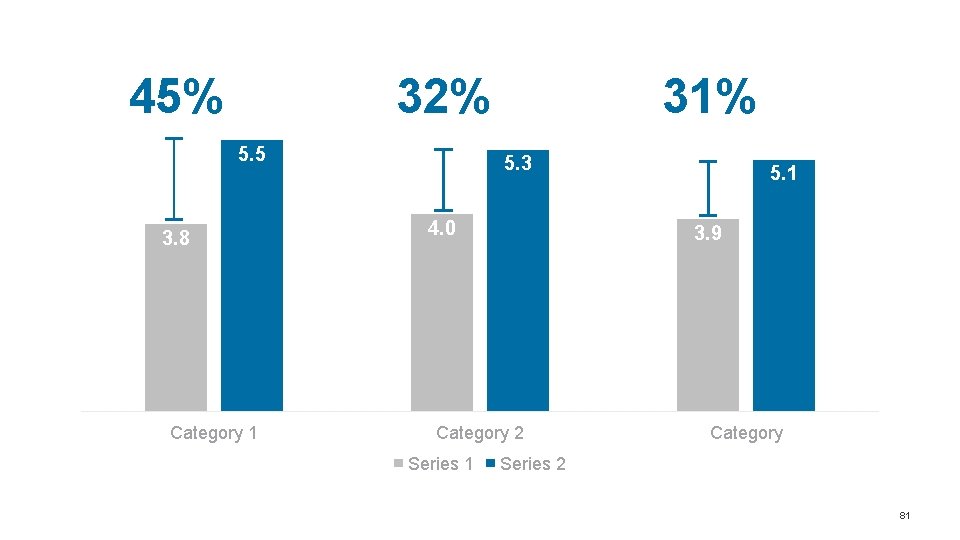
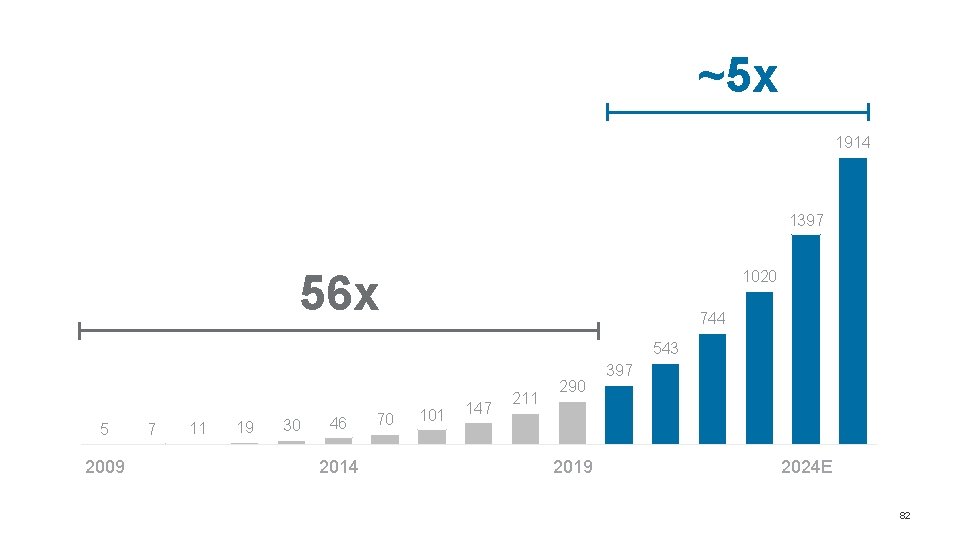
CHAPTER TWO: ADD MATH Bracket Data Convey difference, summation, and correlation of data by showing some math The relationship between—or importance of—two or more data points can be made clearer by adding a simple line and label for grouping or association. This type of annotation almost always sums up the reason you’re showing this chart and should be formatted with plenty of space around it. 76
ADD MATH » BRACKET Column, Bar & Stack 77
698 Total sales 303 240 175 86 1980 155 108 1985 1990 1995 2000 2005 78
303 438 175 86 1980 240 155 108 1985 1990 1995 2000 2005 79
250 200 40% 150 28% 100 50 0 2005 2010 Series 1 2015 2020 Series 2 80
45% 32% 5. 5 3. 8 Category 1 31% 5. 3 4. 0 3. 9 Category 2 Series 1 5. 1 Category Series 2 81
~5 x 1914 1397 56 x 1020 744 543 5 2009 7 11 19 30 46 2014 70 101 147 211 290 2019 397 2024 E 82
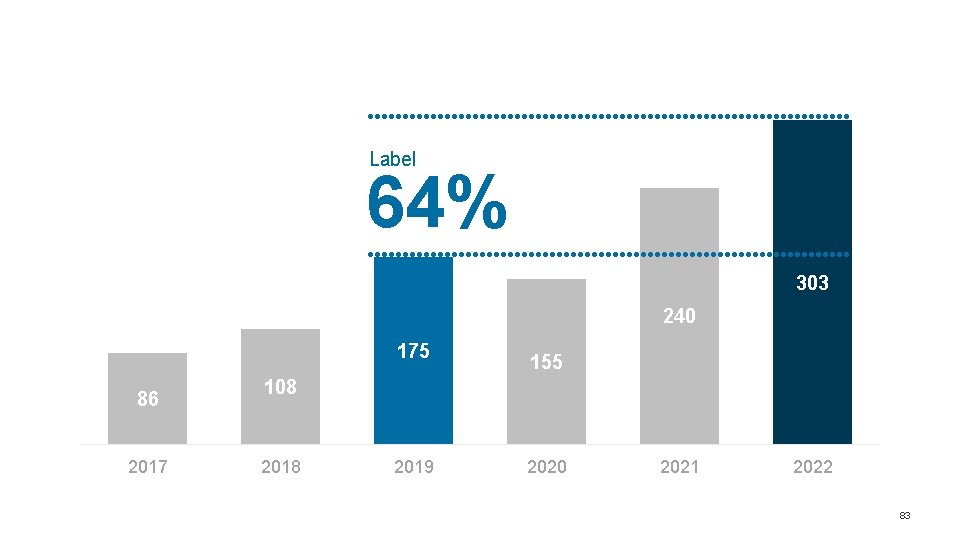
Label 64% 303 240 175 86 2017 155 108 2019 2020 2021 2022 83
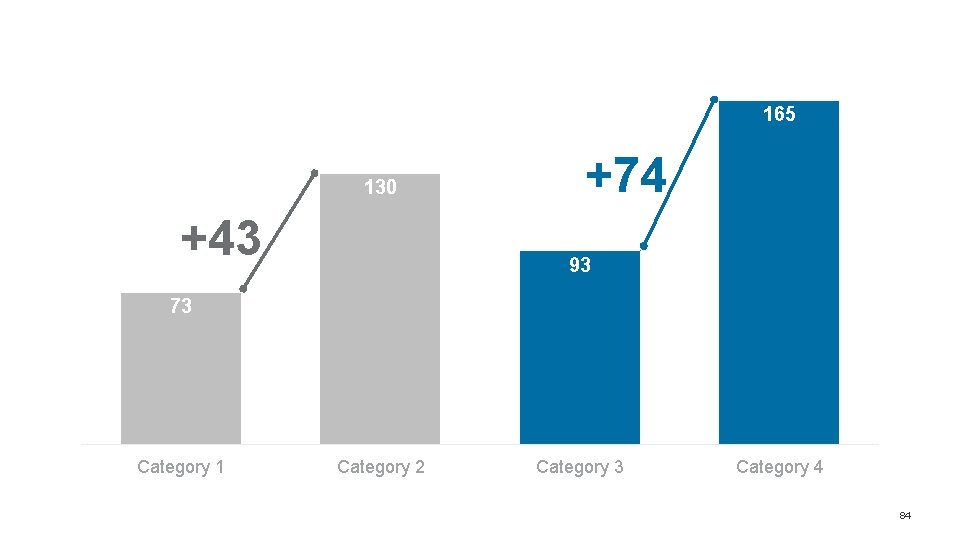
165 130 +43 +74 93 73 Category 1 Category 2 Category 3 Category 4 84
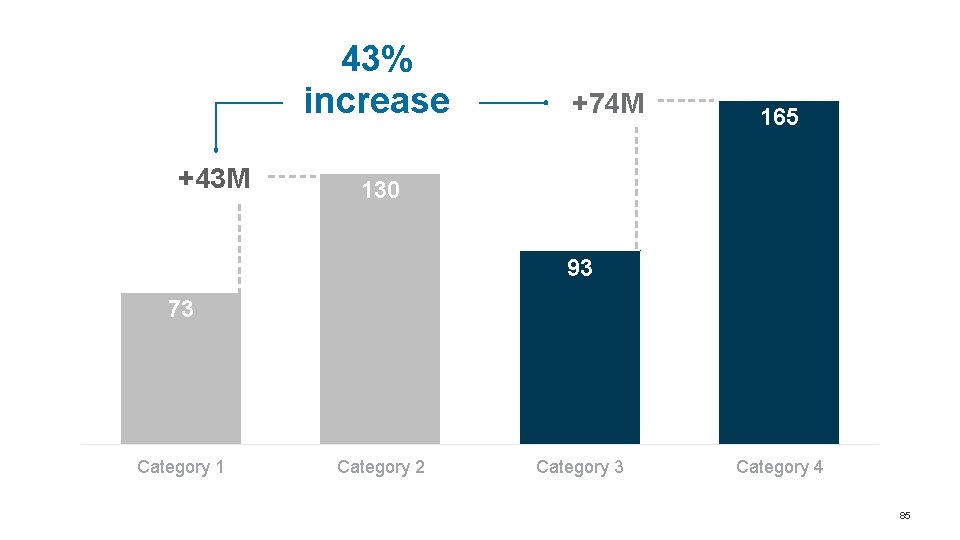
43% increase +43 M +74 M 165 130 93 73 Category 1 Category 2 Category 3 Category 4 85
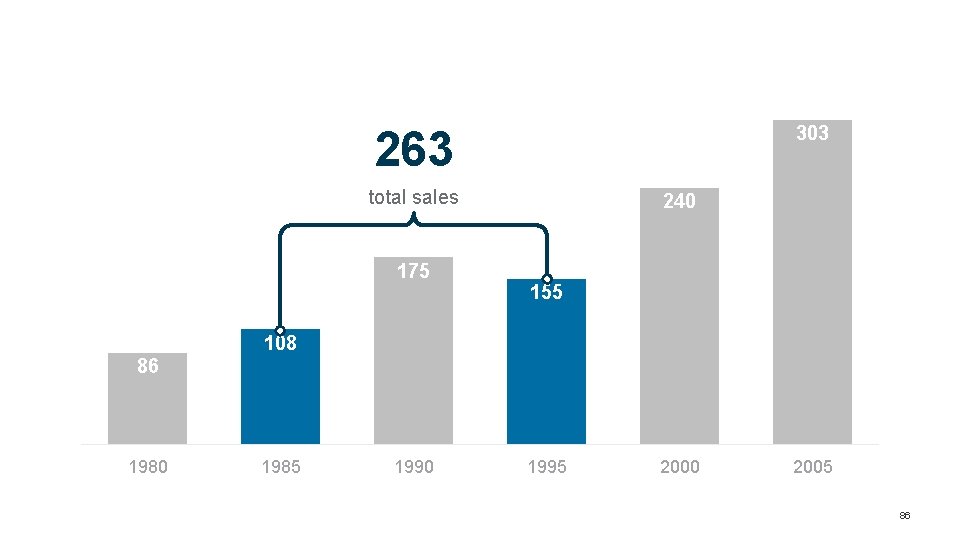
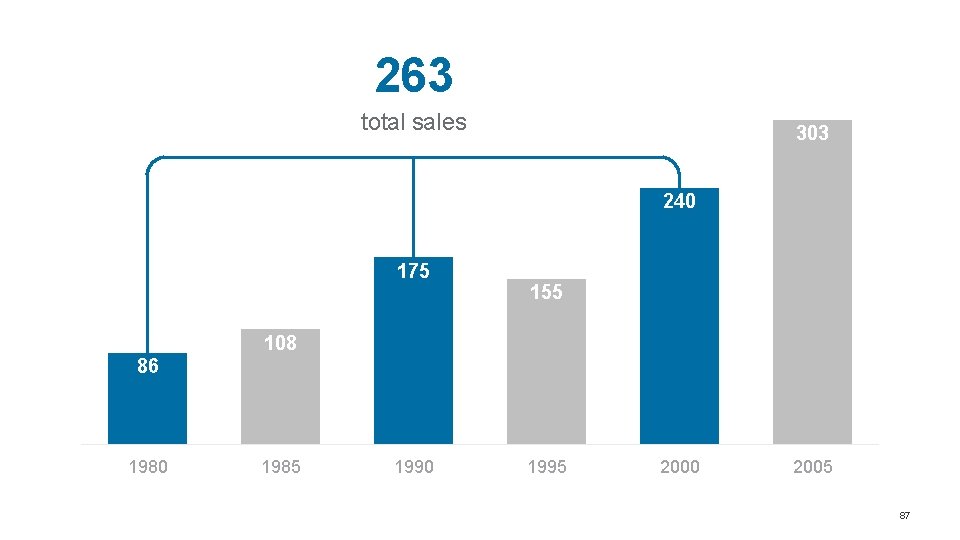
303 263 total sales 175 240 155 108 86 1980 1985 1990 1995 2000 2005 86
263 total sales 303 240 175 155 108 86 1980 1985 1990 1995 2000 2005 87
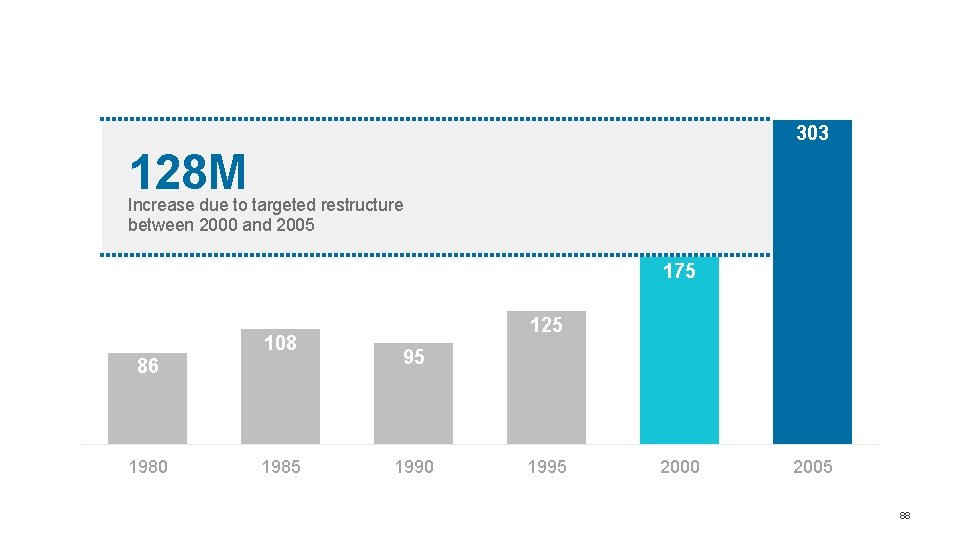
303 128 M Increase due to targeted restructure between 2000 and 2005 175 108 86 1980 1985 125 95 1990 1995 2000 2005 88
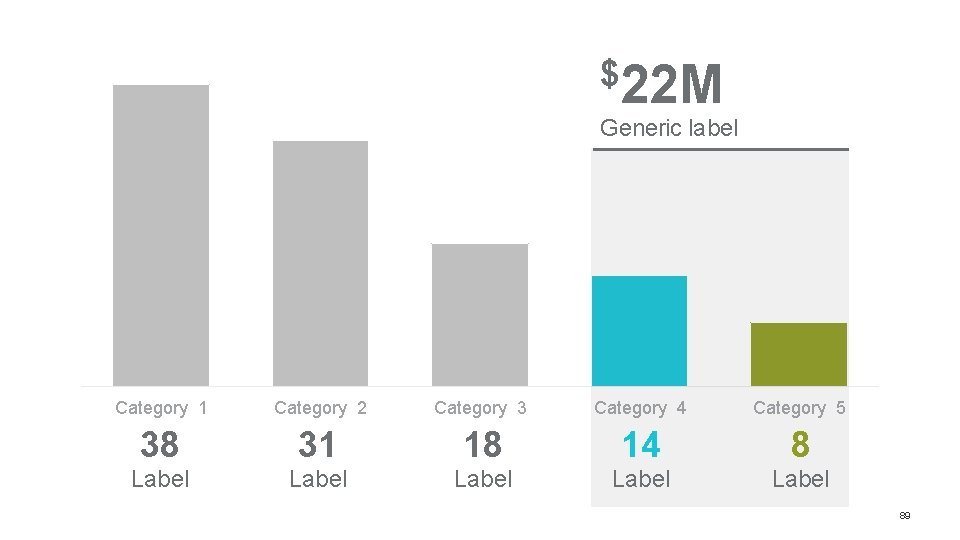
$22 M Generic label Category 1 Category 2 Category 3 Category 4 Category 5 38 31 18 14 8 Label Label 89
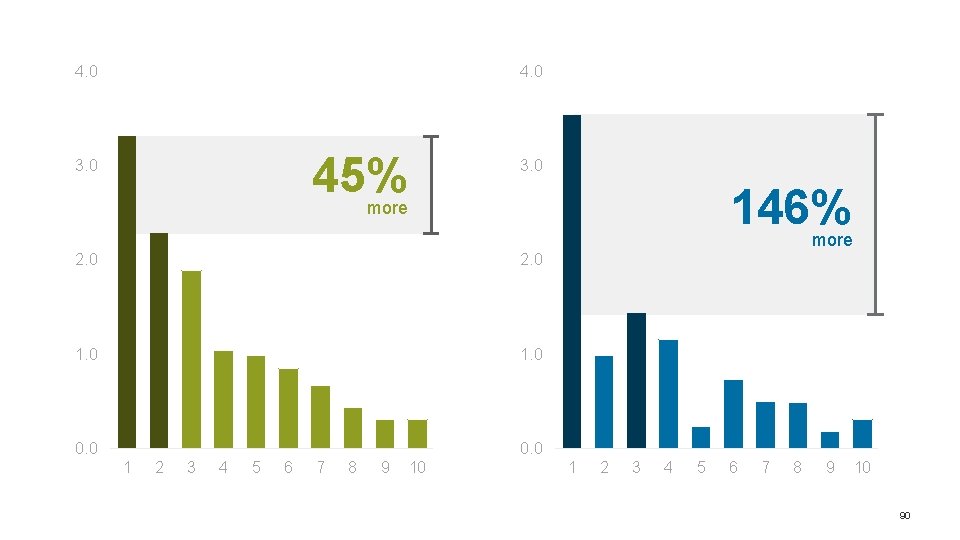
4. 0 45% 3. 0 146% more 2. 0 1. 0 0. 0 1 2 3 4 5 6 7 8 9 10 90
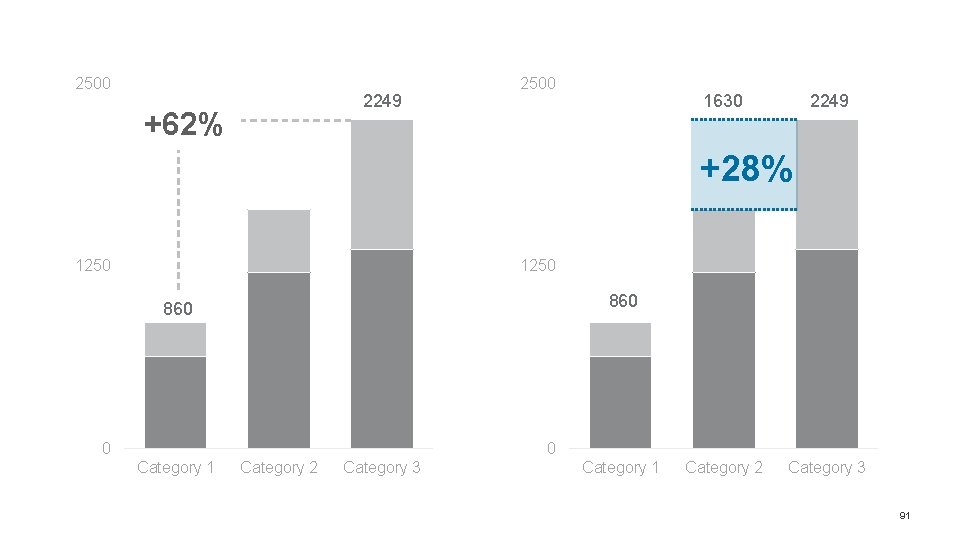
2500 2249 +62% 2500 1630 2249 +28% 1250 860 0 0 Category 1 Category 2 Category 3 91
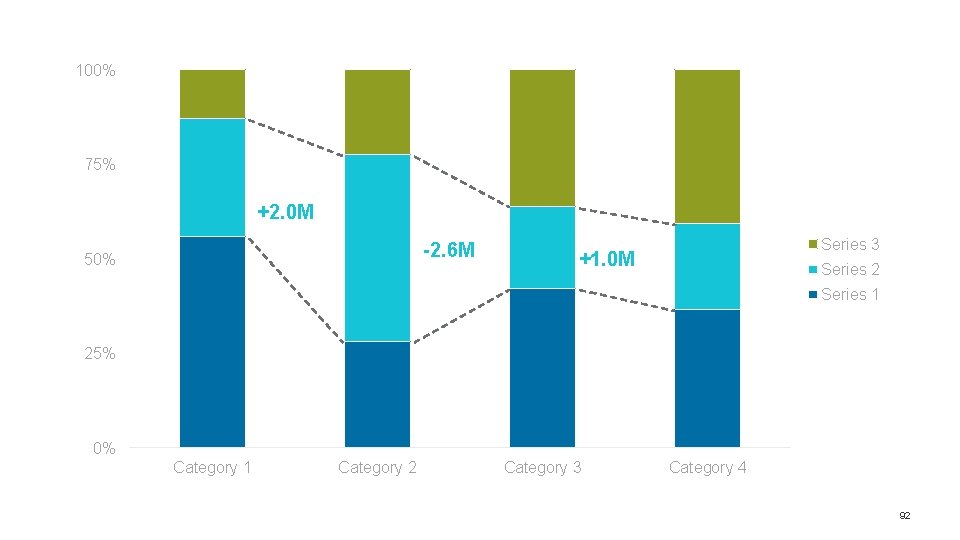
100% 75% +2. 0 M -2. 6 M 50% Series 3 +1. 0 M Series 2 Series 1 25% 0% Category 1 Category 2 Category 3 Category 4 92
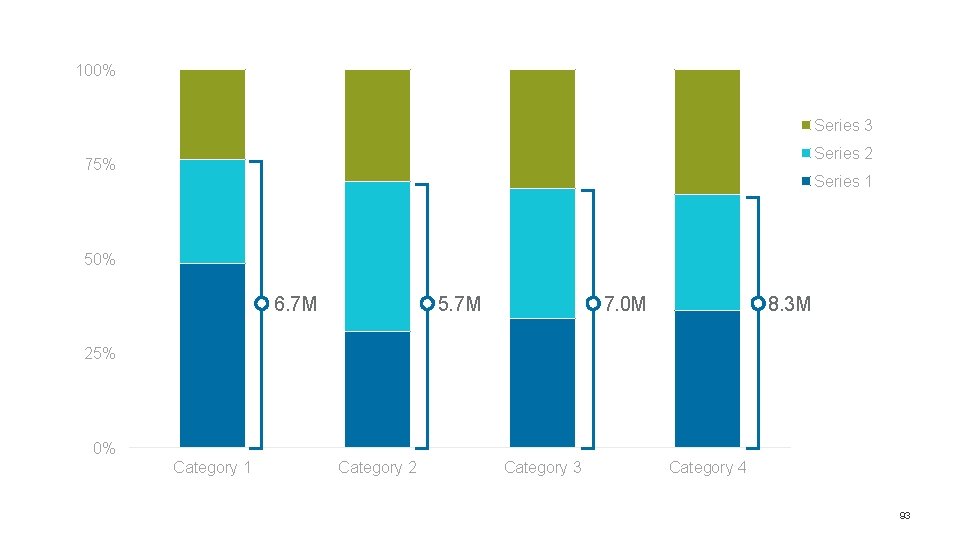
100% Series 3 Series 2 75% Series 1 50% 6. 7 M 5. 7 M 7. 0 M 8. 3 M 25% 0% Category 1 Category 2 Category 3 Category 4 93
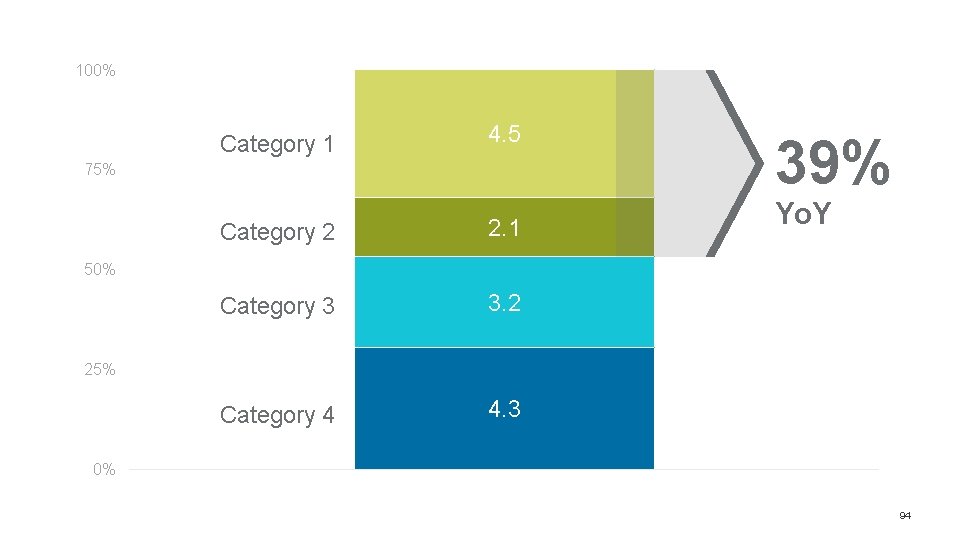
100% Category 1 4. 5 Category 2 2. 1 Category 3 3. 2 Category 4 4. 3 75% 39% Yo. Y 50% 25% 0% 94
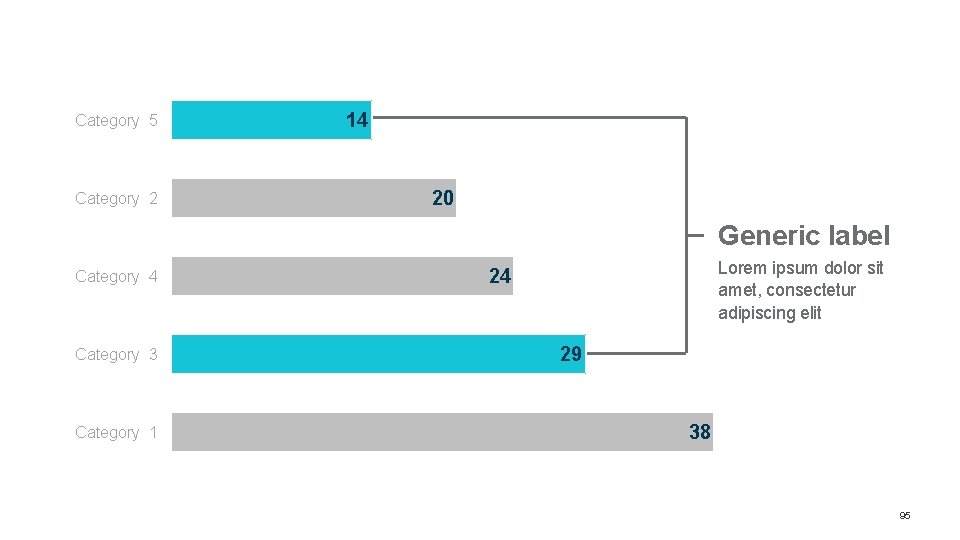
Category 5 Category 2 14 20 Generic label Category 4 Category 3 Category 1 Lorem ipsum dolor sit amet, consectetur adipiscing elit 24 29 38 95
ADD MATH » BRACKET Line 96
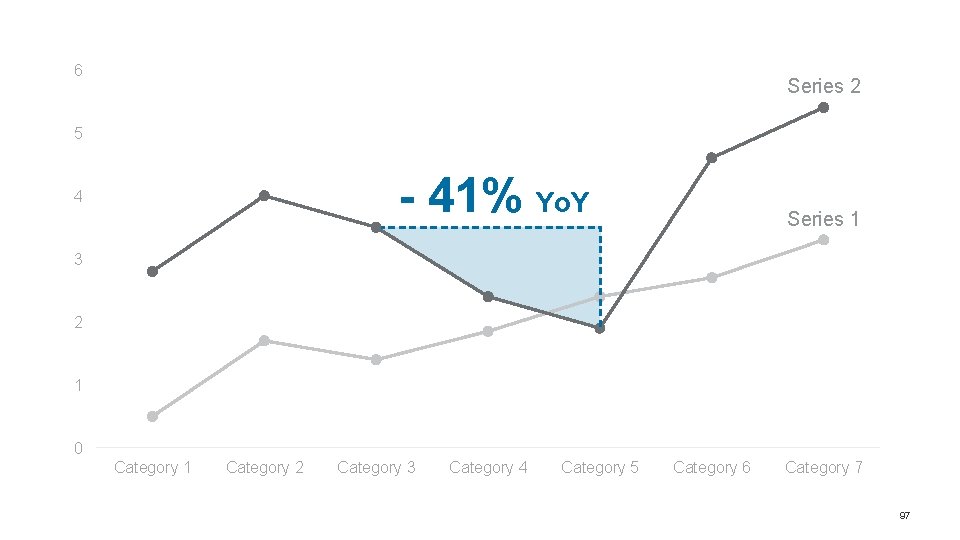
6 Series 2 5 - 41% Yo. Y 4 Series 1 3 2 1 0 Category 1 Category 2 Category 3 Category 4 Category 5 Category 6 Category 7 97
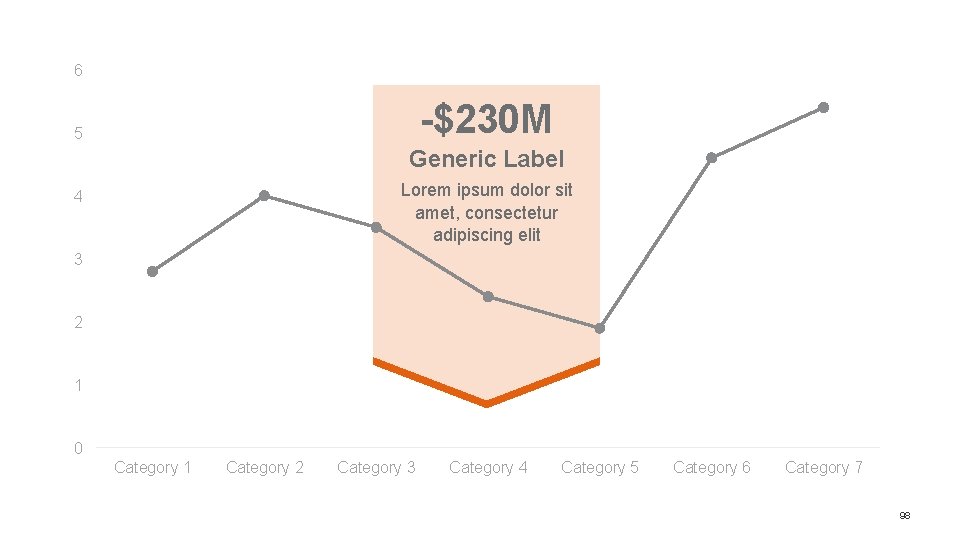
6 -$230 M 5 Generic Label Lorem ipsum dolor sit amet, consectetur adipiscing elit 4 3 2 1 0 Category 1 Category 2 Category 3 Category 4 Category 5 Category 6 Category 7 98
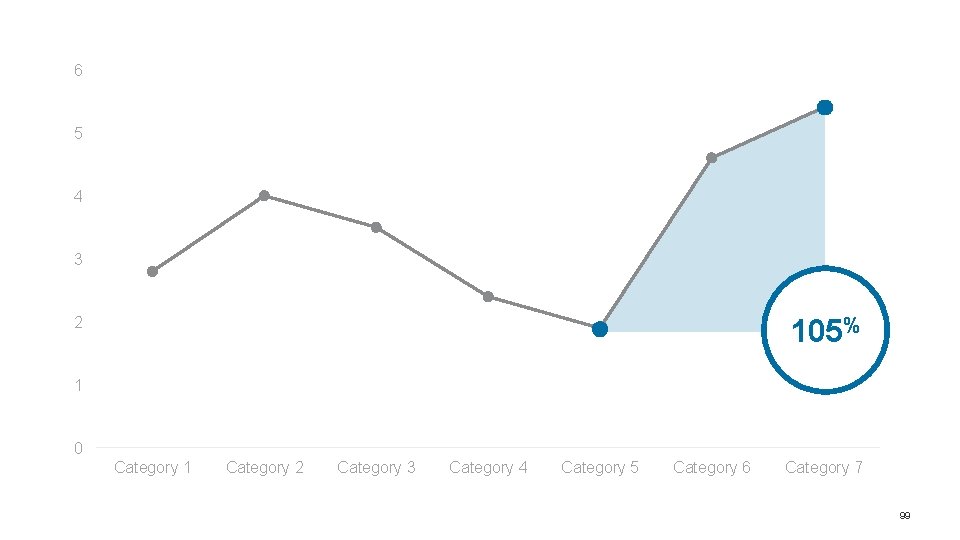
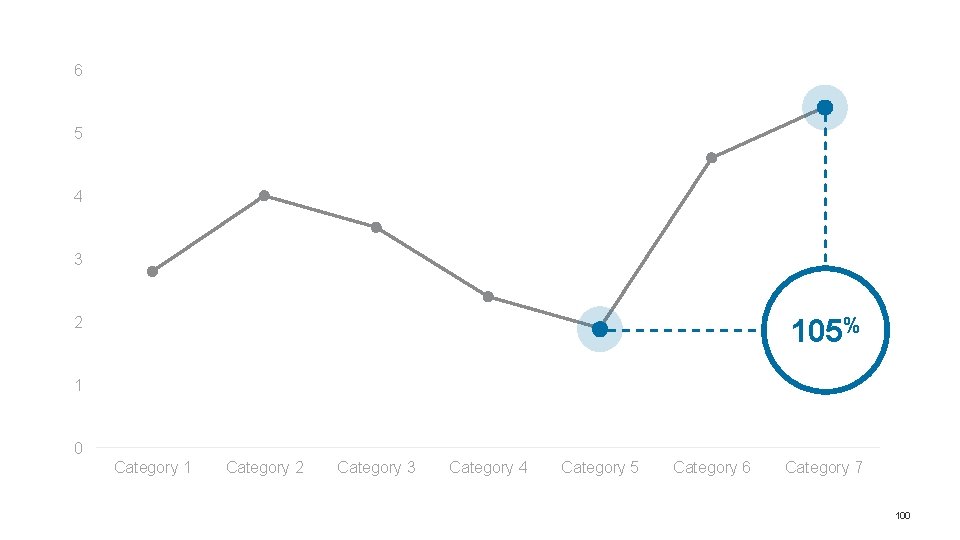
6 5 4 3 105% 2 1 0 Category 1 Category 2 Category 3 Category 4 Category 5 Category 6 Category 7 99
6 5 4 3 105% 2 1 0 Category 1 Category 2 Category 3 Category 4 Category 5 Category 6 Category 7 100
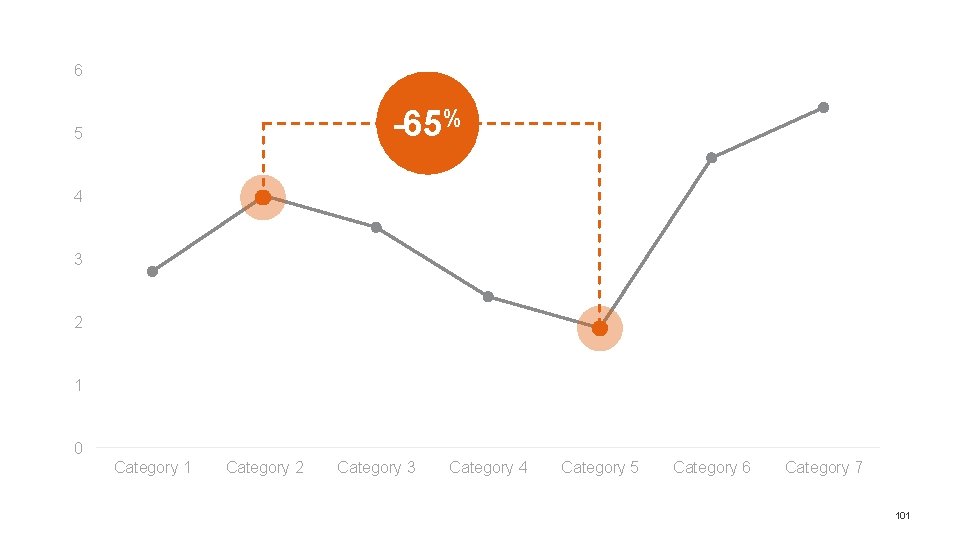
6 -65% 5 4 3 2 1 0 Category 1 Category 2 Category 3 Category 4 Category 5 Category 6 Category 7 101
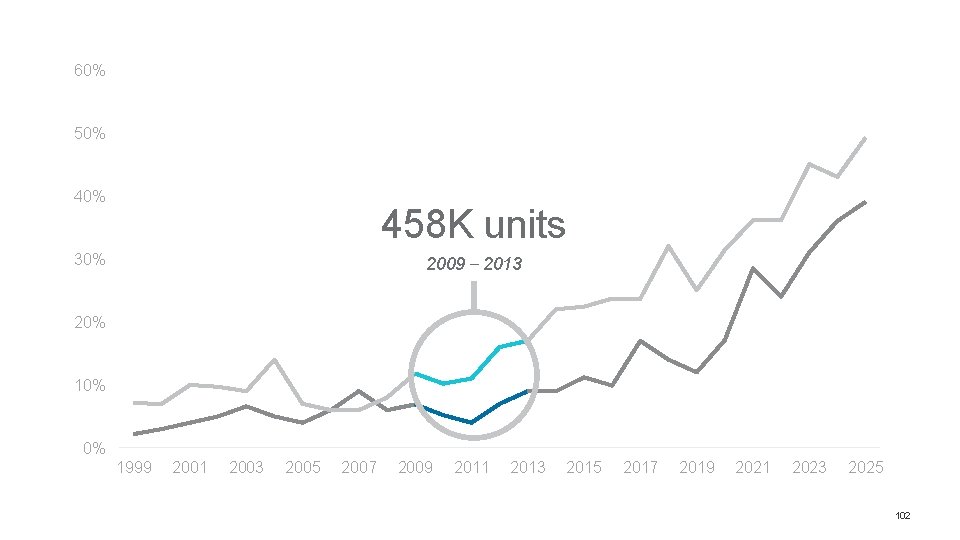
60% 50% 458 K units 30% 2009 – 2013 20% 10% 0% 1999 2001 2003 2005 2007 2009 2011 2013 2015 2017 2019 2021 2023 2025 102
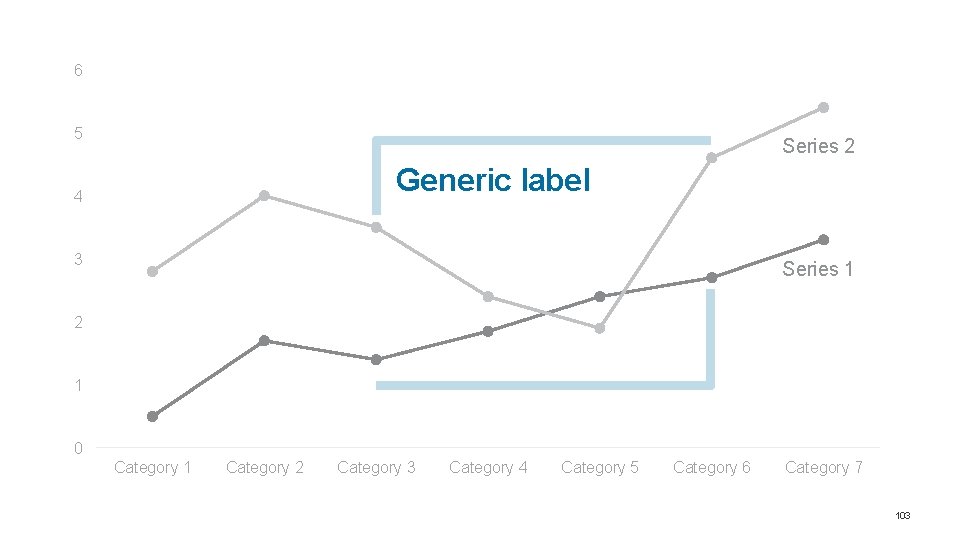
6 5 Series 2 Generic label 4 3 Series 1 2 1 0 Category 1 Category 2 Category 3 Category 4 Category 5 Category 6 Category 7 103
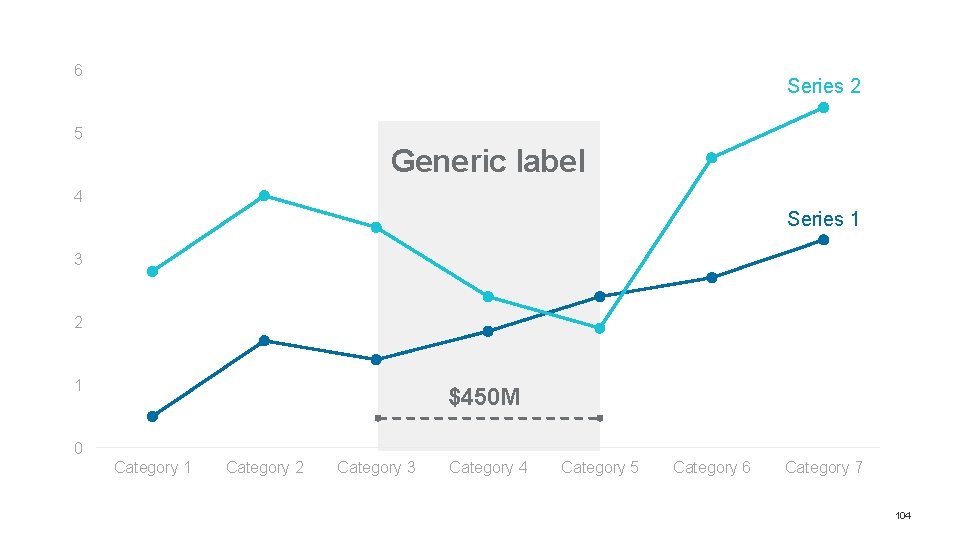
6 Series 2 5 Generic label 4 Series 1 3 2 1 $450 M 0 Category 1 Category 2 Category 3 Category 4 Category 5 Category 6 Category 7 104
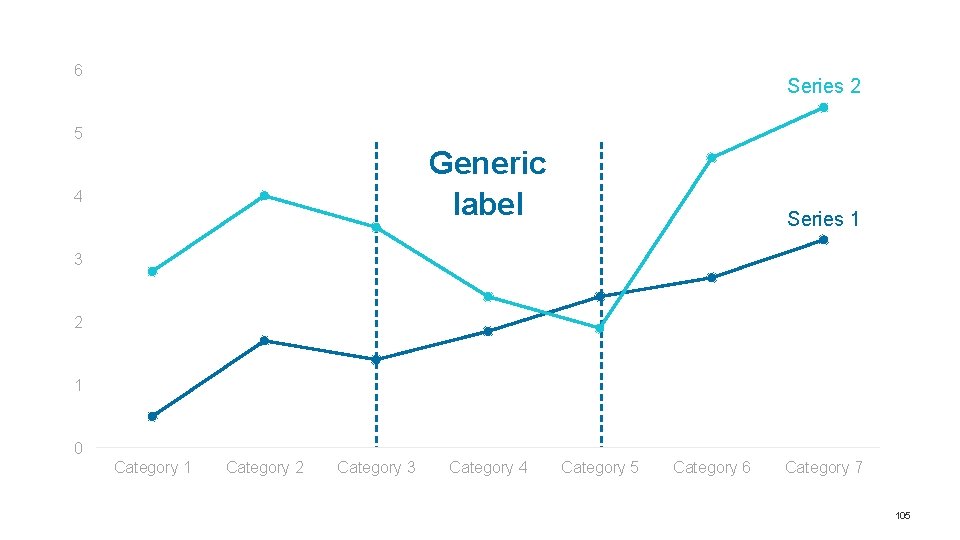
6 Series 2 5 Generic label 4 Series 1 3 2 1 0 Category 1 Category 2 Category 3 Category 4 Category 5 Category 6 Category 7 105
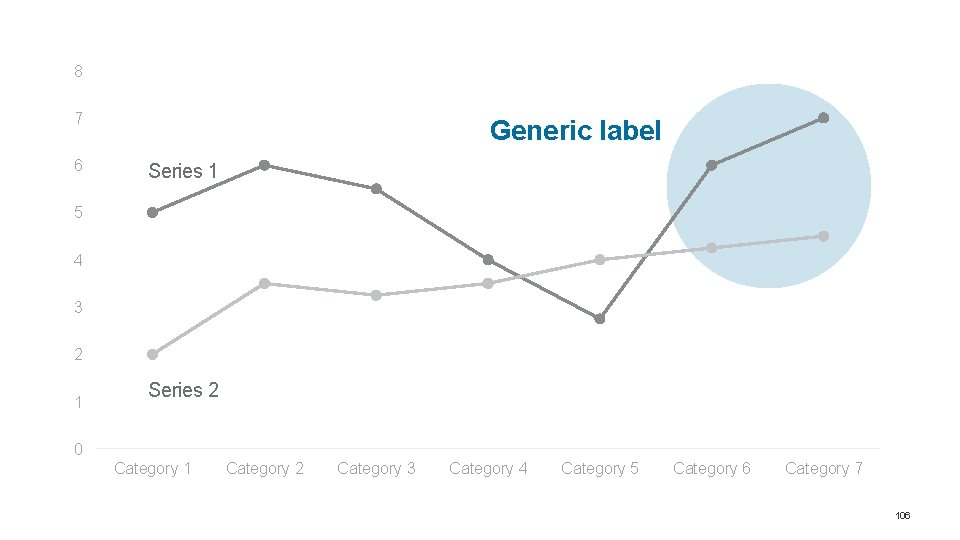
8 7 6 Generic label Series 1 5 4 3 2 1 Series 2 0 Category 1 Category 2 Category 3 Category 4 Category 5 Category 6 Category 7 106
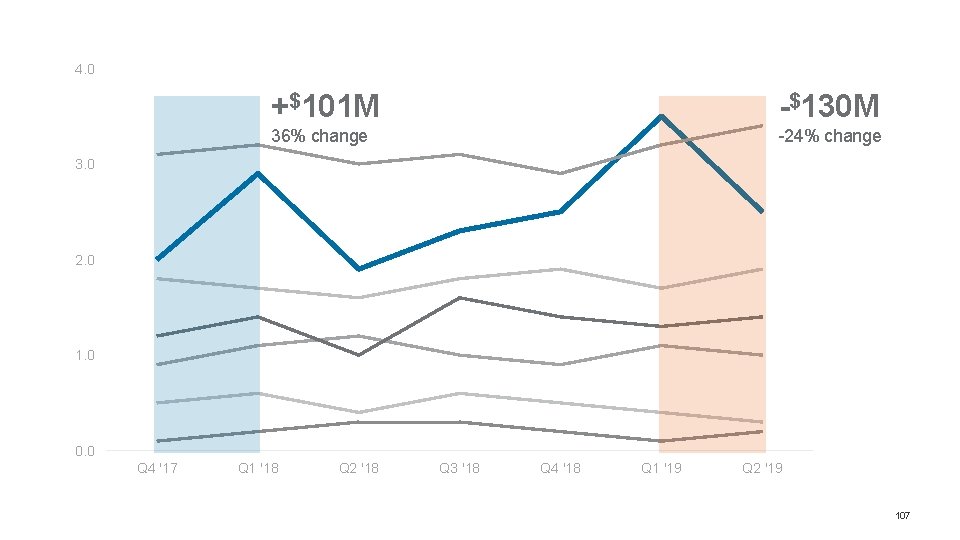
4. 0 +$101 M -$130 M 36% change -24% change 3. 0 2. 0 1. 0 0. 0 Q 4 '17 Q 1 '18 Q 2 '18 Q 3 '18 Q 4 '18 Q 1 '19 Q 2 '19 107
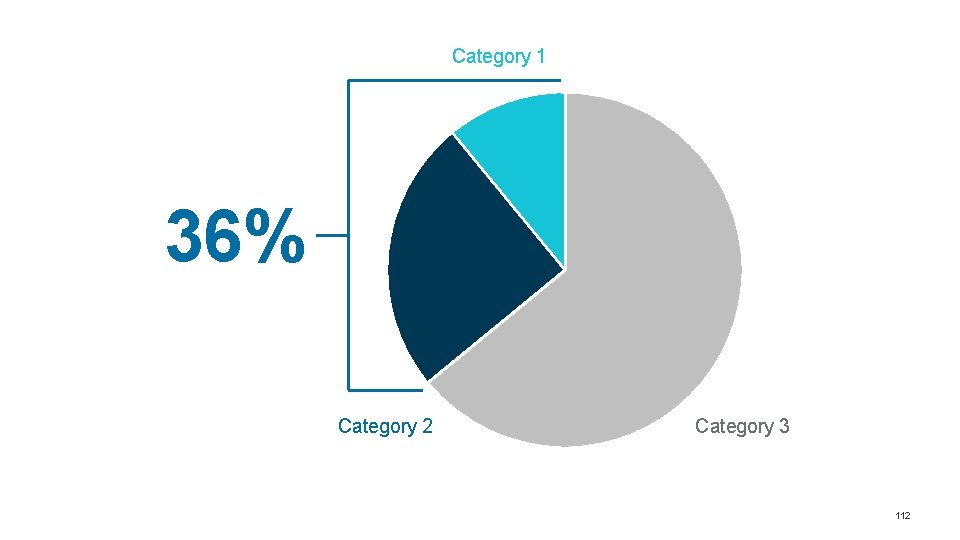
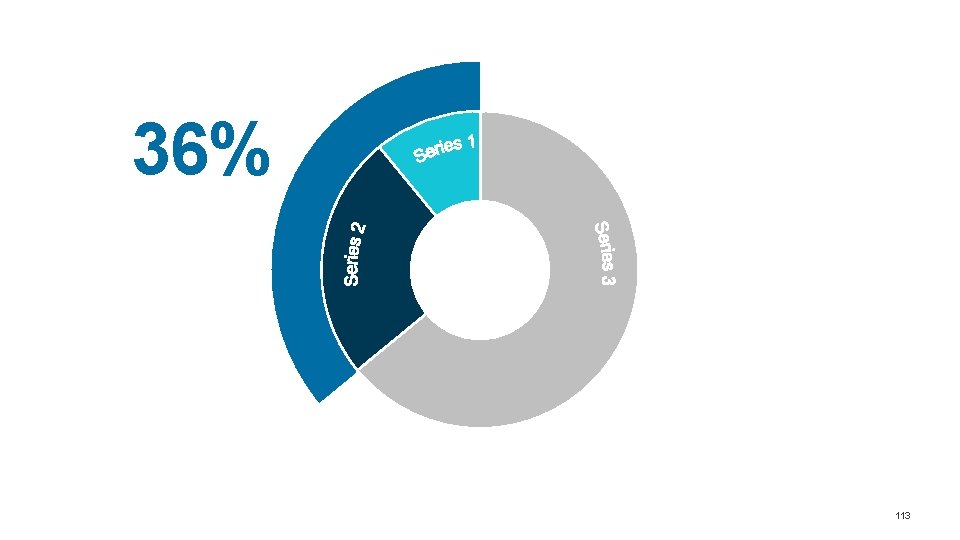
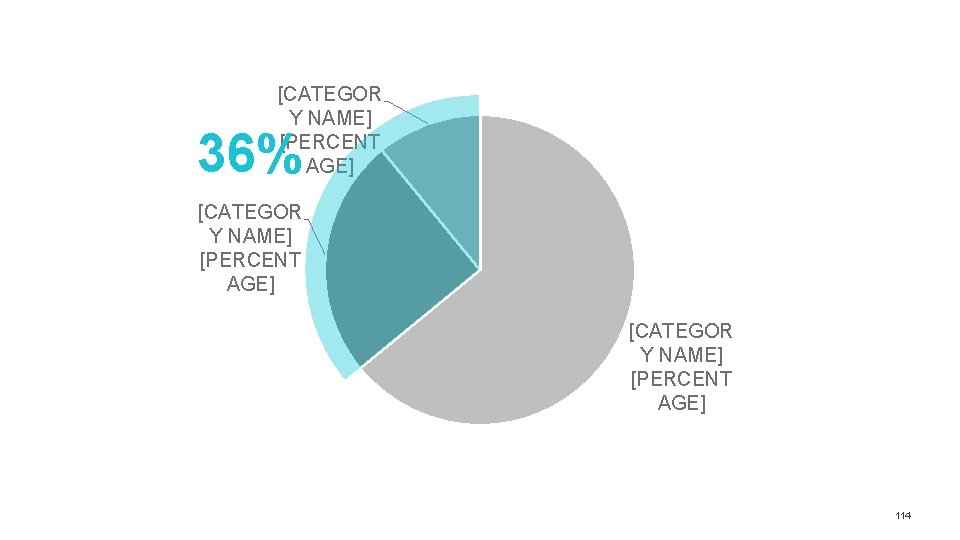
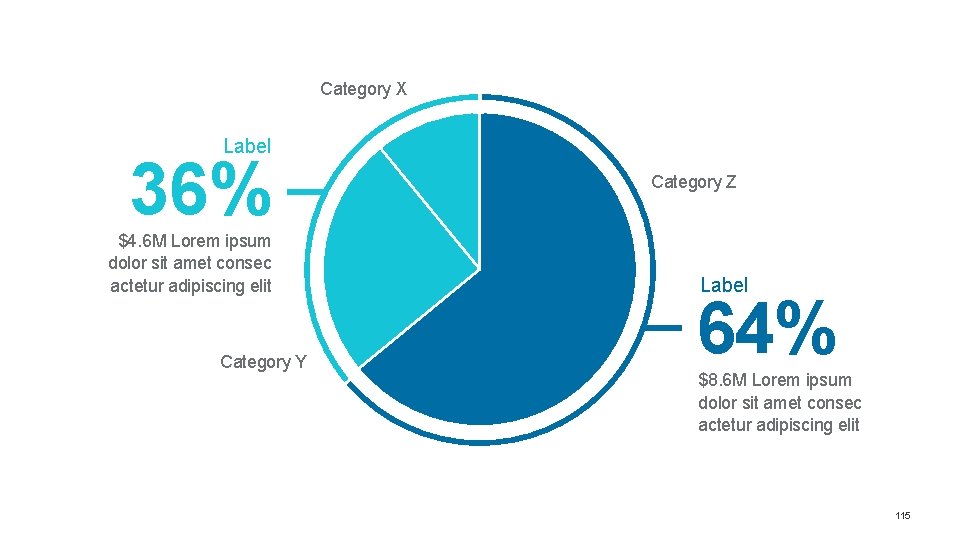
ADD MATH » BRACKET Pie & Donut 108
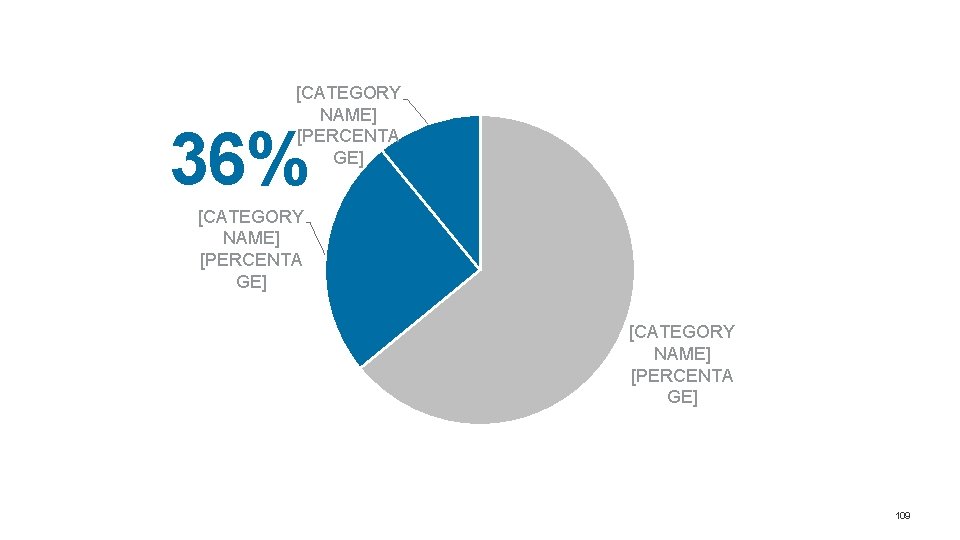
[CATEGORY NAME] [PERCENTA GE] 36% [CATEGORY NAME] [PERCENTA GE] 109
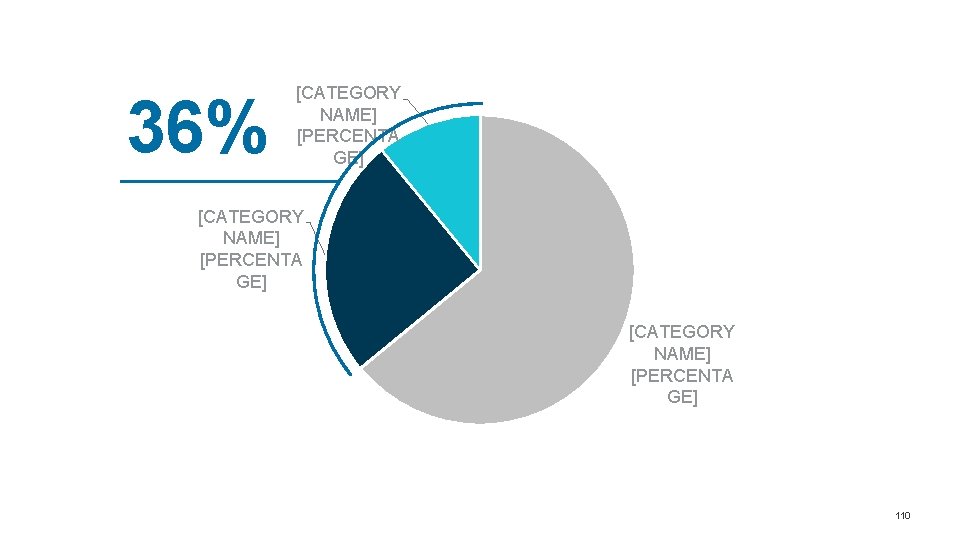
36% [CATEGORY NAME] [PERCENTA GE] 110
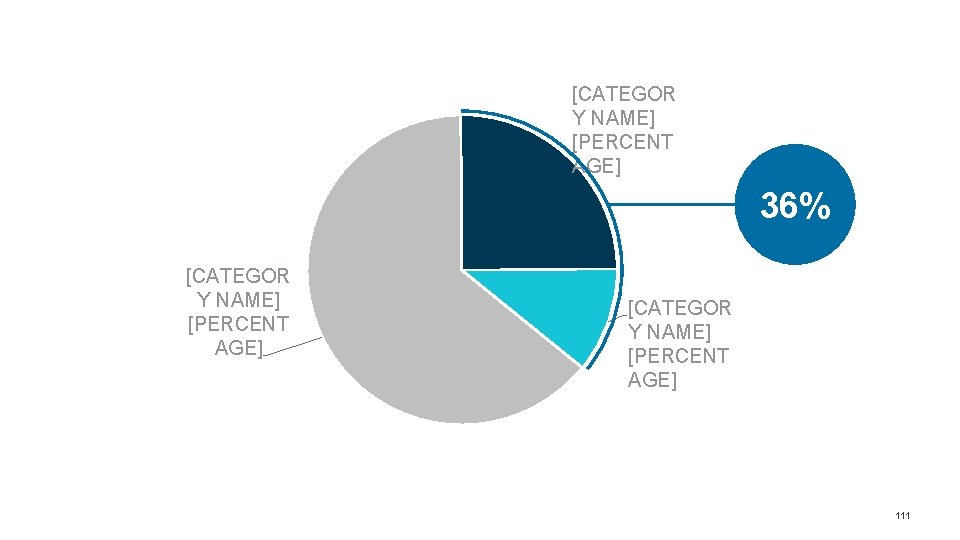
[CATEGOR Y NAME] [PERCENT AGE] 36% [CATEGOR Y NAME] [PERCENT AGE] 111
Category 1 36% Category 2 Category 3 112
36% 113
[CATEGOR Y NAME] [PERCENT AGE] 36% [CATEGOR Y NAME] [PERCENT AGE] 114
Category X Label 36% $4. 6 M Lorem ipsum dolor sit amet consec actetur adipiscing elit Category Y Category Z Label 64% $8. 6 M Lorem ipsum dolor sit amet consec actetur adipiscing elit 115
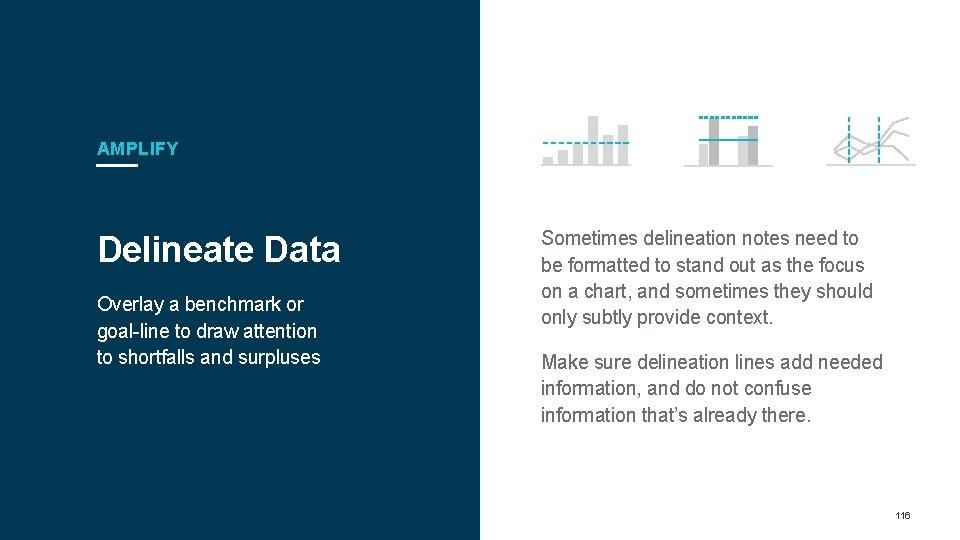
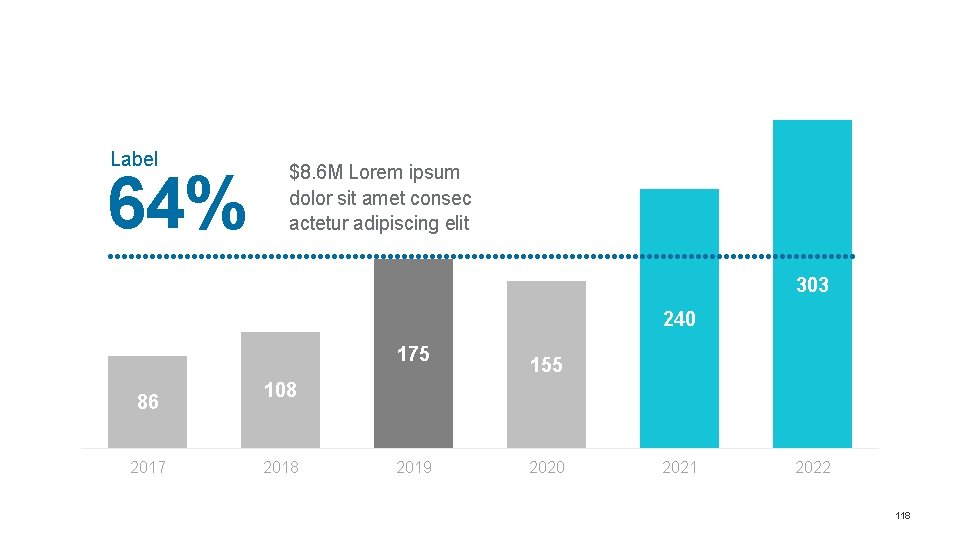
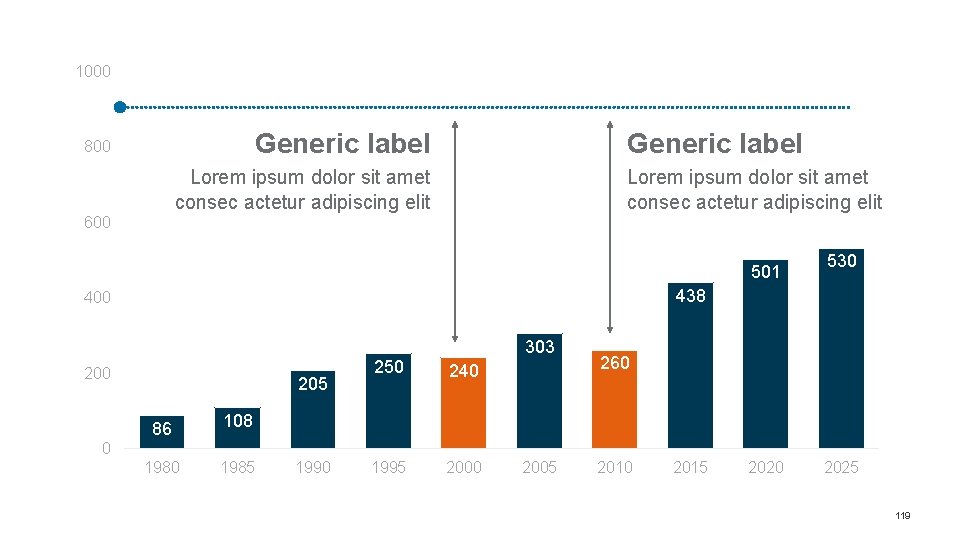
AMPLIFY Delineate Data Overlay a benchmark or goal-line to draw attention to shortfalls and surpluses Sometimes delineation notes need to be formatted to stand out as the focus on a chart, and sometimes they should only subtly provide context. Make sure delineation lines add needed information, and do not confuse information that’s already there. 116
ADD MATH » DELINEATE Column, Bar & Stack 117
Label 64% $8. 6 M Lorem ipsum dolor sit amet consec actetur adipiscing elit 303 240 175 86 2017 155 108 2019 2020 2021 2022 118
1000 Generic label 800 Generic label Lorem ipsum dolor sit amet consec actetur adipiscing elit 600 Lorem ipsum dolor sit amet consec actetur adipiscing elit 501 530 438 400 205 86 303 250 240 1995 2000 260 108 0 1985 1990 2005 2010 2015 2020 2025 119
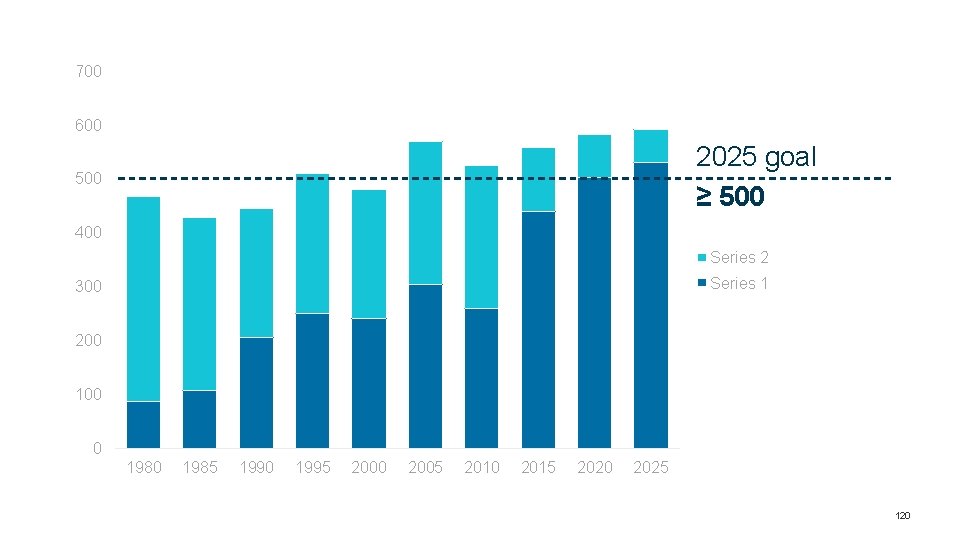
700 600 2025 goal ≥ 500 400 Series 2 Series 1 300 200 100 0 1985 1990 1995 2000 2005 2010 2015 2020 2025 120
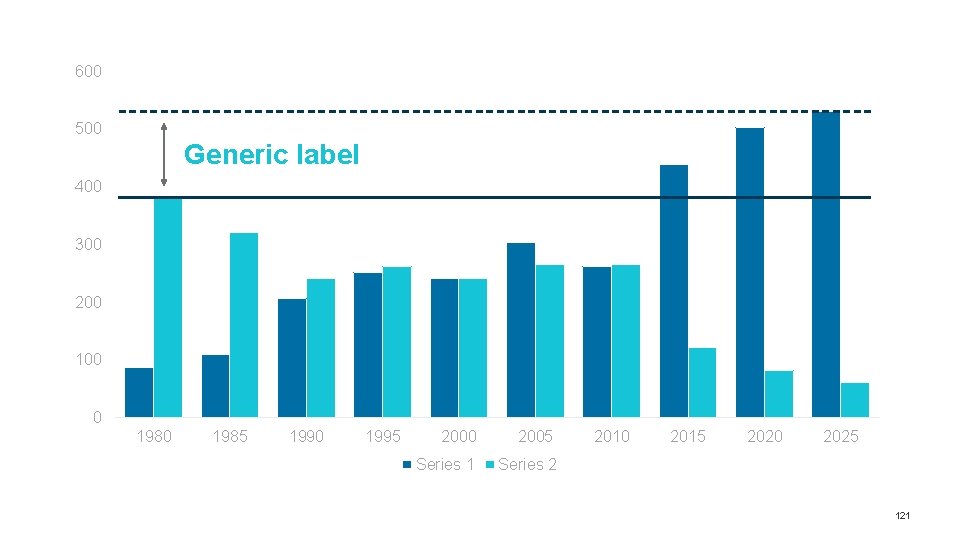
600 500 Generic label 400 300 200 100 0 1985 1990 1995 2000 2005 Series 1 Series 2 2010 2015 2020 2025 121
ADD MATH » DELINEATE Line 122
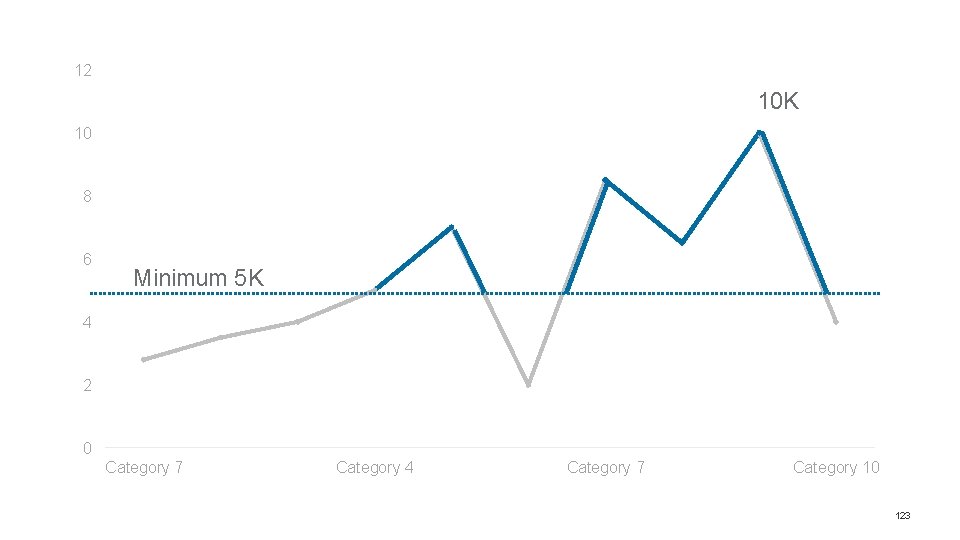
12 10 K 10 8 6 Minimum 5 K 4 2 0 Category 7 Category 4 Category 7 Category 10 123
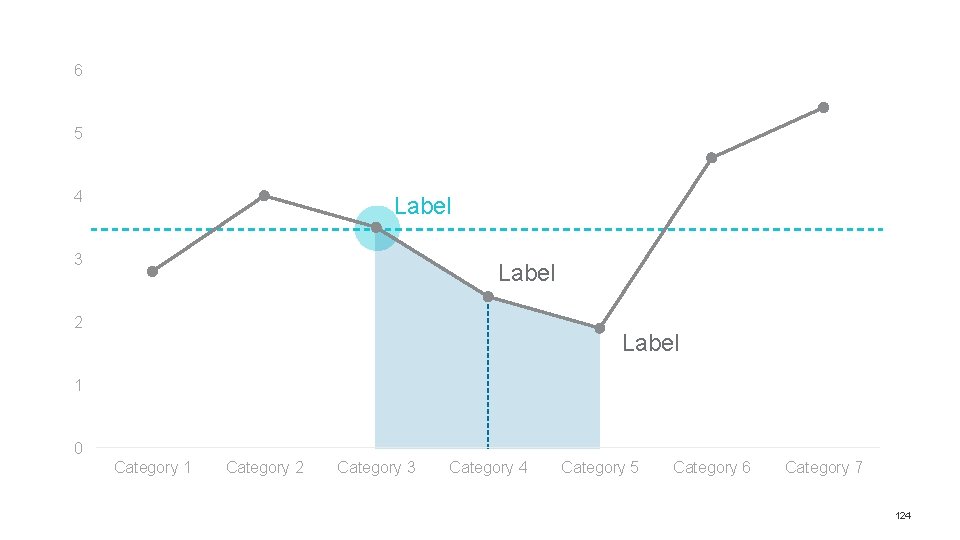
6 5 4 Label 3 Label 2 Label 1 0 Category 1 Category 2 Category 3 Category 4 Category 5 Category 6 Category 7 124
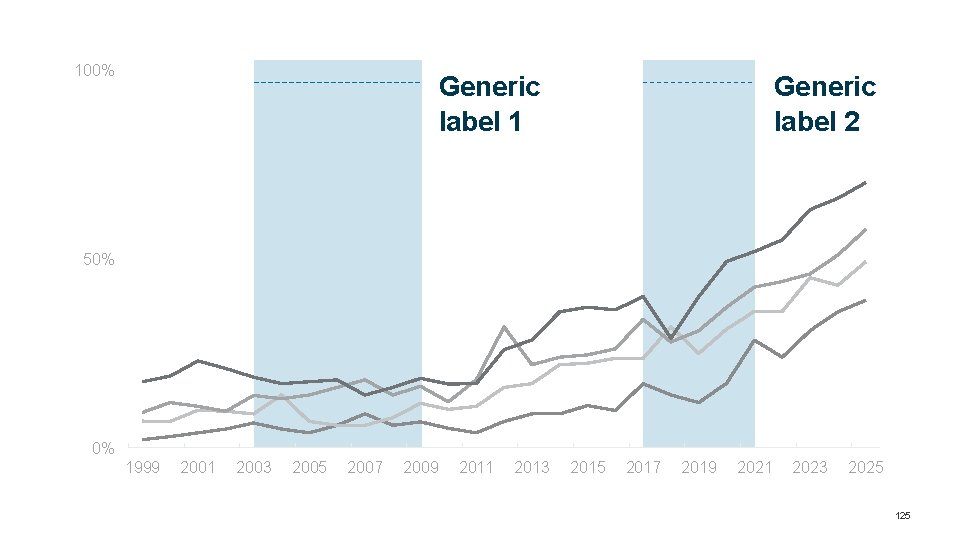
100% Generic label 1 Generic label 2 50% 0% 1999 2001 2003 2005 2007 2009 2011 2013 2015 2017 2019 2021 2023 2025 125
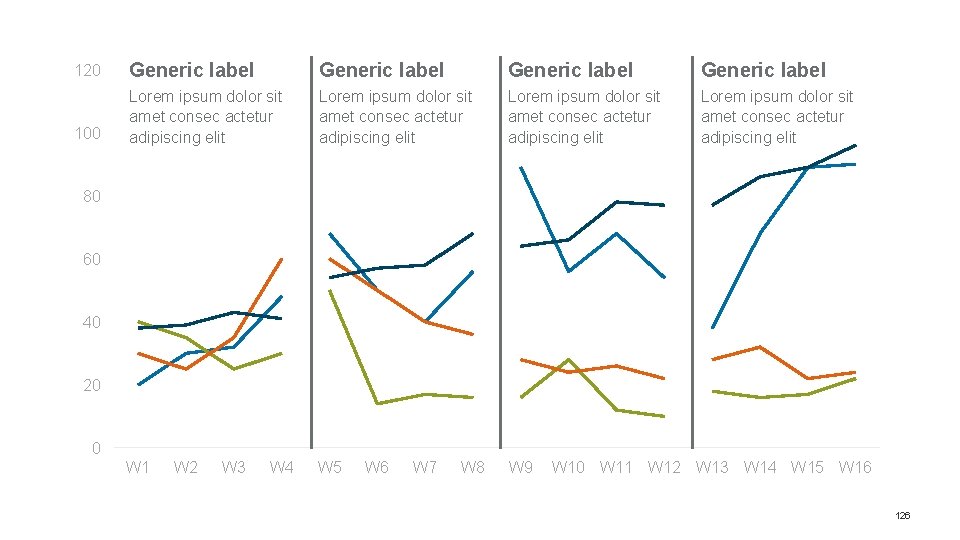
120 Generic label 100 Lorem ipsum dolor sit amet consec actetur adipiscing elit W 1 W 5 W 9 80 60 40 20 0 W 2 W 3 W 4 W 6 W 7 W 8 W 10 W 11 W 12 W 13 W 14 W 15 W 16 126
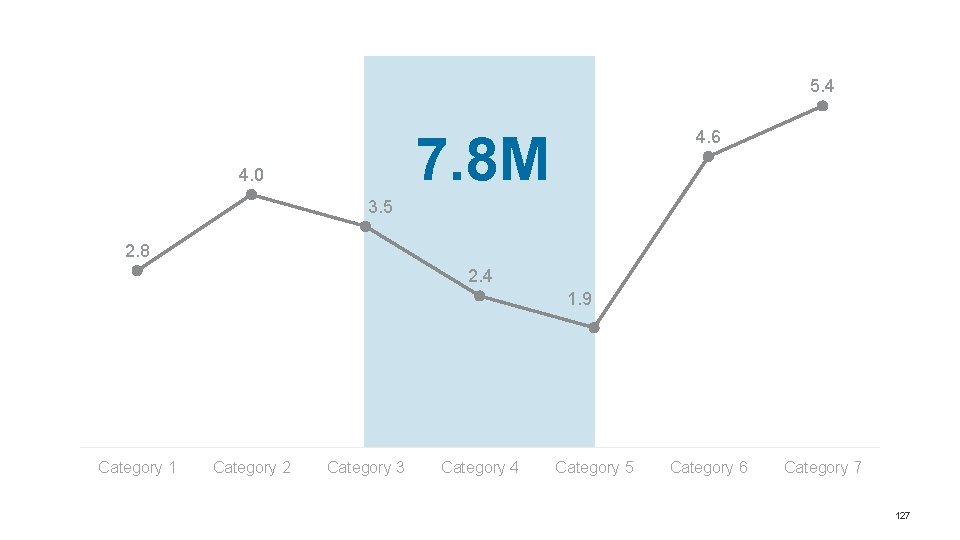
5. 4 7. 8 M 4. 0 4. 6 3. 5 2. 8 2. 4 1. 9 Category 1 Category 2 Category 3 Category 4 Category 5 Category 6 Category 7 127
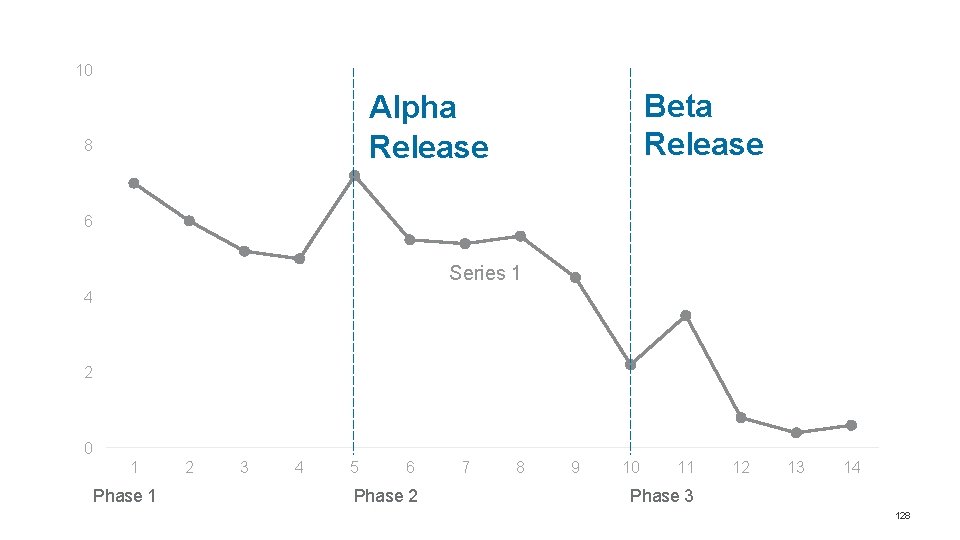
10 Beta Release Alpha Release 8 6 Series 1 4 2 0 1 Phase 1 2 3 4 5 6 Phase 2 7 8 9 10 11 12 13 14 Phase 3 128
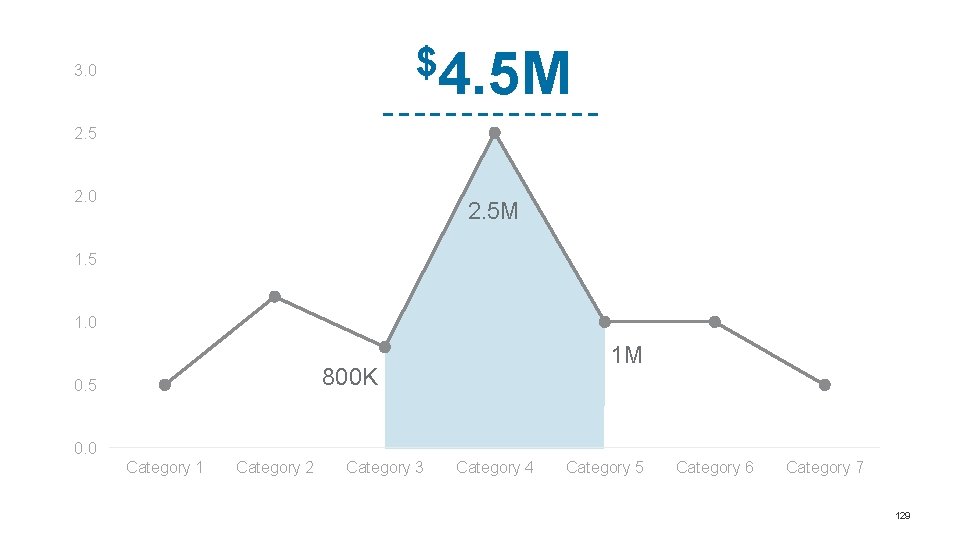
$4. 5 M 3. 0 2. 5 2. 0 2. 5 M 1. 5 1. 0 1 M 800 K 0. 5 0. 0 Category 1 Category 2 Category 3 Category 4 Category 5 Category 6 Category 7 129
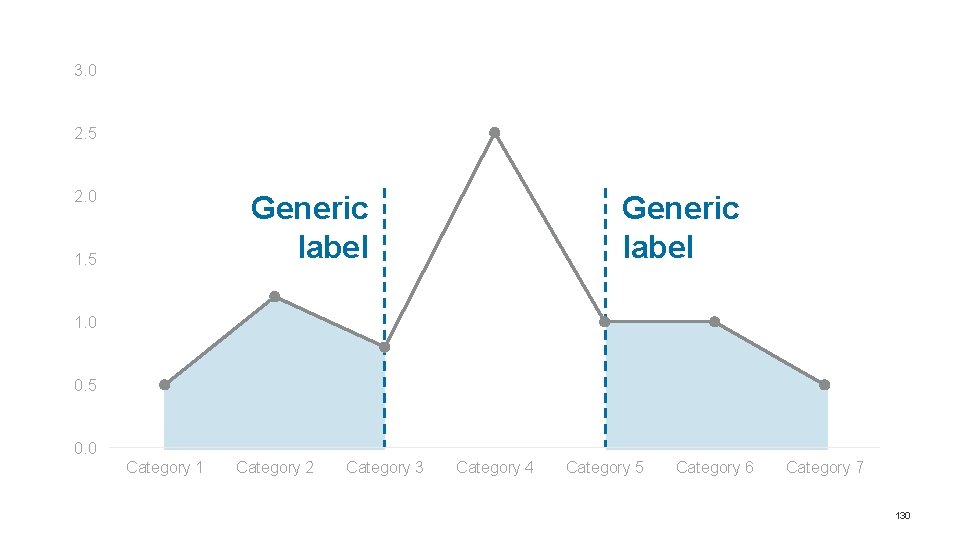
3. 0 2. 5 2. 0 Generic label 1. 5 Generic label 1. 0 0. 5 0. 0 Category 1 Category 2 Category 3 Category 4 Category 5 Category 6 Category 7 130
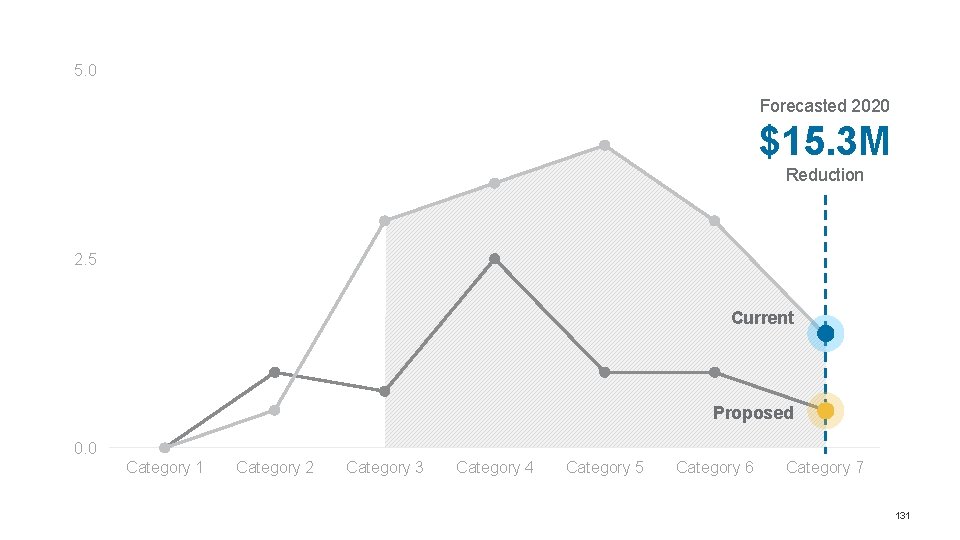
5. 0 Forecasted 2020 $15. 3 M Reduction 2. 5 Current Proposed 0. 0 Category 1 Category 2 Category 3 Category 4 Category 5 Category 6 Category 7 131
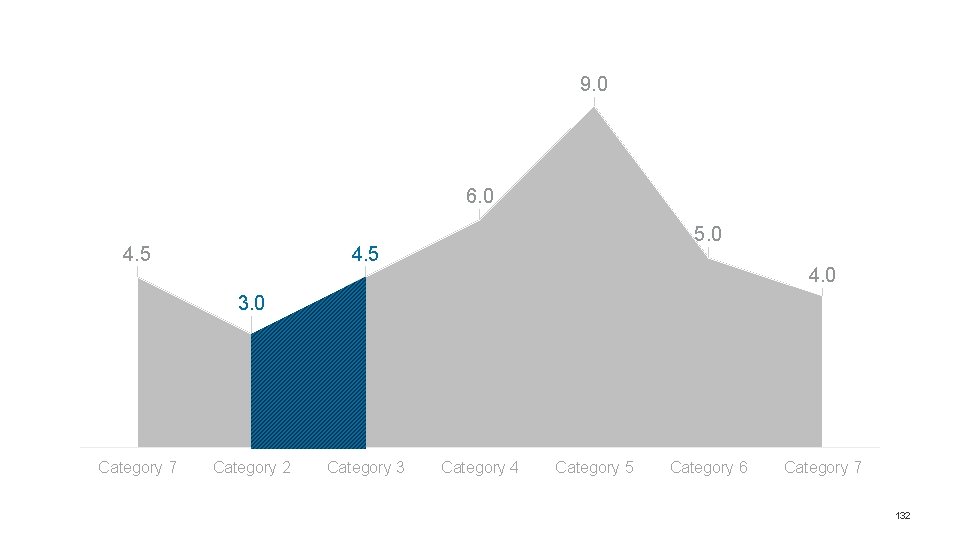
9. 0 6. 0 4. 5 5. 0 4. 5 4. 0 3. 0 Category 7 Category 2 Category 3 Category 4 Category 5 Category 6 Category 7 132
ADD MATH » DELINEATE Pie & Donut 133
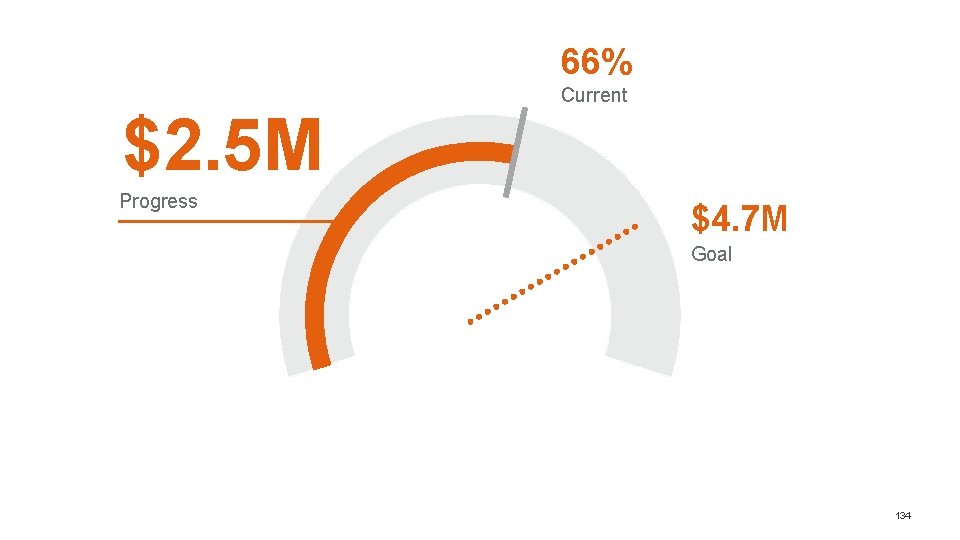
66% $2. 5 M Progress Current $4. 7 M Goal 134
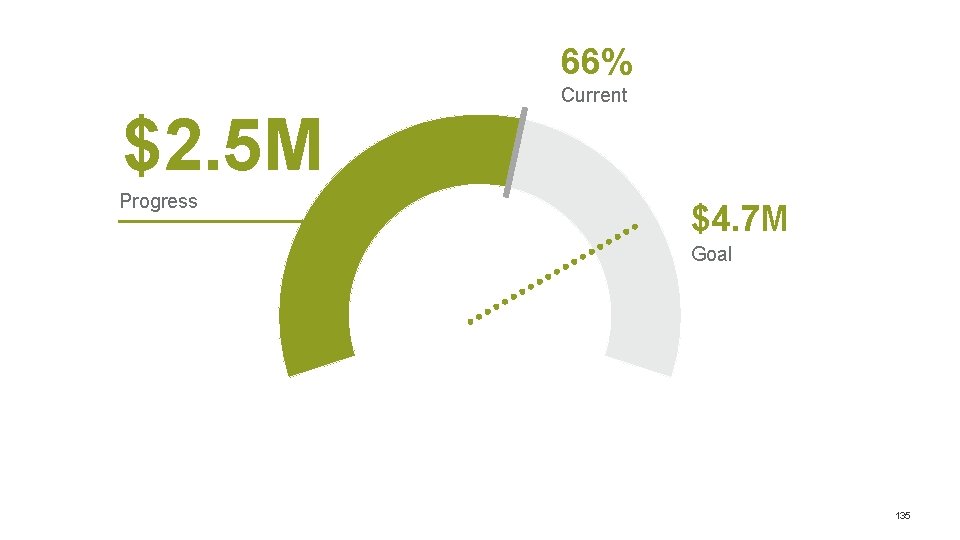
66% $2. 5 M Progress Current $4. 7 M Goal 135
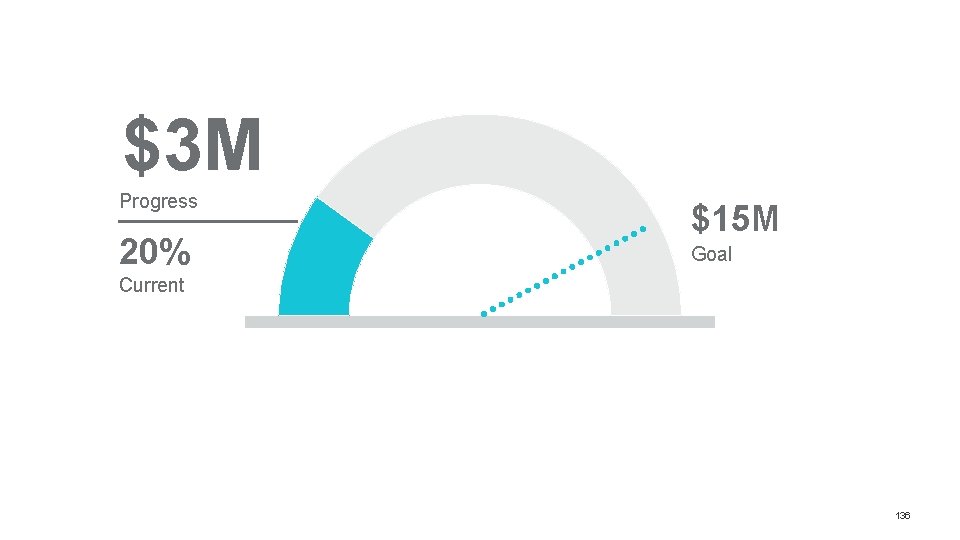
$3 M Progress 20% $15 M Goal Current 136
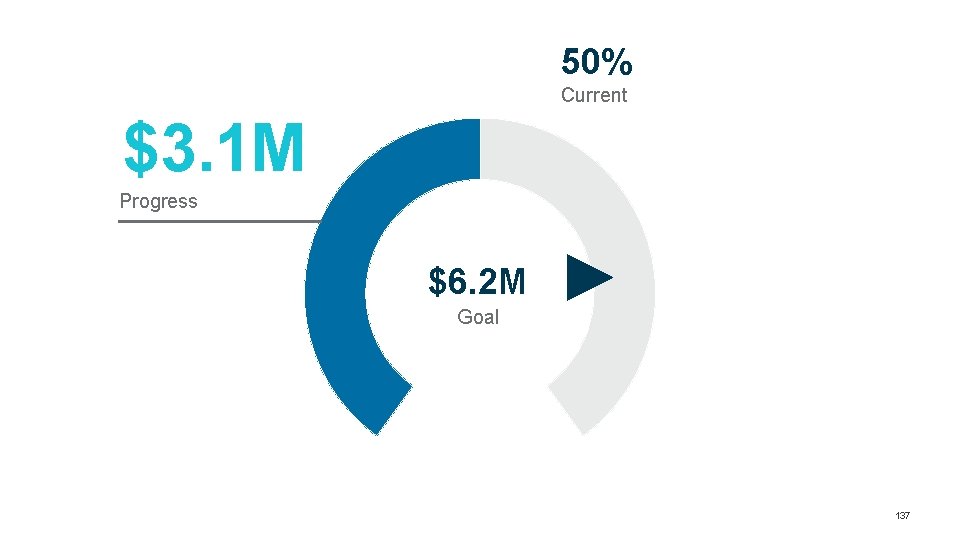
50% Current $3. 1 M Progress $6. 2 M Goal 137
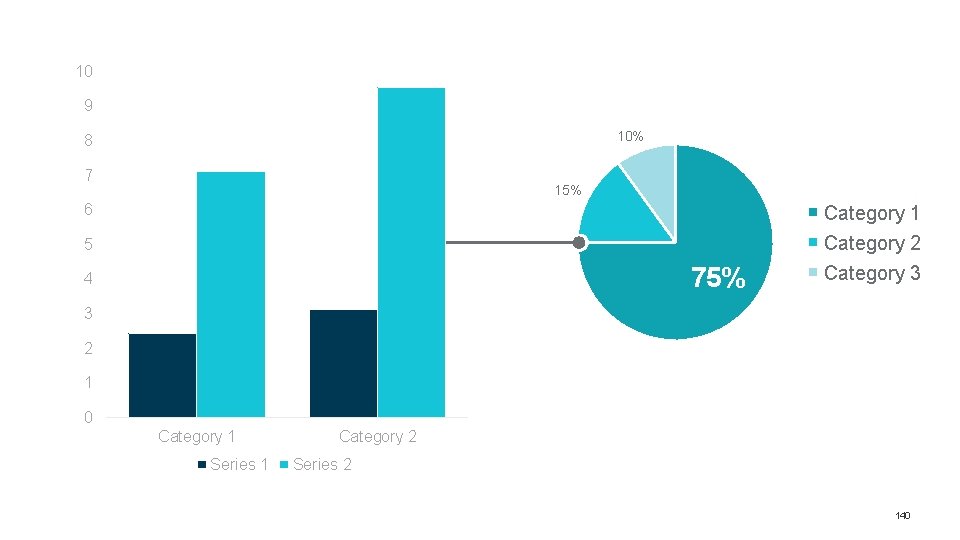
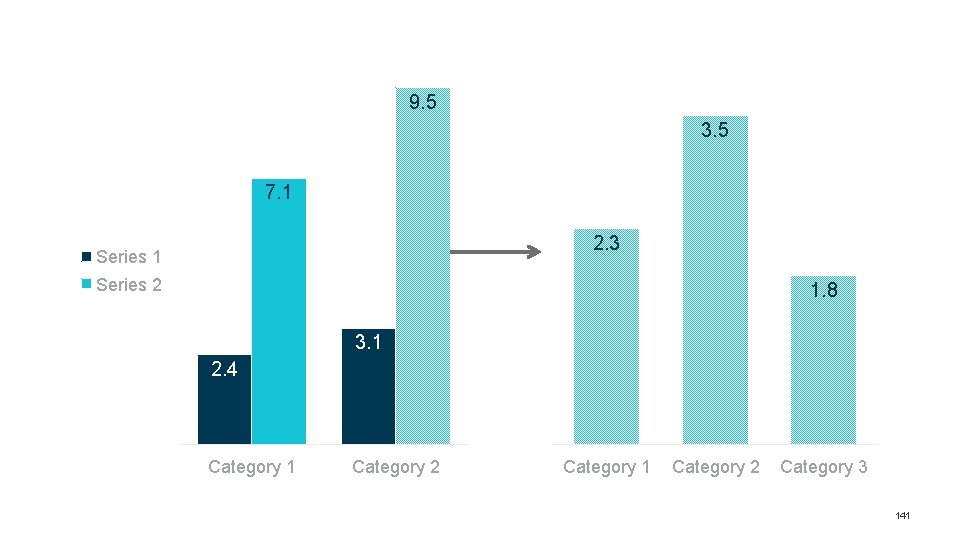
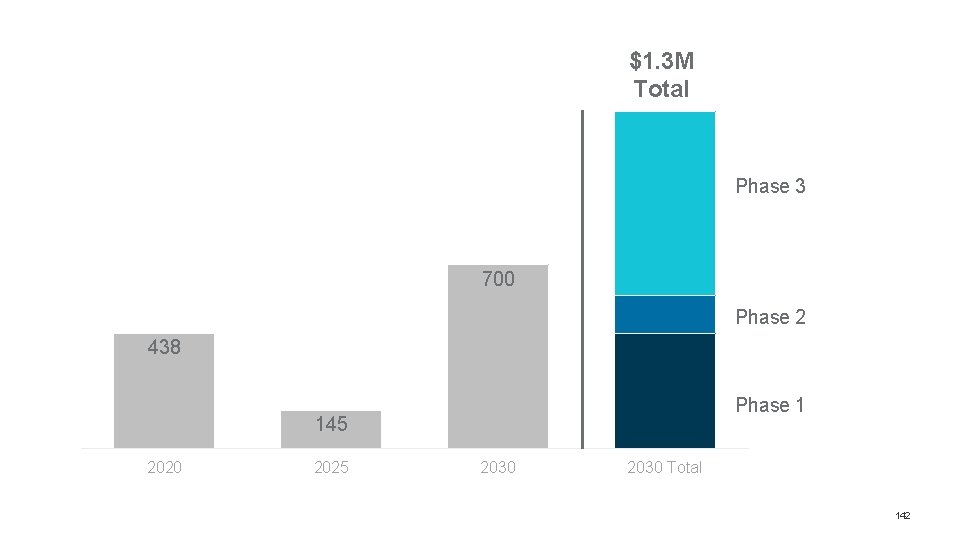
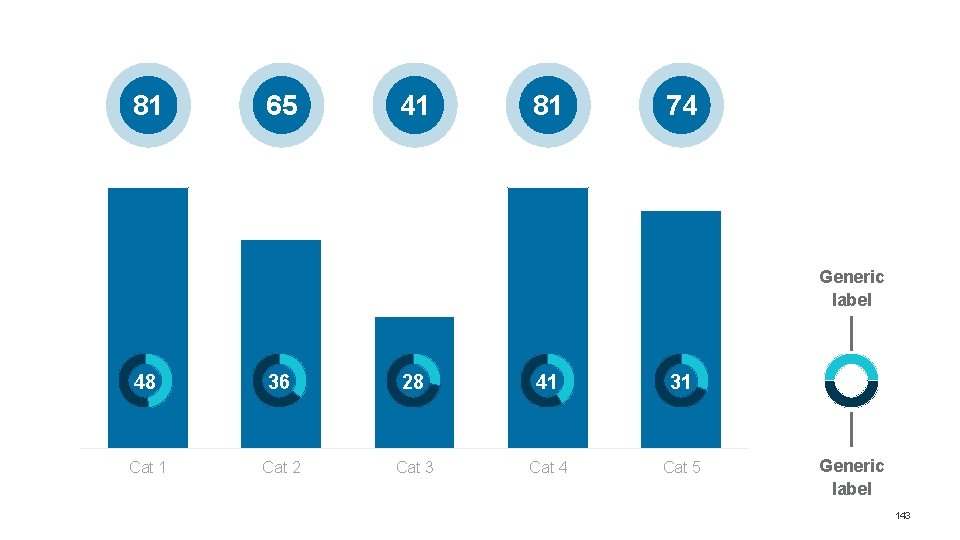
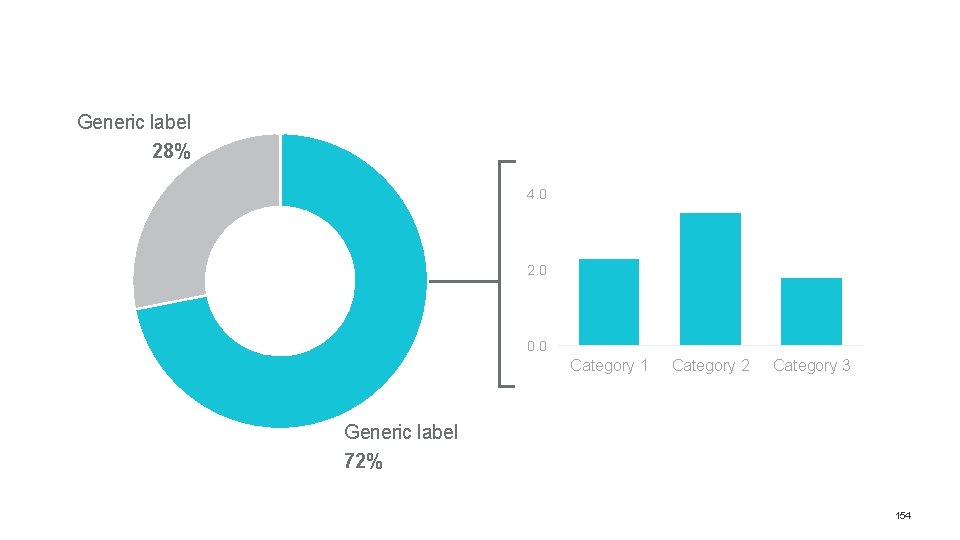
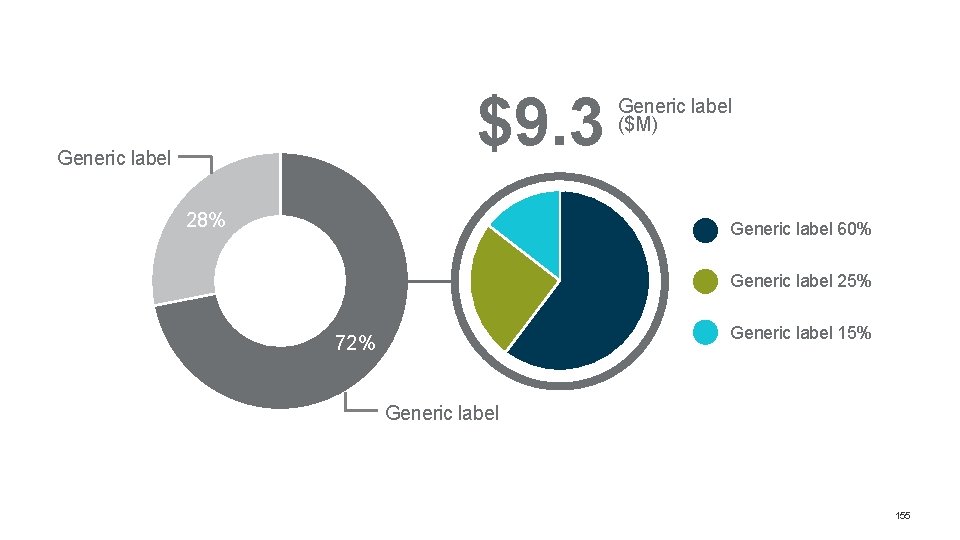
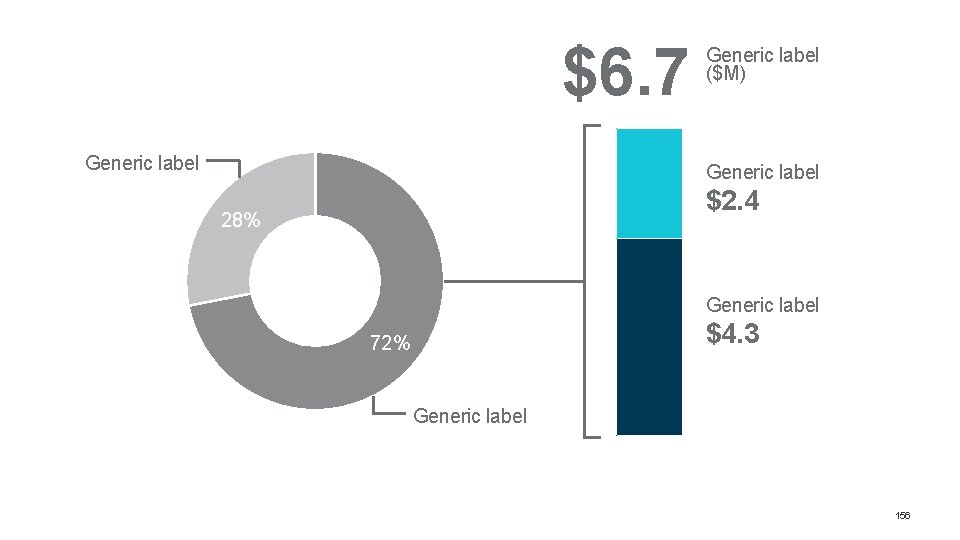
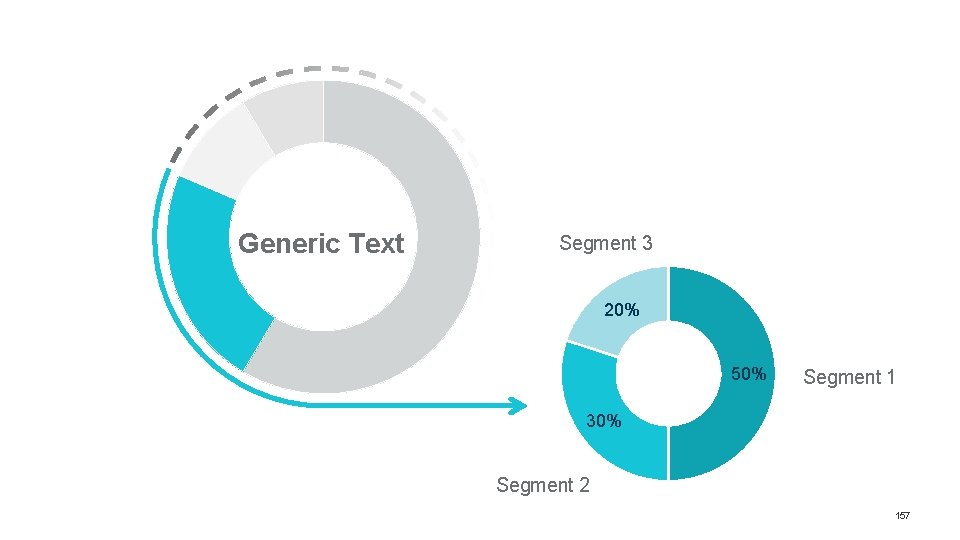
ADD MATH Explode Data Break out deeper segmentation within a larger category Secondary charts that appear to “explode” from a primary chart can be useful for providing dimension in data narrative. Make sure there is enough space for the second chart to be clearly marked, as needed. 138
ADD MATH » EXPLODE Column, Bar & Stack 139
10 9 10% 8 7 15% 6 5 75% 4 Category 1 Category 2 Category 3 3 2 1 0 Category 1 Series 1 Category 2 Series 2 140
9. 5 3. 5 7. 1 2. 3 Series 1 Series 2 1. 8 3. 1 2. 4 Category 1 Category 2 Category 3 141
$1. 3 M Total Phase 3 700 Phase 2 438 Phase 1 145 2020 2025 2030 Total 142
81 65 41 81 74 Generic label 48 36 28 41 31 Cat 2 Cat 3 Cat 4 Cat 5 Generic label 143
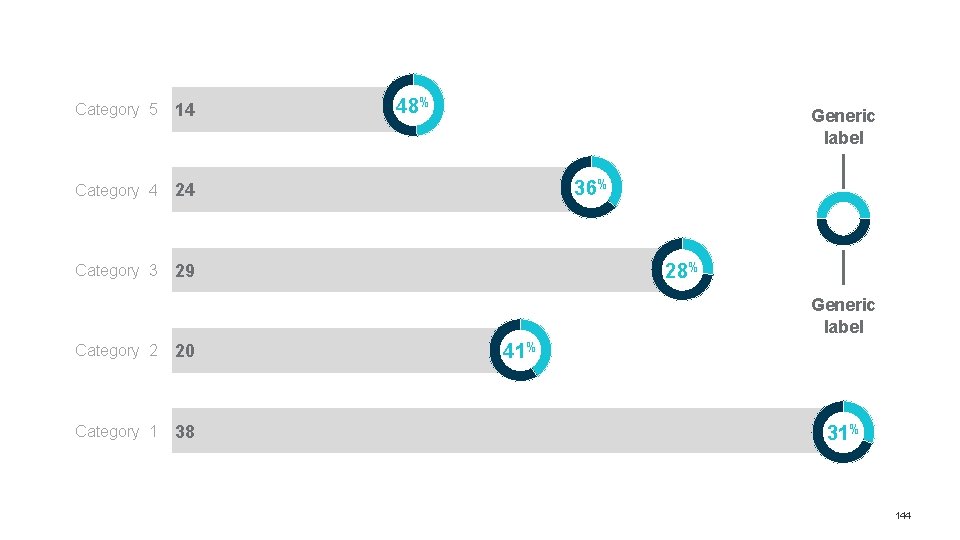
Category 5 14 Category 4 24 Category 3 29 48% Generic label 36% 28% Generic label Category 2 20 Category 1 38 41% 31% 144
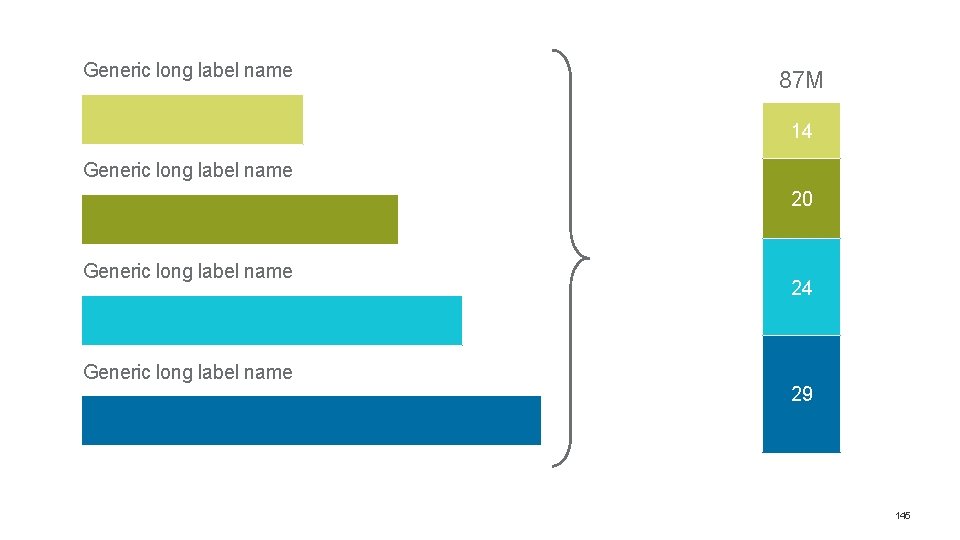
Generic long label name 87 M 14 Generic long label name 20 Generic long label name 24 Generic long label name 29 145
ADD MATH » EXPLODE Line 146
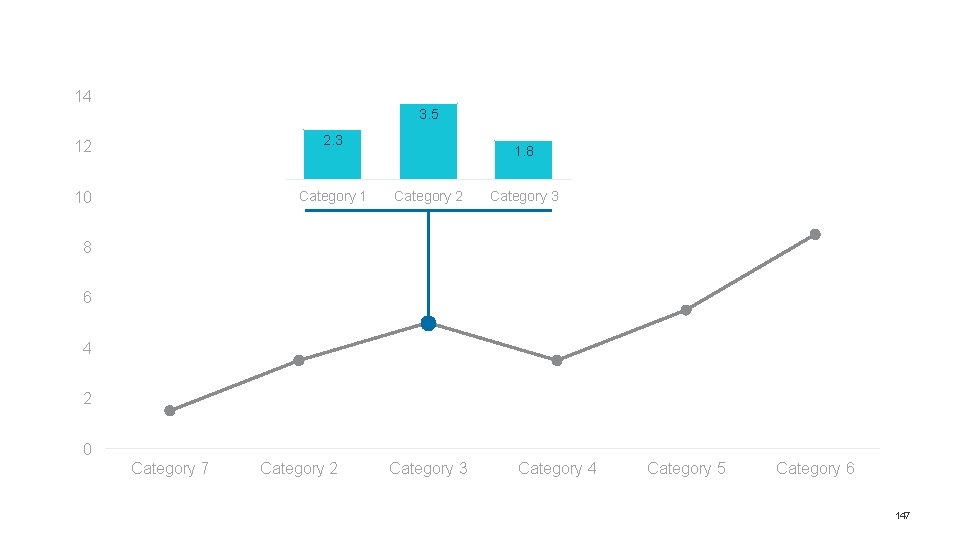
14 3. 5 12 2. 3 10 Category 1 1. 8 Category 2 Category 3 8 6 4 2 0 Category 7 Category 2 Category 3 Category 4 Category 5 Category 6 147
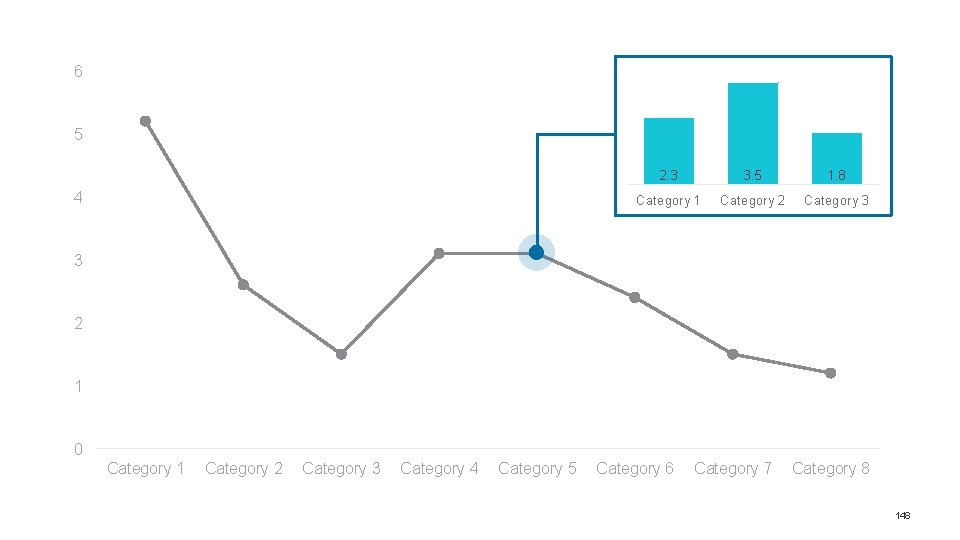
6 5 4 2. 3 3. 5 1. 8 Category 1 Category 2 Category 3 3 2 1 0 Category 1 Category 2 Category 3 Category 4 Category 5 Category 6 Category 7 Category 8 148
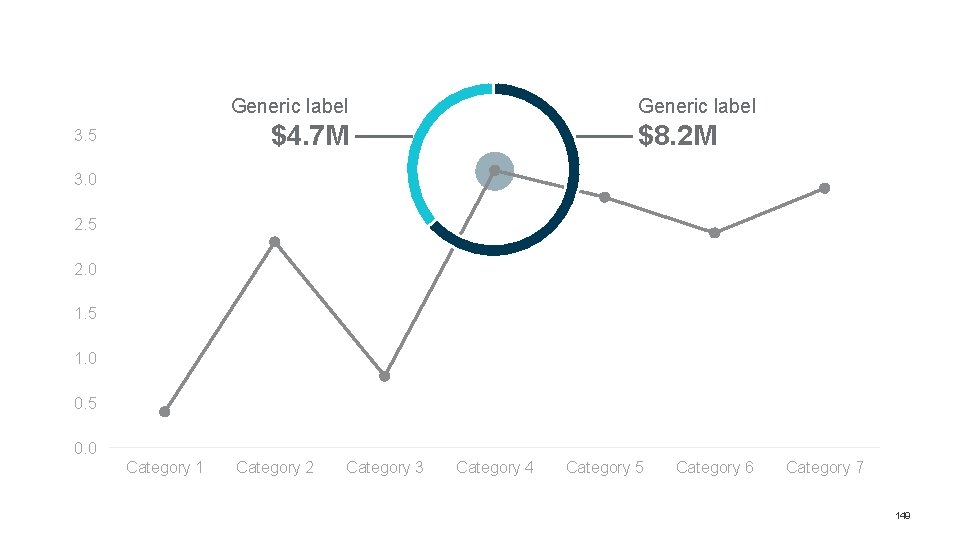
Generic label $4. 7 M 3. 5 $8. 2 M 3. 0 2. 5 2. 0 1. 5 1. 0 0. 5 0. 0 Category 1 Category 2 Category 3 Category 4 Category 5 Category 6 Category 7 149
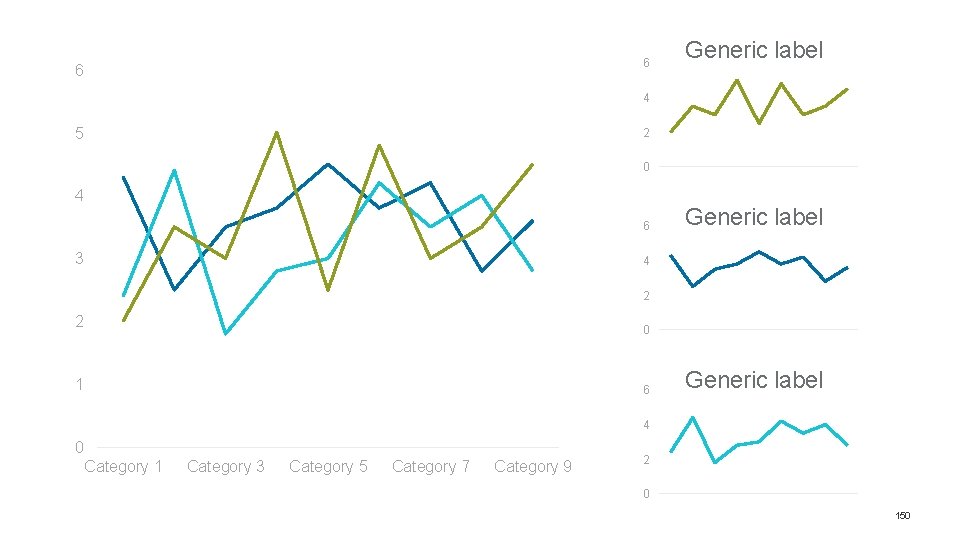
6 6 Generic label 4 5 2 0 4 6 3 Generic label 4 2 2 0 1 6 Generic label 4 0 Category 1 Category 3 Category 5 Category 7 Category 9 2 0 150
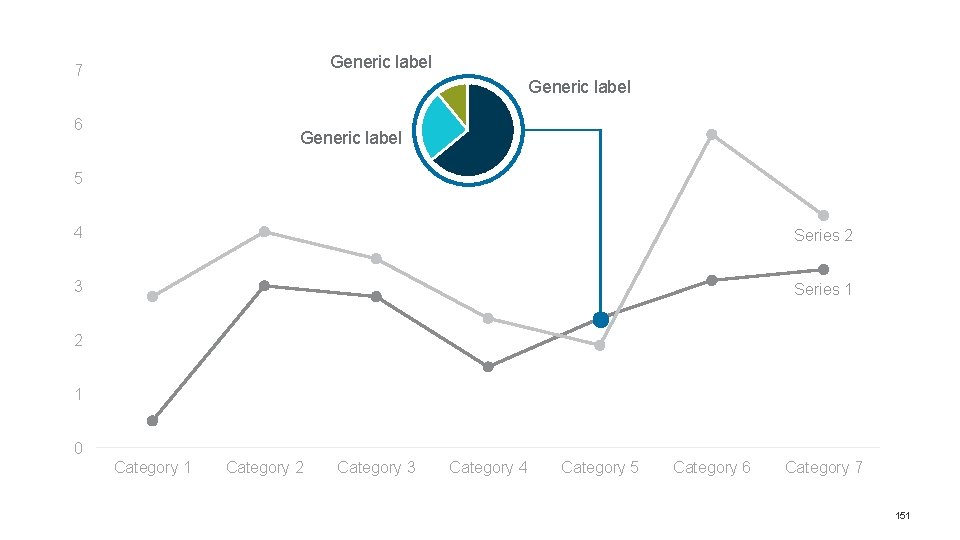
Generic label 7 Generic label 6 Generic label 5 4 Series 2 3 Series 1 2 1 0 Category 1 Category 2 Category 3 Category 4 Category 5 Category 6 Category 7 151
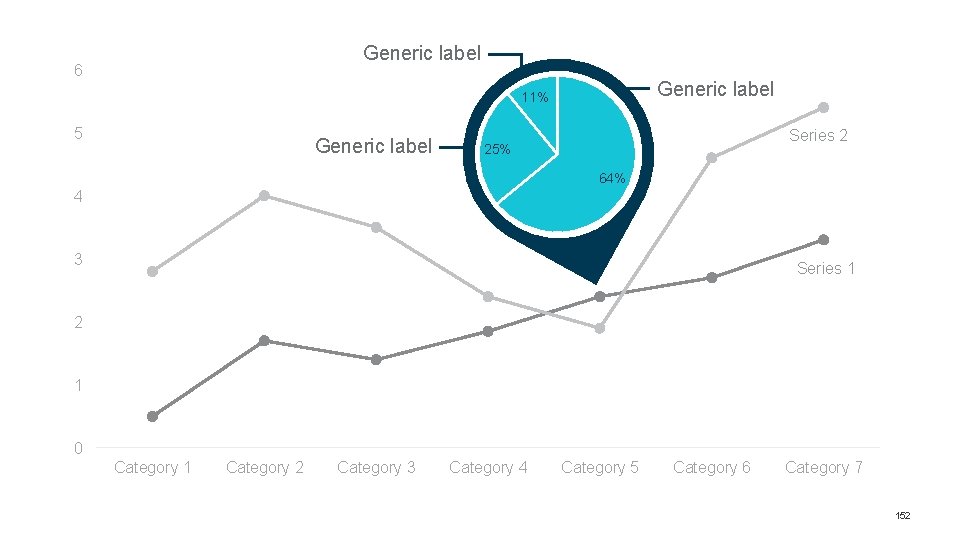
Generic label 6 Generic label 11% 5 Generic label Series 2 25% 64% 4 3 Series 1 2 1 0 Category 1 Category 2 Category 3 Category 4 Category 5 Category 6 Category 7 152
ADD MATH » EXPLODE Pie & Donut 153
Generic label 28% 4. 0 2. 0 0. 0 Category 1 Category 2 Category 3 Generic label 72% 154
$9. 3 Generic label 28% Generic label ($M) Generic label 60% Generic label 25% Generic label 15% 72% Generic label 155
$6. 7 Generic label ($M) Generic label $2. 4 28% Generic label $4. 3 72% Generic label 156
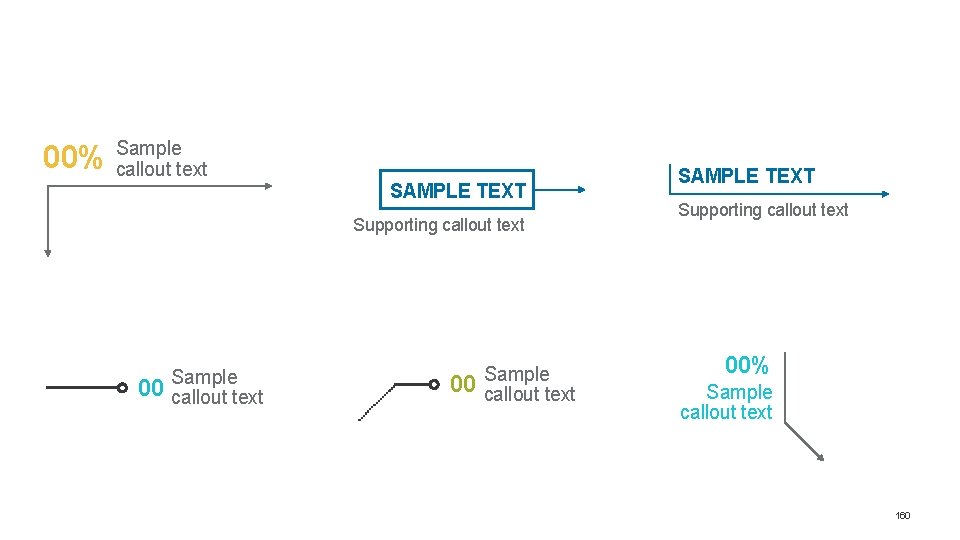
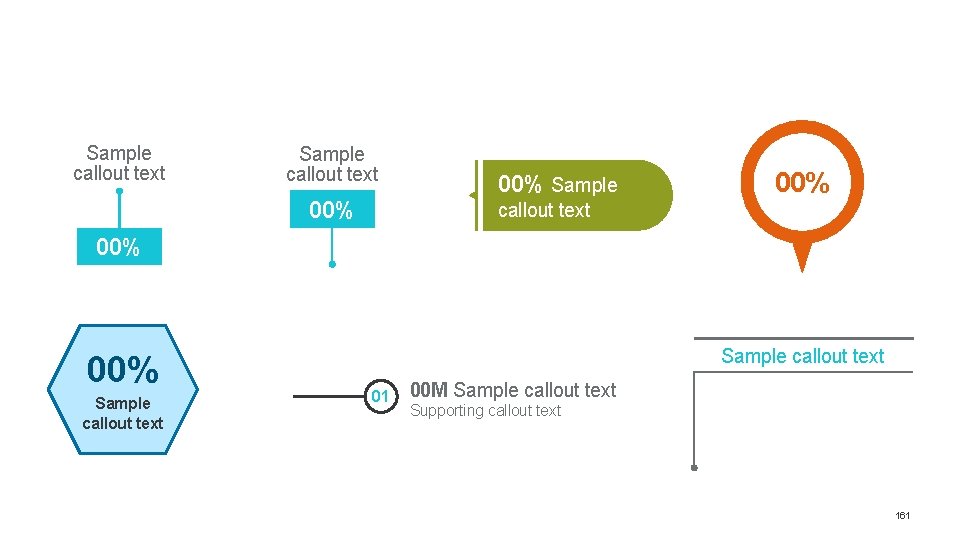
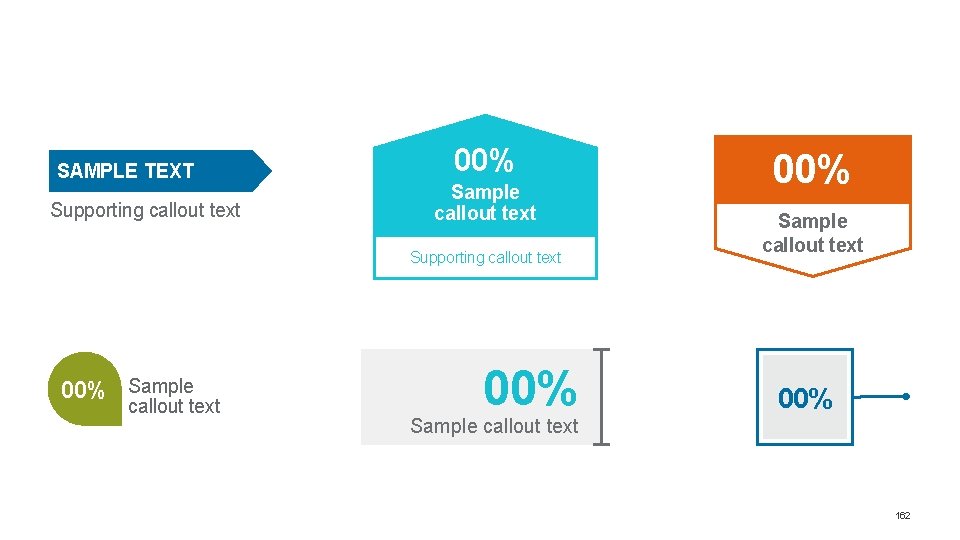
Generic Text Segment 3 20% 50% Segment 1 30% Segment 2 157
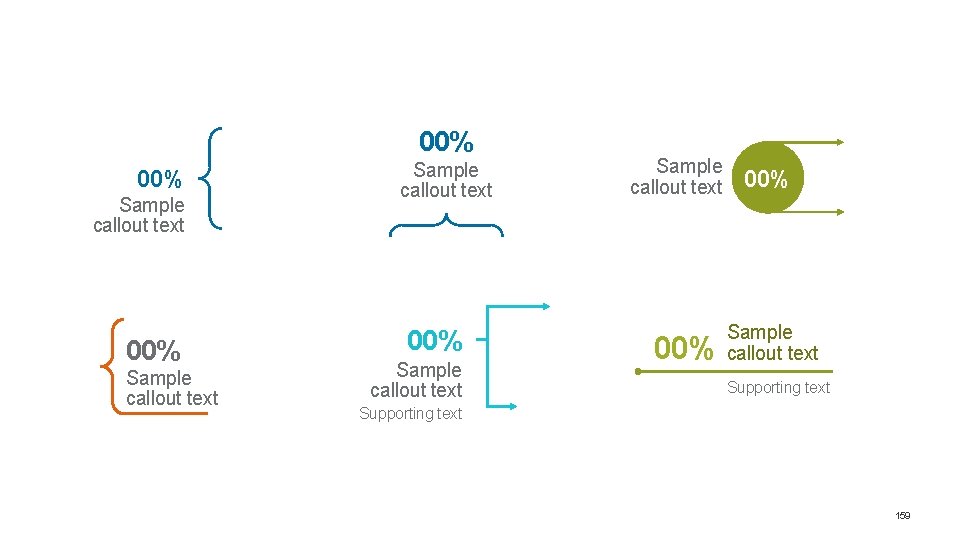
CHAPTER THREE Callout Library Grab a stylized annotation for your own charts. Shapes and text are grouped and formatted for easy customization. 158
00% Sample callout text Sample callout text 00% Sample callout text Supporting text 159
00% Sample callout text SAMPLE TEXT Supporting callout text 00% Sample callout text 160
Sample callout text 00% Sample 00% callout text 00% Sample callout text 01 00 M Sample callout text Supporting callout text 161
SAMPLE TEXT Supporting callout text 00% Sample callout text 00% Sample callout text 162
00 M 00 M 00 M 163
Sample callout text 00% Sample callout text Supporting callout text Sample callout text 00% Supporting callout text Sample callout text 00 Supporting callout text 164
00% Sample callout text Supporting callout text Sample callout text 00 M Supporting callout text 00% Sample callout text 165
Thank You www. duarte. com/datastory