Mechanical Ventilation for Nursing Mechanical Ventilation Definition Positive


")


 • PRVC: Pressure Regulated Volume Control • PEEP: Positive End")


 about 30 minutes after")


: üDelivers a pre-set number of breaths at a set")
 • Preset tidal volume at a preset rate •")
 • Potential advantages – Better patient-ventilator interaction – Less")


: • This is a volume targeted, pressure limited mode.")

 • Pressure assist during spontaneous inspiration • Pressure assist continues")


: • This is NOT a specific mode, but is")


: • This IS a mode and simply means that")
 • No machine breaths delivered • Allows spontaneous breathing")


 and the")


 • • Respiratory Rate Spontaneous Vt Inspiratory Pressure Breathing")


 Measurement*")


 Pa. O 2 (mm Hg) Pa. CO 2")
* Calcium")
 High AG Acidoses Normal AG Acidoses Lactic acidosis")
![Primary Acid-Base Disorders and Associated Compensatory Changes [H 1] = 24 × PCO](https://slidetodoc.com/presentation_image/980e400baf630e2bf05e454aab32c72c/image-114.jpg "Primary Acid-Base Disorders and Associated Compensatory Changes [H 1] = 24 × PCO")


")
")


 Indications Vasopressors: Epi")


 Protein (g/L) Osmolarity")
 Osmolality (m.")
 Energy Yield* (kcal/L)* Osmolarity (m. Osm/L) 5% 50")
 Aminosyn RF")
- Slides: 139
Mechanical Ventilation for Nursing
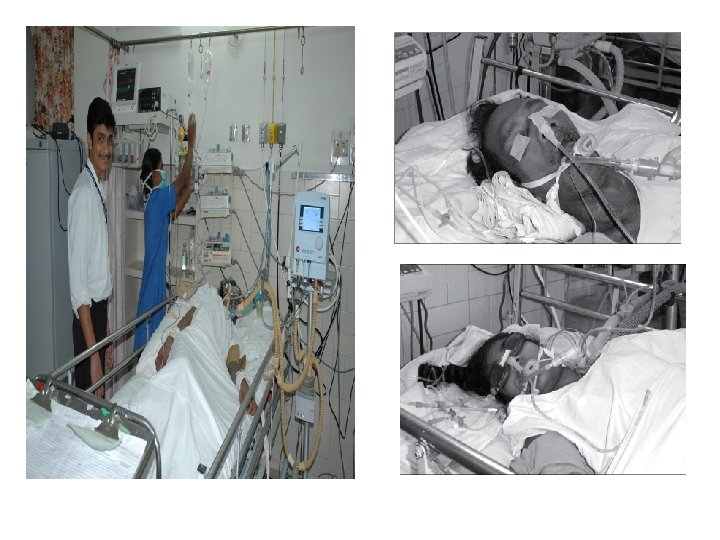
Mechanical Ventilation • Definition: Positive pressure ventilation provides pressure and flow to the airway in order to effect Oxygen and CO 2 transport between the environment & pulmonary capillary bed.
Indications for Mechanical Ventilation • Ventilation abnormalities – Respiratory muscle dysfunction • Respiratory muscle fatigue • Chest wall abnormalities – Neuromuscular disease – Decreased ventilatory drive – Increased airway resistance and/or obstruction
Indications for Mechanical Ventilation • Oxygenation abnormalities – Refractory hypoxemia – Need for positive end-expiratory pressure (PEEP) – Excessive work of breathing
Indications for Mechanical Ventilation Respiratory Failure – 2 Types üHypoxemic Respiratory Failure üHypercapnic Respiratory Failure
Hypoxemic Respiratory Failure üPa. O 2 < 60 mm. Hg in an otherwise healthy individual
Hypercapnic Respiratory Failure üPa. CO 2 > 50 mm. Hg in an otherwise healthy individual • AKA “Ventilatory Failure” • Caused by increased WOB, ↓ventilatory drive, or muscle fatigue
Alveolar Hypoventilation in the ICU Brainstem respiratory depression 1. Drugs (e. g. , opiates) 2. Obesity-hypoventilation syndrome Peripheral neuropathy 1. Critical illness polyneuropathy 2. Guillain-Barré syndrome Muscle weakness 1. Critical illness myopathy 2. Hypophosphatemia 3. Magnesium depletion 4. Myasthenia gravis
Goals of Mechanical Ventilation • Provide appropriate oxygen supplementation • Assure adequate alveolar minute ventilation • Reduce work of breathing • Increase patient comfort during respiration
Mechanical Ventilation • Types: – Total: The mechanical device completely unloads the ventilatory muscles & provides all the work of breathing. – Partial: The mechanical device partially unloads the ventilatory muscles requiring the patient to provide the remainder of work of breathing.
Mechanical Ventilation • Use: – Total: Respiratory failure with patient ms. Are clearly overloaded or fatigued. Gas exchange is very unstable or unreliable. – Partial: Respiratory failure less severe & / or during recovery or weaning phase.
Device Design Features for total ventilatory support: • What initiates breath? Trigger variable Patient effort Machine timer
Device Design Features for total ventilatory support: • What controls gas delivery during breath? Target variable Flow target Pressure target
Device Design Features for total ventilatory support: • What terminates breath? Cycle variable Volume Pressure Inspiratory time
ØVolume ventilation: Volume is constant and pressure will vary with patient’s lung compliance. ØPressure ventilation: Pressure is constant and volume will vary with patient’s lung compliance. ØTime ventilation: Time is important and volume & pressure will vary with patient’s lung compliance.
Volume Ventilation • Preset – – – Volume PEEP Rate I-time Fi. O 2 • Ventilator Determines – Pressure required • Advantages – Guaranteed minute ventilation – More comfortable for patient • Draw-backs – Large ETT leak – Not optimal for poorly compliant lungs
Pressure Ventilation • Preset – – – PIP PEEP Rate I-time Fi. O 2 • Vent determines – Tidal volume given • Advantages – Provides more support at lower PIP for poorly compliant lungs • Draw back – Minute ventilation not guaranteed
Volume vs. Pressure
Compliance = Volume Pressure
Ventilator Settings Terminology • A/C: Assist-Control • IMV: Intermittent Mandatory Ventilation • SIMV: Synchronized Intermittent Mandatory Ventilation • Bi-level/Biphasic: Non-inversed Pressure Ventilation with Pressure Support (consists of 2 levels of pressure)
Ventilator Settings Terminology (con’t) • PRVC: Pressure Regulated Volume Control • PEEP: Positive End Expiratory Pressure • CPAP: Continuous Positive Airway Pressure • PSV: Pressure Support Ventilation • NIPPV: Non-Invasive Positive Pressure Ventilation
Oxygen-Transport Parameters Parameter Symbol Normal Range Mixed venous oxygen saturation Sv. O 2 70– 75% Oxygen delivery DO 2 520– 570 m. L/min/m 2 Oxygen uptake VO 2 110– 160 m. L/min/m 2 Oxygen-extraction ratio O 2 ER 20%– 30%
Cardiovascular Parameters Parameter Abbreviati on Normal Range Central venous pressure CVP 1– 6 mm Hg Pulmonary capillary wedge pressure PCWP 6– 12 mm Hg Cardiac index CI 2. 4– 4 L/min/m 2 Stroke volume index SVI 40– 70 m. L/beat/m 2 Left-ventricular stroke work index LVSWI 40– 60 g · m/m 2 Stroke work index RVSWI 4– 8 g · m/m 2 Ejection fraction RVEF 46– 50% End-diastolic volume RVEDV 80– 150 m. L/m 2 Systemic vascular resistance index SVRI 1, 600– 2, 400 dynes · sec 1 · cm 5/m 2 Pulmonary vascular resistance index PVRI 200– 400 dynes · sec 1 · cm 5/m 2 Right-ventricular:
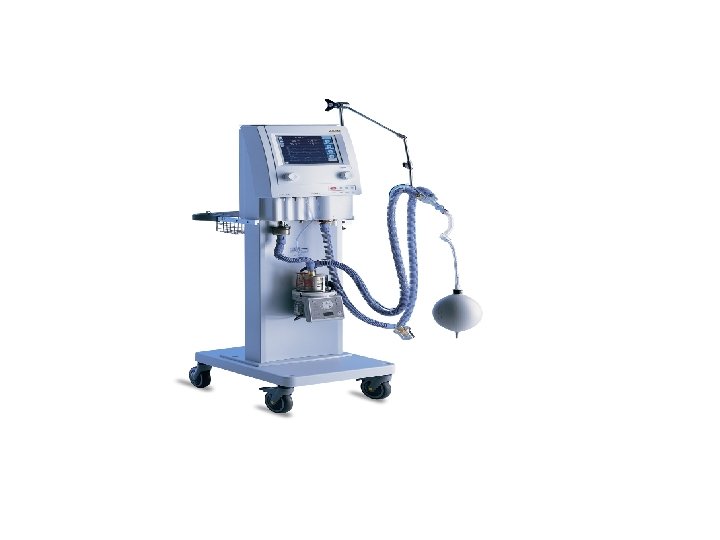
Mechanical Ventilators
Mechanical Ventilators
Mechanical Ventilators
Mechanical Ventilators
Mechanical Ventilators
High Frequency Mechanical Ventilator
Evita 4
Initial Settings • • Select your mode of ventilation Set sensitivity at Flow trigger mode Set Tidal Volume Set Rate Set Inspiratory Flow (if necessary) Set PEEP Set Pressure Limit Humidification
Post Initial Settings • Obtain an ABG (arterial blood gas) about 30 minutes after you set your patient up on the ventilator. • An ABG will give you information about any changes that may need to be made to keep the patient’s oxygenation and ventilation status within a physiological range.
MODES of VENTILATION
MODES CPAP Conventional PCV ACV CMV CPAP PSV Psup Tp Vt Rate Ti Pinsp Te @ SIMV Controlled (CMV) Modes Controls PEEP Fi. O 2 Assist control Intermittent Mandatory ventilation Ventilation (ACV) (IMV) Synchronised intermittant mandatory ventilation (SIMV)
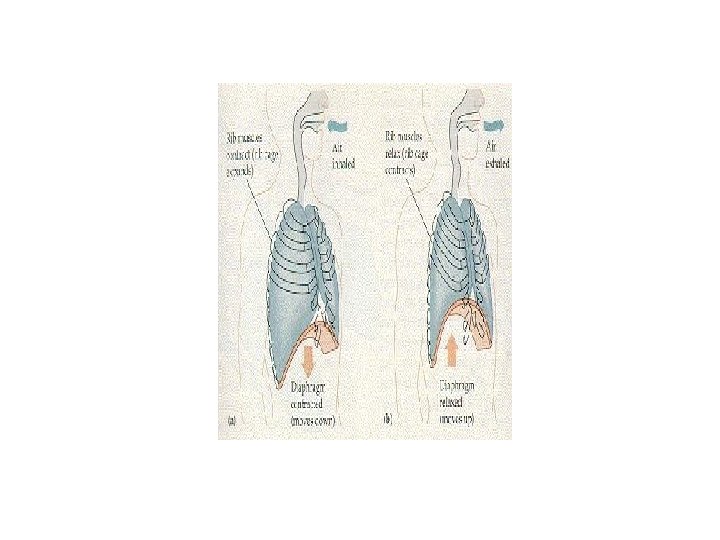
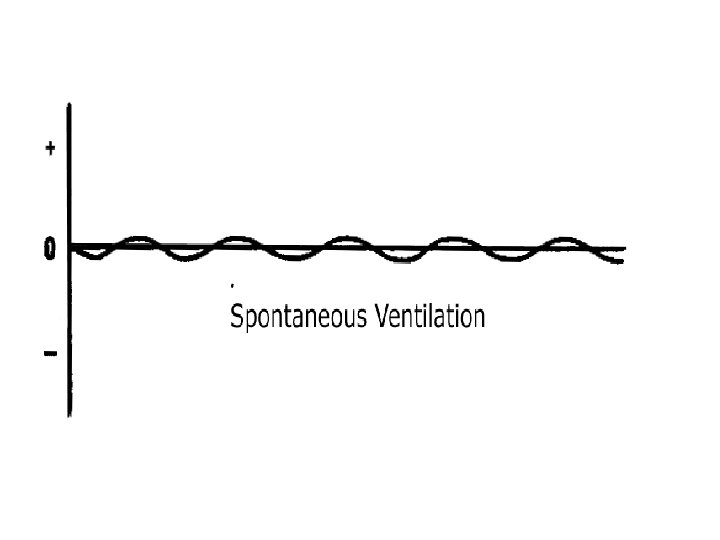
Spontaneous respiration vs. Mechanical ventilation • Natural Breathing – Negative inspiratory force – Air pulled into lungs • Mechanical Ventilation – Positive inspiratory pressure – Air pushed into lungs
Point of Reference: Spontaneous Ventilation
Spontaneous Breathing
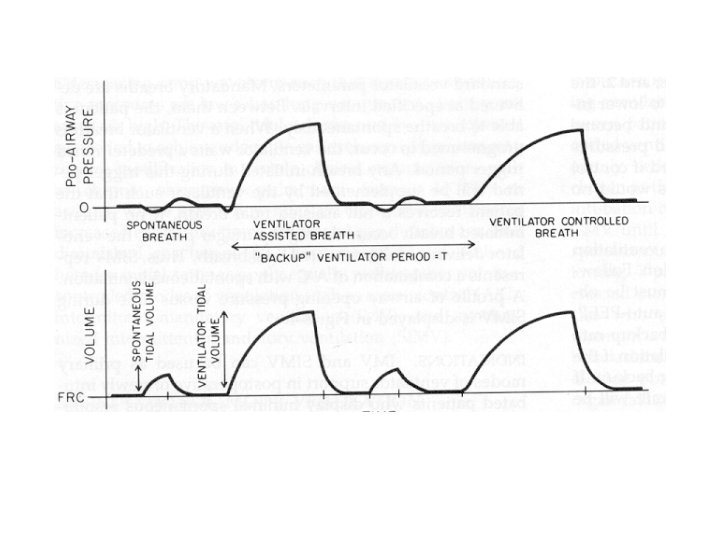
Control Mode Delivers pre-set volumes at a pre-set rate and a pre-set flow rate. The patient CANNOT generate spontaneous breaths, volumes, or flow rates in this mode.
Controlled Mechanical Ventilation • • Preset rate and tidal volume No patient interaction with ventilator Advantages: rests muscles of respiration Disadvantages: requires sedation/neuromuscular blockade, potential adverse hemodynamic effects
Control Mode
Control Mode
CMV
Assist/Control Mode • Delivers pre-set volumes at a preset rate and a pre-set flow rate. • The patient CANNOT generate spontaneous volumes, or flow rates in this mode. • Each patient generated respiratory effort over and above the set rate are delivered at the set volume and flow rate.
Assist-Control Ventilation • Preset tidal volume and minimal ventilator rate • Additional patient-initiated breaths receive preset tidal volume • Advantages: reduced work of breathing; allows patient to modify minute ventilation • Disadvantages: potential adverse hemodynamic effects or inappropriate hyperventilation
A/C Negative deflection, triggering assisted breath
Assist Mode
Assist/Control
A/CV
Assist-control, volume
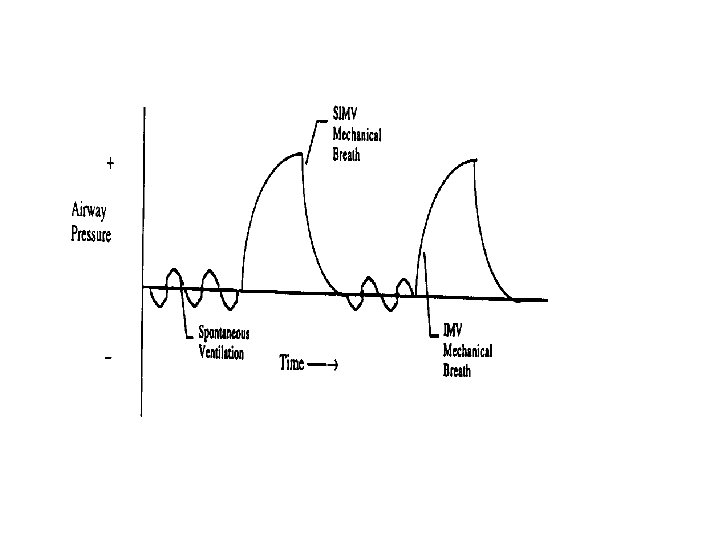
IMV – Intermittent Mandatory Ventilation
IMV, volume-limited Ingento EP & Drazen J: Mechanical Ventilators, in Hall JB, Scmidt GA, & Wood LDH(eds. ): Principles of Critical Care
SYCHRONIZED INTERMITTENT MANDATORY VENTILATION (SIMV): üDelivers a pre-set number of breaths at a set volume and flow rate. üAllows the patient to generate spontaneous breaths, volumes, and flow rates between the set breaths. üDetects a patient’s spontaneous breath attempt and doesn’t initiate a ventilatory breath – prevents breath stacking
Synchronized Intermittent Mandatory Ventilation (SIMV) • Preset tidal volume at a preset rate • Additional spontaneous breaths at tidal volume and rate determined by patient • Often used with pressure support
Synchronized Intermittent Mandatory Ventilation (SIMV) • Potential advantages – Better patient-ventilator interaction – Less hemodynamic effects • Potential disadvantages – Higher work of breathing than CMV, AC
SIMV Machine Breaths Spontaneous Breaths
SIMV, volume-limited Ingento EP & Drazen J: Mechanical Ventilators, in Hall JB, Scmidt GA, & Wood LDH(eds. ): Principles of Critical Care
PRESSURE REGULATED VOLUME CONTROL (PRVC): • This is a volume targeted, pressure limited mode. (available in SIMV or AC) • Each breath is delivered at a set volume with a variable flow rate and an absolute pressure limit. • The vent delivers this pre-set volume at the LOWEST required peak pressure and adjust with each breath.
PRVC
Pressure-Support Ventilation (PSV) • Pressure assist during spontaneous inspiration • Pressure assist continues until inspiratory effort decreases • Delivered tidal volume dependent on inspiratory effort and resistance/compliance of lung/thorax
Pressure-Support Ventilation • Potential advantages – Patient comfort – Less WOB than spontaneous breathing – May enhance patient-ventilator synchrony – Used with SIMV to support spontaneous breaths
Pressure-Support Ventilation • Potential disadvantages – Variable tidal volume if pulmonary resistance/compliance changes rapidly – If sole mode of ventilation, apnea alarm is only backup – Gas leak from circuit may interfere with cycling
Positive Pressure Breath
Pressure-Controlled Ventilation • Used to limit inflationary pressures • Allows setting of inspiratory time • Complexity of interacting ventilatory variables necessitates critical care consultation
POSITIVE END EXPIRATORY PRESSURE (PEEP): • This is NOT a specific mode, but is rather an adjunct to any of the vent modes. • PEEP is the amount of pressure remaining in the lung at the END of the expiratory phase. • Utilized to keep otherwise collapsing lung units open while hopefully also improving oxygenation.
PEEP Pressure above zero PEEP is the amount of pressure remaining in the lung at the END of the expiratory phase.
Auto-PEEP • Can be measured on some ventilators • Increases peak, plateau, and mean airway pressures • Potential harmful physiologic effects
PEEP
Continuous Positive Airway Pressure (CPAP): • This IS a mode and simply means that a preset pressure is present in the circuit and lungs throughout both the inspiratory and expiratory phases of the breath. • CPAP serves to keep alveoli from collapsing, resulting in better oxygenation and less WOB. • The CPAP mode is very commonly used as a mode to evaluate the patients readiness for extubation.
Continuous Positive Airway Pressure (CPAP) • No machine breaths delivered • Allows spontaneous breathing at elevated baseline pressure • Patient controls rate and tidal volume
Ventilators: a Schematic
Oxygenation
• Oxygenation is primarily controlled by the Mean Airway Pressure (Paw) and the Fi. O 2. • Mean Airway Pressure is a constant pressure used to inflate the lung and hold the alveoli open. • Since the Paw is constant, it reduces the injury that results from cycling the lung open for each breath
Contraindications for an Artificial Airway When a pt’s desire to not be resuscitated has been expressed and is documented in the pt’s chart
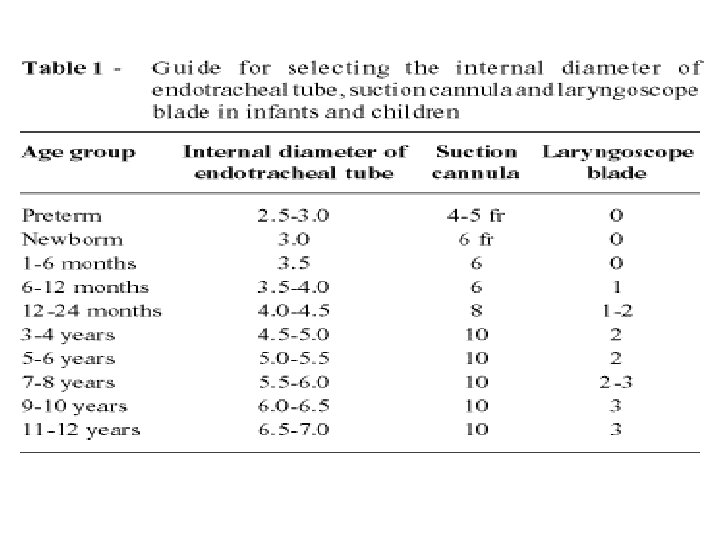
Establishing an Artificial Airway Adult female 8. 0 Adult male 9. 0
Miller vs. Mac. Intosh Blades
Intubation Procedure Check and Assemble Equipment: üOxygen flowmeter and O 2 tubing üSuction apparatus and tubing üSuction catheter or yankauer üAmbu bag and mask üLaryngoscope with assorted blades ü 3 sizes of ET tubes üStylet üStethoscope üTape üSyringe üMagill forceps üTowels for positioning
Intubation Procedure Position your patient into the sniffing position
Intubation Procedure Preoxygenate with 100% oxygen to provide apneic or distressed patient with reserve while attempting to intubate. Do not allow more than 30 seconds to any intubation attempt. If intubation is unsuccessful, ventilate with 100% oxygen for 3 -5 minutes before a reattempt.
Intubation Procedure Insert Laryngoscope
Intubation Procedure
Intubation Procedure After displacing the epiglottis insert the ETT. The depth of the tube for a male patient on average is 21 -23 cm at teeth The depth of the tube on average for a female patient is 19 -21 at teeth.
Intubation Procedure Confirm tube position: üBy auscultation of the chest üBilateral chest rise üTube location at teeth üCO 2 detector – (esophageal detection device)
Intubation Procedure Stabilize the ETT
Low-Flow Oxygen Inhalation Systems Device Reservoir Capacity Nasal cannula 50 m. L Oxygen Flow (L/min) Approximate (Fi. O 2)* 1 0. 21– 0. 24 2 0. 24– 0. 28 3 0. 28– 0. 34 4 0. 34– 0. 38 5 0. 38– 0. 42 6 0. 42– 0. 46 Oxygen face mask 150– 250 m. L 5– 10 0. 40– 0. 60 Mask–reservoir bag: 750– 1250 m. L Partial rebreather 5– 7 0. 35– 0. 75 Nonrebreather 5– 10 0. 40– 1. 0 *Estimated value based on a tidal volume of 500 m. L, a respiratory rate of 20 breaths/min, and an inspiratory: expiratory time ratio of 1: 2.
Weaning & Extubation
Predictors of Weaning Outcome Predictor Value Evaluation of ventilatory drive: § P 0. 1 § < 6 cm H 2 O Ventilatory muscle capability: § Vital capacity § Maximum inspiratory pressure § > 10 m. L/kg § < -30 cm H 2 O Ventilatory performance § Minute ventilation § Maximum voluntary ventilation § Rapid shallow breathing index § Respiratory rate § < 10 L/min § > 3 times VE § < 100 § < 30 /min
Mechanical Ventilation Weaning: Predictors (Parameters) • • Respiratory Rate Spontaneous Vt Inspiratory Pressure Breathing Index (f/Vt) PEEP Pa. O 2/FIO 2 < 30/min > 4 ml/kg > - 20 cm H 2 O < 105 < 8 cm. H 2 O > 200 <. 50
Mechanical Ventilation Weaning: Criteria • Hemodynamically stable • Correction of underlying lung disease • Correction of acid-base/electrolyte disorders • Adequate nutrition • Mentally alert • Avoidance of sedation
Weaning Priorities • • • Wean PIP to <35 cm H 2 O Wean Fi. O 2 to <60% Wean I-time to <50% Wean PEEP to <8 cm H 2 O Wean Fi. O 2 to <40% Wean PEEP, PIP, I-time, and rate towards extubation settings. • Can consider changing to volume control ventilation when PIP <35 cm H 2 O.
Weaning Failure Criteria • Rapid shallow breathing – RR > 35/min or > 10/min increase • Tachycardia – > 120 bpm or > 20 bpm increase • BP change > 20% • Mental status change
Weaning Failure Criteria • Clinical signs of distress: – Increased dyspnea – Diaphoresis – Accessory muscle use – Paradoxical breathing • Hypoxemia and/or hypercapnea
Weaning Failure to Wean • Auto-PEEP • Cardiac disease – CHF, ischemic heart disease • Nutrition and electrolyte imbalance • Inadequate rest following previous trial – May need up to 24 hours • Muscle weakness – Paralysis or polyneuropathy of critical illness
Does the patient have…. . . • • Neuromuscular blockers PEEP > 5 Fi. O 2 > 45% or Sa 02 < 92% Hemodynamic instability Increased ICP Sedation drip (Propofol, Ativan, Versed, etc. ) Unstable angina Temp > 39 Physician has requested patient not to be weaned
Mechanical Ventilation Rest 24 hrs Pa. O 2/Fi. O 2 ≥ 200 mm Hg PEEP ≤ 5 cm H 2 O Intact airway reflexes No need for continuous infusions of vasopressors or inotrops > 100 RSBI <100 Stable Support Strategy Assisted/PSV 24 hours Daily SBT Low level CPAP (5 cm H 2 O), Low levels of pressure support (5 to 7 cm H 2 O) “T-piece” breathing 30 -120 min Yes RR > 35/min Spo 2 < 90% HR > 140/min Sustained 20% increase in HR SBP > 180 mm Hg, DBP > 90 mm Hg Anxiety Diaphoresis No Extubation
Measurements Used to Identify Patients Who Will Tolerate a Spontaneous Breathing Trial (SBT) Measurement* Reference Range in Threshold for Adults Successful SBT†Tidal Volume (VT) 5– 7 m. L/kg 4– 6 m. L/kg Respiratory Rate (RR) 10– 18 bpm 30– 38 bpm Total Ventilation (VE) 5– 6 L/min 10– 15 L/min RR/VT Ratio 40– 50/L 60– 105/L Maximum Inspiratory Pressure (Pimax) -90 to -120 cm H 2 O -15 to -30 cm H 2 O *All measurements should be obtained during spontaneous breathing. †From Reference 1.
ABG
Normal Levels of Oxygen in Arterial and Venous Blood* Parameter Arterial Blood Venous Blood PO 2 90 mm Hg 40 mm Hg O 2 Saturation of Hb 0. 98 0. 73 Hb-bound O 2 197 m. L/L 147 m. L/L Dissolved O 2 2. 7 m. L/L 1. 2 m. L/L Total O 2 content 200 m. L/L 148 m. L/L Blood volume†1. 25 L 3. 75 L Volume of O 2 250 m. L 555 m. L *Values shown are for a body temperature of 37 °C and a hemoglobin concentration of 15 g/d. L (150 g/L) in blood. †Volume estimates are based on a total blood volume (TBV) of = L, arterial blood volume of 0. 25 × TBV, and venous blood volume of 0. 75 3 TBV. Abbreviations: Hb, hemoglobin 5 PO 2, partial pressure of O 2.
Normal Levels of CO 2 in Arterial and Venous Blood* Parameter Arterial Blood Venous Blood PCO 2 40 mm Hg 45 mm Hg Dissolved CO 2 27 m. L/L 29 m. L/L Total CO 2 content 490 m. L/L 530 m. L/L Blood volume†1. 25 L 3. 75 L Volume of CO 2 613 m. L 1, 988 m. L *Values shown are for a body temperature of 37 °C. †Volume estimates are based on a total blood volume (TBV) of 5 L, arterial blood volume of 0. 25 × TBV, and venous blood volume of 0. 75 3 TBV. Abbreviations: PCO 2 = partial pressure of CO 2.
Body Fluid and Blood Volumes Fluid Men Women Total body fluid 600 m. L/kg 500 m. L/kg Whole blood 66 m. L/kg 60 m. L/kg Plasma 40 m. L/kg 36 m. L/kg Erythrocytes 26 m. L/kg 24 m. L/kg Values expressed for lean body weights. American Association of Blood Banks Technical Manual. 10 th ed. Arlington, VA: American Association of Blood Banks, 1990: 650.
ABG • Goal: • Keep patient’s acid/base balance within normal range: • p. H • PCO 2 • PO 2 7. 35 – 7. 45 35 -45 mm. Hg 80 -100 mm. Hg
Normal Arterial Blood Gases Age (years) Pa. O 2 (mm Hg) Pa. CO 2 (mm Hg) A-a PO 2 (mm Hg) 20 84– 95 33– 47 4– 17 30 81– 92 34– 47 7– 21 40 78– 90 34– 47 10– 24 50 75– 87 34– 47 14– 27 60 72– 84 34– 47 17– 31 70 70– 81 34– 47 21– 34 80 67– 79 34– 47 25– 38 All values pertain to room air breathing at sea level. From the Intermountain Thoracic Society Manual of Uniform Laboratory Procedures. Salt Lake City, 1984: 44– 45.
Determinants of the Anion Gap Unmeasured Anions Unmeasured Cations Albumin (15 m. Eq/L)* Calcium (5 m. Eq/L) Organic Acids (5 m. Eq/L) Potassium (4. 5 m. Eq/L) Phosphate (2 m. Eq/L) Magnesium (1. 5 m. Eq/L) Sulfate (1 m. Eq/L) Total UA: (23 m. Eq/L) Total UC: (11 m. Eq/L) Anion Gap = UA - UC = 12 m. Eq/L *If albumin is reduced by 50%, anion gap = 4 m. Eq/L
Interpretation of the Anion Gap (AG) High AG Acidoses Normal AG Acidoses Lactic acidosis Diarrhea Ketoacidosis Isotonic saline infusion End-stage renal failure Early renal insufficiency Methanol ingestion Renal tubular acidosis Ethylene glycol ingestion Acetazolamide Salicylate toxicity Ureteroenterostomy
Primary Acid-Base Disorders and Associated Compensatory Changes [H 1] = 24 × PCO 2/HCO 3 Primary Disorder Primary Change Compensatory Change* Respiratory acidosis Increased PCO 2 Increased HCO 3 Respiratory alkalosis Decreased PCO 2 Decreased HCO 3 Metabolic acidosis Decreased HCO 3 Decreased PCO 2 Metabolic alkalosis Increased HCO 3 Increased PCO 2 * Compensatory changes are designed to keep the PCO 2/HCO 3 ratio constant.
Most important tips
Organisms Isolated from the Hands of ICU Personnel Organism % Total Cultures Gram-positive cocci Staph. epidermidis 100% Staph. aureus (MSSA) 7% Gram-negative Bacilli 21% Acinetobacter spp. Klebsiella spp. Enterobacter spp. Pseudomonas spp. Serratia spp. Yeasts and fungi 16% Candida spp. MSSA, methicillin-sensitive Staph. aureus. From Larson EL, Rackoff WR, Weiman M, et al. Assessment of two hand-hygiene regimens for intensive care unit personnel. Crit Care Med, 2001; 29: 944.
Pathogens Involved in Nosocomial Infections* % of Infections Pathogen Pneumonia UTI Bloodstream Infection Staphylococcus aureus 20 2 13 Staphylococcus epidermidis 1 2 36 Enterococci 2 14 16 Pseudomonas aeruginosa 21 10 3 Klebsiella pneumoniae 8 6 4 Enterobacter 9 5 3 Escherichia coli 4 14 3 Candida albicans 5 23 6
Pathogens Isolated by Bronchoscopy in Ventilator-Associated Pneumonia Organisms Frequency Bacilli 56. 5% Pseudomonas aeruginosa 18. 9% Escherichia coli 9. 2% Hemophilus 7. 1% Enterobacter 3. 8% Proteus 3. 8% Klebsiella 3. 2% Others 10. 5% Cocci 42. 1% Staphylococcus aureus 18. 9% Streptococcus pneumoniae 13. 2% Enterococcus 1. 4% Others 8. 6% Fungi 1. 3%
Quantitative Cultures for the Diagnosis of Pneumonia in Ventilator-Dependent Patients Diagnostic Threshold (cfu/m. L) TA PSB BAL 105 to 106 103 104 to 105 Sensitivity (mean) 76% 66% 73% Specificity (mean) 75% 90% 82% Most Sensitive Most Specific Most Accurate Relative Performance Abbreviations: TA = tracheal aspirates, PSB = protected specimen brushings, BAL = bronchoalveolar lavage.
Causes of Pneumonia in HIV Patients* Bacterial Pneumonia Nonbacterial Pneumonia Streptococcus pneumoniae (15– 20%) Pneumocystis carinii (3– 15%) Hemophilus influenza (5– 15%) Fungi (5– 10%) Staphylococcus aureus (3– 5%) Mycobacterium tuberculosis and Mycobacterium avium complex (5%) Pseudomonas aeruginosa (3– 6%) Other Gramnegative bacilli (3– 5%) Organism never identified (25– 60%) Atypical organisms (1– 4%)â€
Drugs Used for Prophylaxis of Stress Ulcer Bleeding Agent Type Route Dose Recommendations Sucralfate Cytoprotective agent NG tube 1 g every 6 hr 2. Watch for drug interactions Famotidine H 2 Blocker IV 20 mg every 12 hr 2. Adjust dose in renal insufficiency Ranitidine H 2 Blocker IV 50 mg every 8 hr 2. Adjust dose in renal insufficiency Pantoprazol Proton-pump inhibitor IV 40 mg daily as a single dose
Risk Factors for Venous Thromboembolism in Hospitalized Patients Surgery Major surgery: abdominal, gynecologic, urologic, orthopedic, neurosurgery, cancerrelated surgery Trauma Multisystem trauma, spinal cord injury, spinal fracture, fractures of the hip and pelvis Malignancy Any malgnancy, overt or covert, local or metastatic. Risk higher during chemotherapy and radiotherapy Acute medical illness Stroke, acute myocardial infarction, heart failure, neuromuscular weakness syndromes (e. g. , Guillain-Barre) Patient-specific factors History of thromboembolism, obesity, increasing age older than 40, hypercoagulable state (e. g. , estrogen therapy) ICU-related factors Prolonged mechanical ventilation, neuromuscular paralysis (drug-induced), central venous catheters, severe sepsis, consumptive coagulopathy, heparin-induced thrombocytopenia
Clinical and Laboratory Findings in Patients with Suspected Pulmonary Embolism Findings Positive Predictive Value Negative Predictive Value Dyspnea 37% 75% Tachycardia 47% 86% Tachypnea 48% 75% Pleuritic chest pain 39% 71% Hemoptysis 32% 67% Hypoxemia 34% 70% Elevated plasma D-dimera 27% 92% Increased dead-space ventilationb 36% 92% Positive predictive value: the percentage of patients with the findings who had a pulmonary embolus. It expresses the likelihood that a pulmonary embolus is present when the finding is present; negative predictive value: the percentage of patients without the finding who did not have a pulmonary embolus. It expresses the likelihood that a pulmonary embolus is not present when the finding is also not present.
Weight-based Heparin Dosing Regimen 1. Prepare heparin infusion by adding 20, 000 IU heparin to 500 m. L diluent (40 IU/m. L). 2. Give initial bolus dose of 80 IU/kg and follow with continuous infusion of 18 IU/kg/hr. (Use actual body weight. ) 3. Check PTT 6 hr after start of infusion, and adjust heparin dose as indicated below. PTT (sec) PTT Ratio Bolus Dose Continuous Infusion <35 <1. 2 80 IU/kg Increase by 4 IU/kg/hr 35– 45 1. 2– 1. 5 40 IU/kg Increase by 2 IU/kg/hr 46– 70 1. 5– 2. 3 — 71– 90 2. 3– 3. 0 — Decrease by 2 IU/kg/hr >90 >3 — Stop infusion for 1 hr then decrease by 3 IU/kg/hr —
Different Types of Vascular Catheters Type of Catheter Peripheral venous catheter Sizes Lengths 18 ga 5 cm, 7 cm 22 ga 4 cm, 5 cm 16 ga, 18 ga 15 cm, 12 cm 20 ga 8 cm 7. 5 Fr 15 cm, 20 cm, 25 cm Triple lumen (18, 16 ga) 7 Fr 15 cm, 20 cm, 25 cm Peripherally inserted central catheter (PICC) 3 Fr 50 cm 4 & 5 Fr 60 cm Hemodialysis catheter 16 Fr 26 cm Introducer catheter 9 Fr 10 cm, 13 cm Radial artery catheter 20 ga, 21 ga 5 cm, 2. 5 cm, 5 cm Femoral artery catheter 18 ga, 20 ga 12 cm, 8 cm Central venous catheter Single lumen Double lumen (18, 18 ga) Fr: French unit (one French unit = 0. 33 mm): gauge unit
Accuracy of Vital Signs in the Detection of Acute Blood Loss Range of Reported Sensitivities Parameter Moderate Blood Loss (450– 630 m. L) Severe Blood Loss (630– 1150 m. L) Supine tachycardia 0– 42% 5– 24% Supine hypotension 0– 50% 21– 47% Postural pulse increment* or postural dizziness 6– 48% 91– 100% Age < 65 yrs 6– 12% Not known Age ≥ 65 yrs 14– 40% Not known Postural hypotension†*Increase in pulse rate ≥ 30 beats/min on standing. †Decrease in systolic pressure > 20 mm Hg on standing. ‡The summed results of 9 clinical studies. From Mc. Gee S, et al. JAMA 1999; 281: 1022.
Hemodynamic Effects of the Trendelenburg Position in Hypovolemic ICU Patients Change Parameter Supi ne Legs Up, Head Down Mean arterial blood pressure (mm Hg) 64 71 1 <. 0 1 01 ↑ Wedge pressure (mm Hg) 4. 6 7. 2 5 <. 0 7 01 ↑ Cardiac index (L/min · m 2) 2. 1 1. 9 9 NS ↔ Systemic vascular resistance (dyne · sec/cm 5 ·m 2) 2347 2905 2 <. 0 4 01 ↑ Sing R et al. Ann Emerg Med 1994; 23: 564. % p Effe ct
Types of Fluids Used for Volume Resuscitation Type of Fluid Products Performance Characteristics 1. Fluids that contain red blood cells. Whole blood, These fluids increase the oxygen Packed cells -carrying capacity of blood. Their ability to flow and augment cardiac output are limited by the viscosity effects of the cells. 2. Fluids that contain large molecules with restricted egress from the vascular space. Called colloids. Plasma, Albumin, Dextrans, Hetastarch These fluids preferentially increase intravascular volume, and are the most effective fluids for increasing cardiac output. 3. Fluids that contain electrolyes and other small molecules that move freely in the extracellular. space. Called crystalloids. Saline, Ringer's fluids, Normosol These fluids distribute evenly in the extracellular space, and preferentially increase interstitial fluid volume
Drug Dose Range Principal Effect Dobuta mine 3– 15 µg/kg/min Positive inotropic effect and systemic vasodilatation Dopami 1– 3 µg/kg/min ne 3– 10 µg/kg/min Renal vasodilatation and natriuresis Positive inotropic effect and systemic vasodilatation >10 µg/kg/min Systemic vasoconstriction Milrinon 50 µg/kg bolus, then e 0. 25– 1 µg/kg/min Positive inotropic effect, lusitropic effect, and systemic vasodilatation Nitrogly cerin Venous vasodilatation Arterial vasodilatation 1– 50 µg/min >50 µg/min Nitropru 0. 3– 2 µg/kg/min sside Systemic vasodilatation *Includes only drugs given by continuous intravenous infusion
Cardiac Arrest Drugs: Indications and Dosage Drug Dosage (IV or IO) Indications Vasopressors: Epi 1 mg first dose and repeat every 3 to 5 Asystole, PEA, and shock-resistant nephri min if needed. VF or VT. ne Vas opres sin 40 units as a single dose. Can replace the first or second dose of epinephrine. Antiarrhythmic agents Ami odaro ne 300 mg first dose, then 150 mg once if needed. VF or pulseless VT that is refractory to defibrillation and vasopressors. Lido 1– 1. 5 mg/kg first dose, then caine 0. 5– 0. 75 mg/kg to a total of 3 doses or 3 mg/kg. Alternative to amiodarone. Mag 1– 2 g over 5 min nesiu m Pulseless polymorphic VT (torsades de pointes) with prolonged QT interval. Atro 1 mg first dose. Repeat every 3 to 5 pine min if needed to total of 3 doses. Bradyarrhythmias, or as an adjunct to vasopressors for asystole and
Manifestations of Hypothermia Severity Body Temperature Clinical Manifestations Mild 32 °C– 35 Confusion, cold, pale skin, shivering, °C 90 °F– 95 tachycardia °F Moderate 28 °C– 31. 8 Lethargy, reduced or absent shivering, °C 82 °F– 89 bradycardia, decreased respiratory rate °F Severe <28 °C Obtundation or coma, no shivering, <82 °F edematous skin, dilated and fixed pupils, bradycardia, hypotension, oliguria Lifethreatening <25 °C <77 °F Apnea, asystole
TPN
Recommended Daily Requirements for Vitamins Vitamin A Enteral Dose Parenteral Dose 1000 µg 3300 IU Vitamin B 12 3 µg 5 µg Vitamin C 60 mg 100 mg Vitamin D 5 µg 200 IU Vitamin E 10 mg 10 IU Vitamin K* 100 µg 10 mg Thiamine (B 1)* 2 mg 3 mg Riboflavin (B 2)* 2 mg 4 mg Pyridoxine (B 6)* 2 mg 4 mg Pantothenic acid* 6 mg 15 mg Biotin* 150 µg 60 µg Folate 400 µg Adapted from Dark DS, Pingleton SK. Nutritional support in critically ill patients. Intensive Care Med 1993; 8: 16– 33. Doses for vitamins indicated by asterisks ( *) are averaged or rounded off to the nearest whole number.
Daily Requirements for Essential Trace Elements Trace Element Chromium Enteral Dose Parenteral Dose 200 µg 15 µg Copper 3 mg 1. 5 mg Iodine 150 µg Iron 10 mg 2. 5 mg Manganese 5 mg 100 µg 200 µg 70 µg 15 mg 4 mg Selenium Zinc Doses represent the maximum daily maintenance doses for each element. From Dark DS, Pingleton SK. Nutrition and nutritional support in critically ill patients. Intensive Care Med 1993; 8: 16– 33.
Characteristics of Selected Enteral Feeding Formulas Formula Caloric Density (kcal/m. L) Protein (g/L) Osmolarity (m. Osm/L) Volume to Meet US RDA* Ensure Plus HN 1. 5 63 525 1000 Isocal 1. 1 34 270 1890 Isocal HN 1. 1 44 270 1180 Nutren 1. 0 40 315 1500 Osmolite 1. 1 37 300 1890 Osmolite HN 1. 1 44 300 1320 Peptamen 1. 0 40 270 150 Ultracal 1. 1 37 500 1180 Vivonex TEN 1. 0 38 630 2000 Vital HN 1. 0 42 500 1500 *Indicates the volume needed to provide 100% of the recommended daily allowances (RDAs) for vitamins and essential trace elements.
Enteral Formulas with a High Caloric Density Formula Caloric Density (kcal/m. L) Osmolality (m. Osm/Kg) Volume to Meet US RDA Nepro 2 665 1000 Novasource Renal 2 700 1000 Two. Cal HN 2 725 950
Intravenous Dextrose Solutions Strength Concentration (g/L) Energy Yield* (kcal/L)* Osmolarity (m. Osm/L) 5% 50 170 253 10% 100 340 505 20% 200 680 1010 50% 500 1700 2525 70% 700 2380 3530 * Based on an oxidative energy yield of 3. 4 kcal/g for dextrose
Standard and Specialty Amino Acid Solutions Features Indication Aminosyn HBC 7%, (Abbott) Aminosyn RF 5. 2%, (Abbott) Hepat. Amine 8%, (Mc. Gaw) Standard TPN Hypercatabolis m Renal Failure Hepatic Failure Concentration 70 g/L 52 g/L 80 g/L Nitrogen Content (g/L) 11 11. 2 7. 7 12 Essential AAs (% Total) 48% 68% 89% 52% Branched Chain AAs (% Total) 25% 51% 33% 36% Osmolarity (m. Osm/L) 700 665 475 785 Borgsdorf LR, Cada DJ, Cirigliano M, et al. Drug Facts and Comparisons. 60 th ed. St. Louis, MO: Wolters Kluwer, 2006.