Chapter 20 The human genome Jonathan Pevsner Ph

- Slides: 120
Chapter 20: The human genome Jonathan Pevsner, Ph. D. pevsner@kennedykrieger. org Bioinformatics and Functional Genomics (Wiley-Liss, 3 rd edition, 2015) You may use this Power. Point for teaching
Learning objectives After studying this chapter you should be able to: ■ describe the main features of the human genome; ■ provide an overview of all the human chromosomes, giving a general description of their size, number of genes, and key features; and ■ explain the purpose and main conclusions of several key human genome efforts including the Hap. Map Project and 1000 Genomes Projects.
Outline Introduction Main conclusions of human genome project Gateways to access the human genome Human Genome Project Background Strategic issues Human genome assemblies Broad genomic landscape Repeat content of human genome Gene content of human genome 25 human chromosomes Human genome variation Perspective
Introduction B&FG 3 e Page 957 • The human genome is the complete set of DNA in Homo sapiens. • Its initial sequencing (2003) came 50 years after the publication of the double-stranded helical structure of DNA by Crick and Watson (1953). • In 2001 the sequencing extensive draft versions of the human genome were reported separately by the International Human Genome Sequencing Consortium (IHGSC) and by Celera Genomics. • In this chapter we follow the outline of the 62 page article in Nature by IHGSC (2001), providing updated information. We then survey the human chromosomes and end by discussing variation in the human genome.
Outline Introduction Main conclusions of human genome project Gateways to access the human genome Human Genome Project Background Strategic issues Human genome assemblies Broad genomic landscape Repeat content of human genome Gene content of human genome 25 human chromosomes Human genome variation Perspective
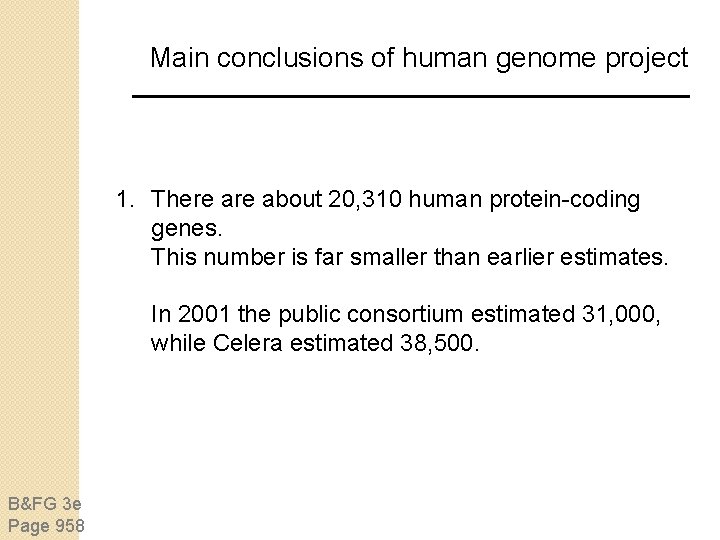
Main conclusions of human genome project 1. There about 20, 310 human protein-coding genes. This number is far smaller than earlier estimates. In 2001 the public consortium estimated 31, 000, while Celera estimated 38, 500. B&FG 3 e Page 958
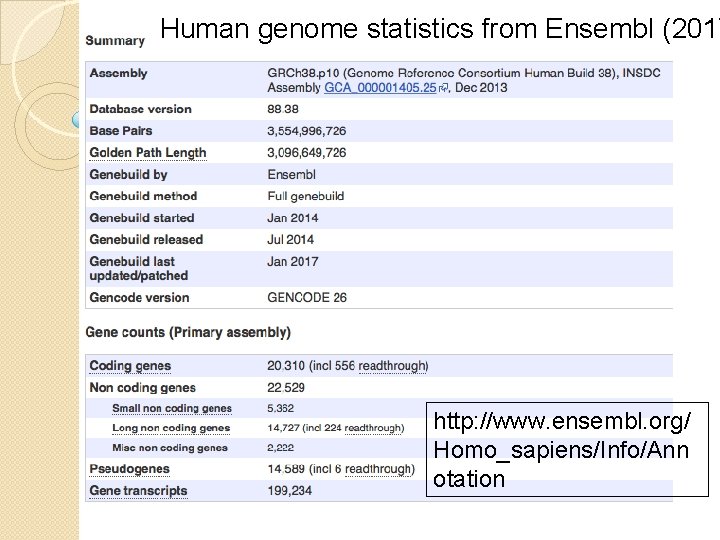
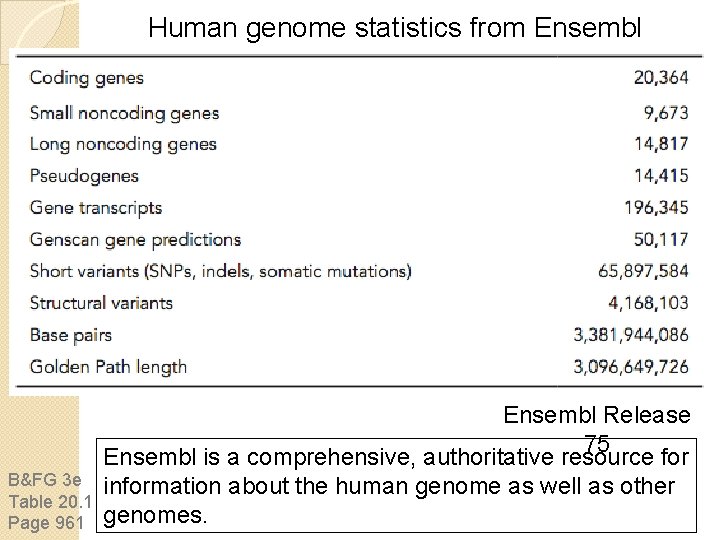
Human genome statistics from Ensembl (2017 http: //www. ensembl. org/ Homo_sapiens/Info/Ann otation
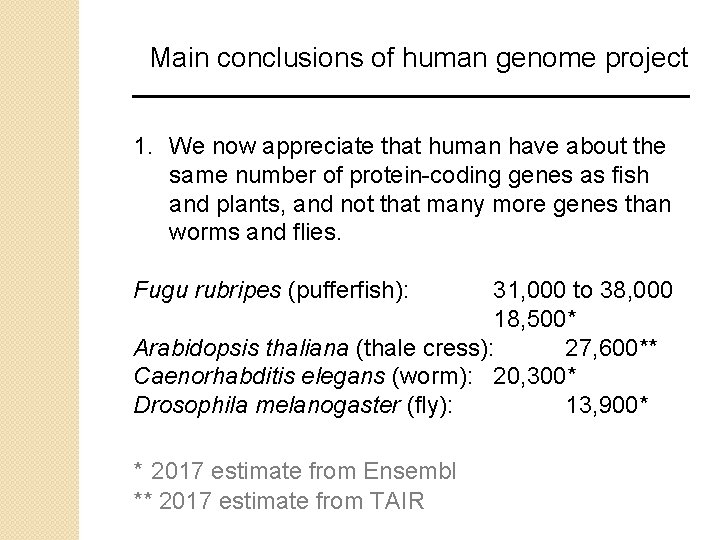
Main conclusions of human genome project 1. We now appreciate that human have about the same number of protein-coding genes as fish and plants, and not that many more genes than worms and flies. Fugu rubripes (pufferfish): 31, 000 to 38, 000 18, 500* Arabidopsis thaliana (thale cress): 27, 600** Caenorhabditis elegans (worm): 20, 300* Drosophila melanogaster (fly): 13, 900* * 2017 estimate from Ensembl ** 2017 estimate from TAIR
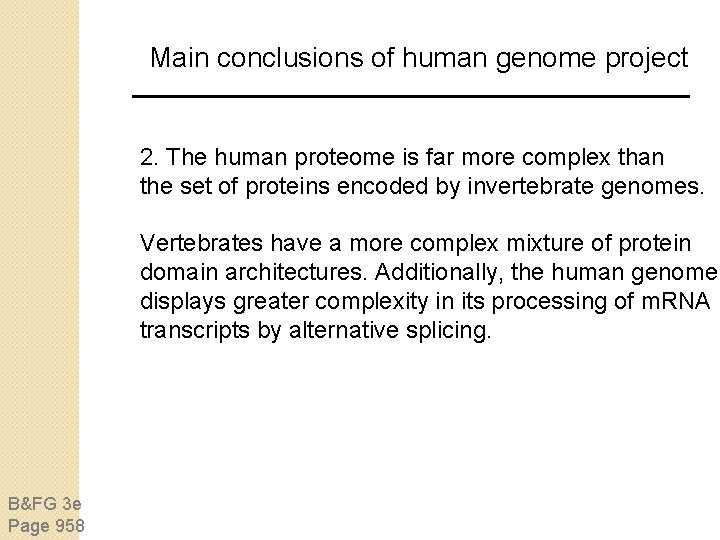
Main conclusions of human genome project 2. The human proteome is far more complex than the set of proteins encoded by invertebrate genomes. Vertebrates have a more complex mixture of protein domain architectures. Additionally, the human genome displays greater complexity in its processing of m. RNA transcripts by alternative splicing. B&FG 3 e Page 958
Main conclusions of human genome project 3. Hundreds of human genes were acquired from bacteria by lateral gene transfer, according to the initial report. Evidence: compare the proteomes of human, fly, worm, yeast, Arabidopsis, eukaryotic parasites, and all complete prokaryotic genomes. Find some genes shared exclusivel by humans and bacteria—but according to TIGR, only about 40 of these genes (or fewer? ) were acquired by LG Reasons for artifactually high estimates include: -- gene loss -- small sample size of species B&FG 3 e Page 958
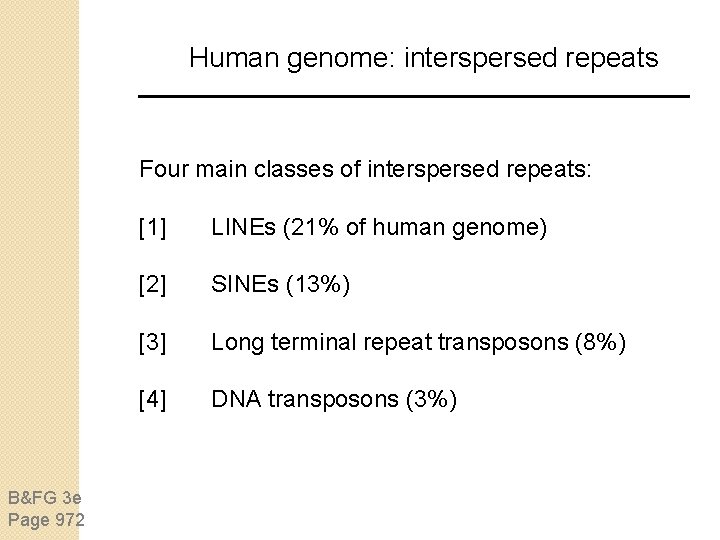
Main conclusions of human genome project 4. 98% of the genome does not code for genes >50% of the genome consists of repetitive DNA derived from transposable elements: LINEs (20%) SINEs (13%) LTR retrotransposons (8%) DNA transposons (3%) There has been a decline in activity of some of thes elements in the human lineage. B&FG 3 e Page 958
Main conclusions of human genome project 5. Segmental duplication is a frequent occurrence in the human genome. -- tandem duplications (rare) -- retrotransposition (intronless paralogs) -- segmental duplications (common) B&FG 3 e Page 958
Main conclusions of human genome project 6. There are >1 million Alu repeats in the human genome These are about 300 base pairs and contain an Alu. I restriction enzyme site. They occupy ~10% of the genome We saw an example of an Alu repeat in Chapter 16. Their distribution is non-random: they are retained in GC-rich regions and may confer some benefit. B&FG 3 e Page 959
Main conclusions of human genome project 7. The mutation rate is about twice as high in male meios than female meiosis. Most mutation probably occurs in males. B&FG 3 e Page 959
Main conclusions of human genome project 8. More than 1. 4 million single nucleotide polymorphisms (SNPs; single base pair changes) were identified. Celera initially identified 2. 1 million SNPs. Currently (2017), db. SNP at NCBI (build 150*) has about 324 million SNPs. An individual genome has about 3 -4 million SNPs. Fewer than 1% of SNPs alter protein sequence. B&FG 3 e Page 959 * See https: //www. ncbi. nlm. nih. gov/news/04 -11 -2017 human-snp-build-150/
Outline Introduction Main conclusions of human genome project Gateways to access the human genome Human Genome Project Background Strategic issues Human genome assemblies Broad genomic landscape Repeat content of human genome Gene content of human genome 25 human chromosomes Human genome variation Perspective
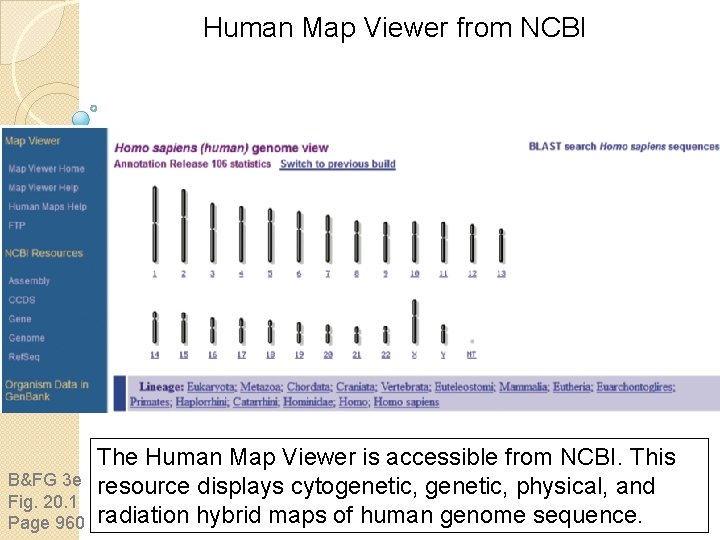
Three gateways to access the human genome NCBI map viewer www. ncbi. nlm. nih. gov Ensembl Project (EBI/Sanger Institute) www. ensembl. org UCSC (Golden Path) www. genome. ucsc. edu B&FG 3 e Page 959 Each of these three sites provides essential resources to study the human genome (and other genomes)
Human Map Viewer from NCBI B&FG 3 e Fig. 20. 1 Page 960 The Human Map Viewer is accessible from NCBI. This resource displays cytogenetic, physical, and radiation hybrid maps of human genome sequence.
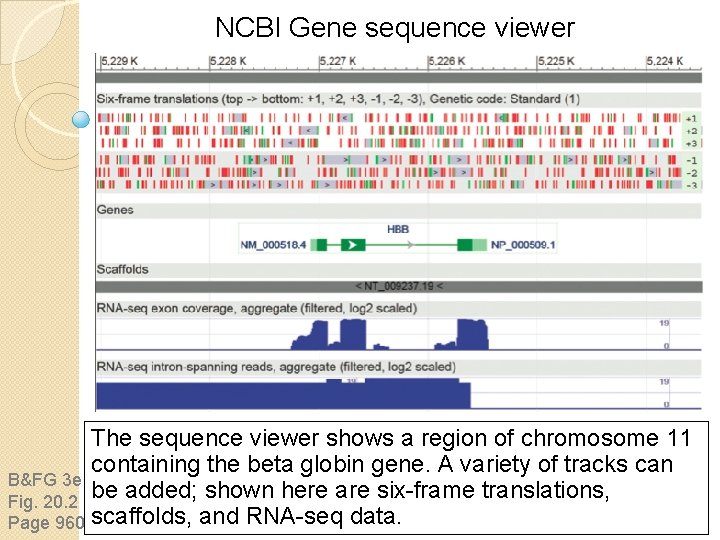
NCBI Gene sequence viewer The sequence viewer shows a region of chromosome 11 containing the beta globin gene. A variety of tracks can B&FG 3 e be added; shown here are six-frame translations, Fig. 20. 2 Page 960 scaffolds, and RNA-seq data.
Human genome statistics from Ensembl B&FG 3 e Table 20. 1 Page 961 Ensembl Release 75 Ensembl is a comprehensive, authoritative resource for information about the human genome as well as other genomes.
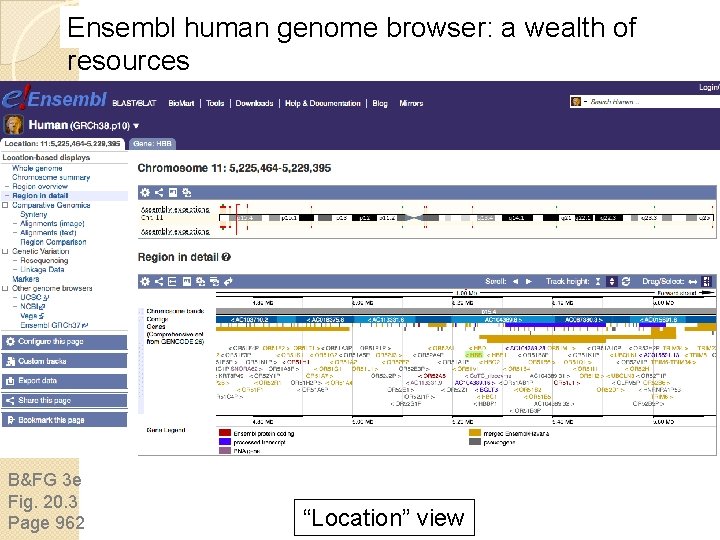
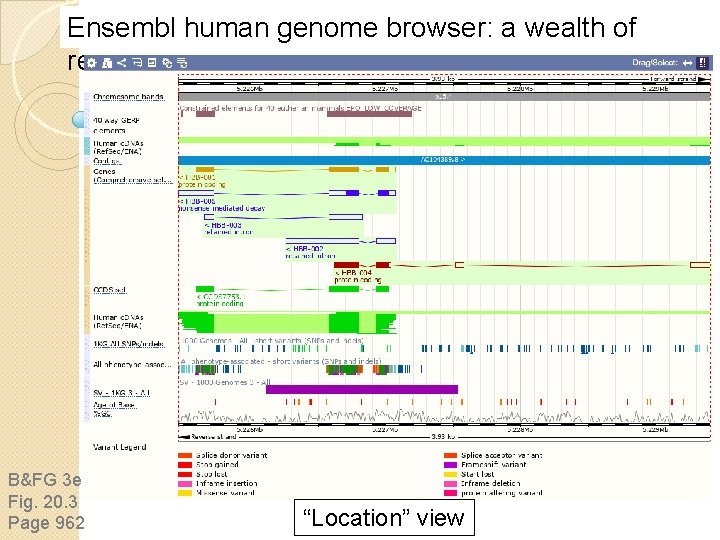
Ensembl human genome browser: a wealth of resources B&FG 3 e Fig. 20. 3 Page 962 “Location” view
Ensembl human genome browser: a wealth of resources B&FG 3 e Fig. 20. 3 Page 962 “Location” view
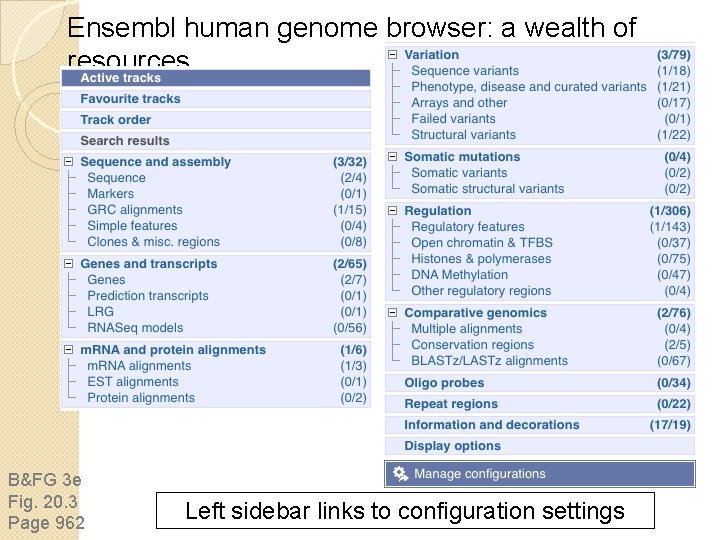
Ensembl human genome browser: a wealth of resources B&FG 3 e Fig. 20. 3 Page 962 Left sidebar links to configuration settings
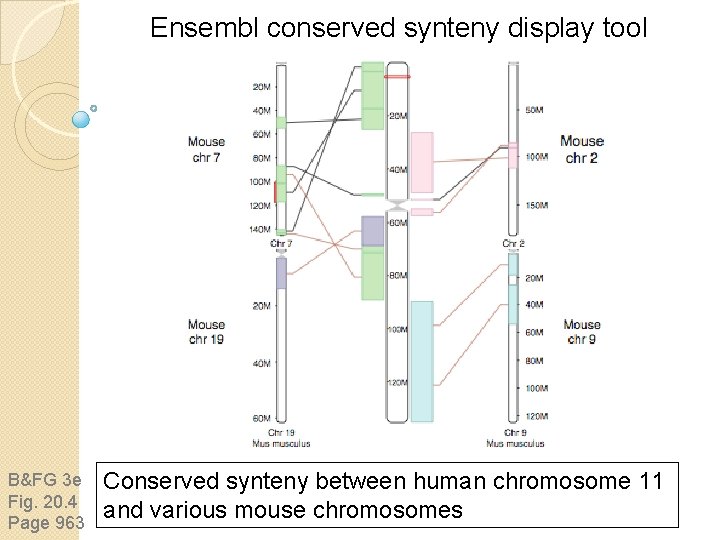
Ensembl conserved synteny display tool B&FG 3 e Fig. 20. 4 Page 963 Conserved synteny between human chromosome 11 and various mouse chromosomes
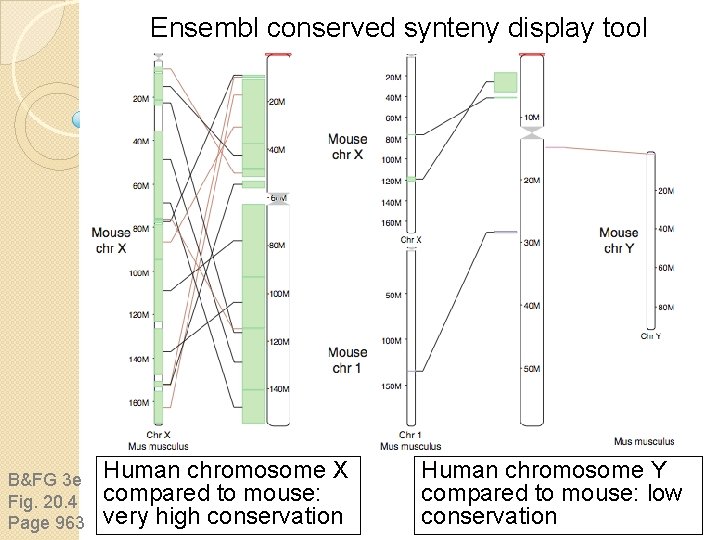
Ensembl conserved synteny display tool B&FG 3 e Fig. 20. 4 Page 963 Human chromosome X compared to mouse: very high conservation Human chromosome Y compared to mouse: low conservation
The UCSC human genome browser The University of California at Santa Cruz (UCSC) offers a genome browser with the “golden path” annotation of human genome. The browser features searches by keyword, gene name or other text searches. UCSC offers the lightning fast BLAT BLAST-like tool. A key feature of this browser is its customizable annotat tracks. About half of these tracks are offered by users o the site throughout the world. B&FG 3 e Page 961 Visit http: //genome. ucsc. edu
Outline Introduction Main conclusions of human genome project Gateways to access the human genome Human Genome Project Background Strategic issues Human genome assemblies Broad genomic landscape Repeat content of human genome Gene content of human genome 25 human chromosomes Human genome variation Perspective
Background of the human genome project The Human Genome Project (HGP) was first proposed by the U. S. National Research Council in 1988. The goal were to create genetic, physical, and sequence maps of the human genome. In parallel, genomes of model organisms were to be studied. (You can read this report on-line via http: //www. nap. edu) B&FG 3 e Page 964
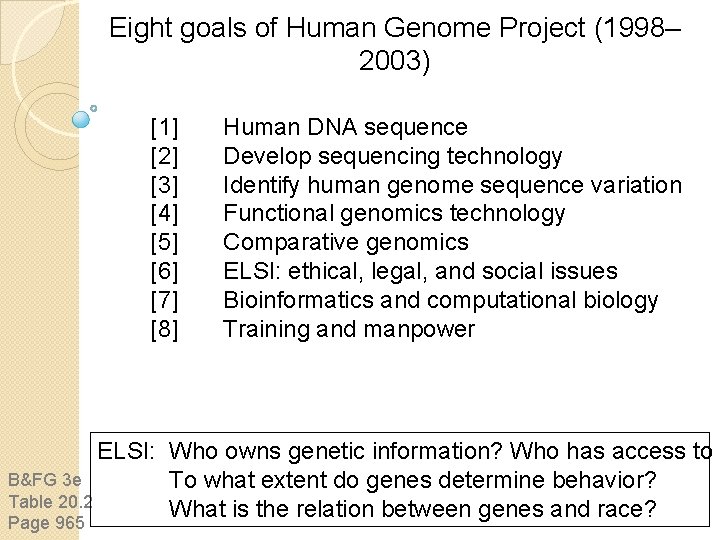
Eight goals of Human Genome Project (1998– 2003) [1] [2] [3] [4] [5] [6] [7] [8] Human DNA sequence Develop sequencing technology Identify human genome sequence variation Functional genomics technology Comparative genomics ELSI: ethical, legal, and social issues Bioinformatics and computational biology Training and manpower ELSI: Who owns genetic information? Who has access to i B&FG 3 e To what extent do genes determine behavior? Table 20. 2 What is the relation between genes and race? Page 965
Outline Introduction Main conclusions of human genome project Gateways to access the human genome Human Genome Project Background Strategic issues Human genome assemblies Broad genomic landscape Repeat content of human genome Gene content of human genome 25 human chromosomes Human genome variation Perspective
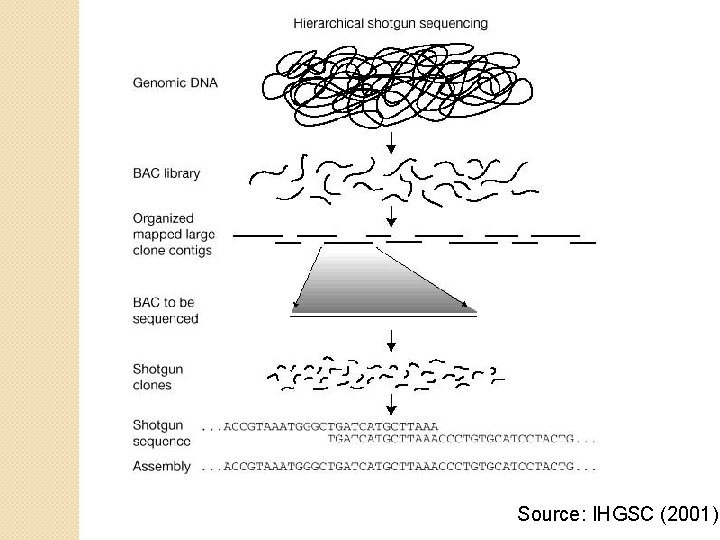
Strategic issues: Hierarchical / shotgun sequencing The human genome was sequenced in parallel by a public consortium (IHGSC) and by Celera Genomics. These groups applied alternative sequencing strategies B&FG 3 e Page 966
Outline Introduction Main conclusions of human genome project Gateways to access the human genome Human Genome Project Background Strategic issues Human genome assemblies Broad genomic landscape Repeat content of human genome Gene content of human genome 25 human chromosomes Human genome variation Perspective
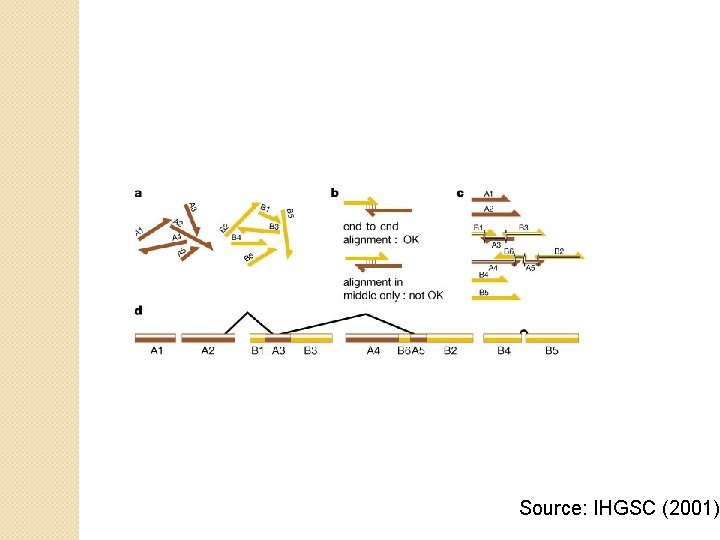
Human genome project: strategies Whole genome shotgun sequencing (Celera) -- Given the computational capacity, this approach is far faster than hierarchical shotgun sequencing -- The approach was validated using Drosophila Hierarchical shotgun sequencing (public consortium) -- 29, 000 BAC clones -- 4. 3 billion base pairs -- It is helpful to assign chromosomal loci to sequenced fragments, especially in light of the large amount of repetitive DNA in the genome -- Individual chromosomes assigned to centers
Source: IHGSC (2001)
Source: IHGSC (2001)
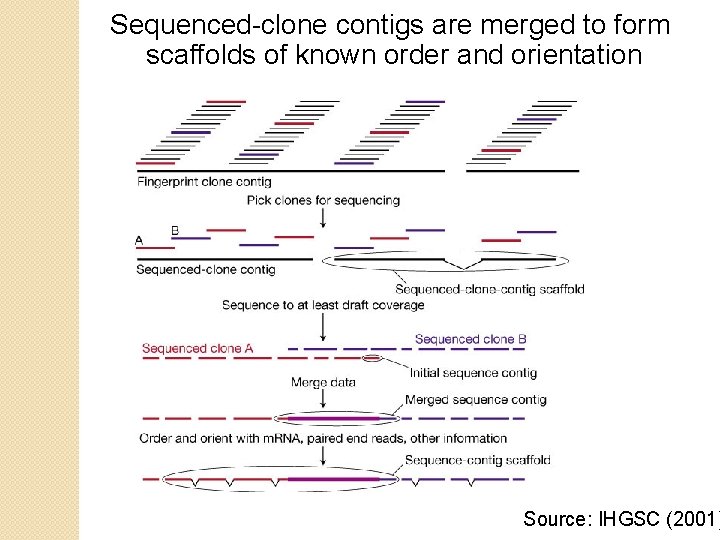
Sequenced-clone contigs are merged to form scaffolds of known order and orientation Source: IHGSC (2001)
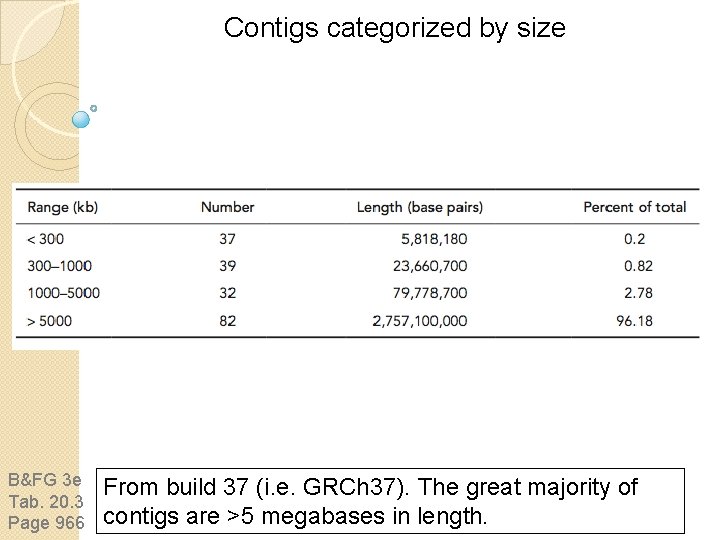
Contigs categorized by size B&FG 3 e Tab. 20. 3 Page 966 From build 37 (i. e. GRCh 37). The great majority of contigs are >5 megabases in length.
Genome Reference Consortium (GRC) • The Genome Reference Consortium (GRC) is responsible for coordinating new assemblies for human, mouse, and zebrafish genomes. • Every few years a new genome assembly is released. • The current human assembly is Genome Reference Consortium Human Build 38 (abbreviated GRCh 38). • Each new genome build must be annotated (a very complex process) and this is a main reason that GRCh 37 (sometimes called hg 19) has remained more popular than GRCh 38. • Investigators must choose which build to use for a variety of applications. B&FG 3 e Page 967
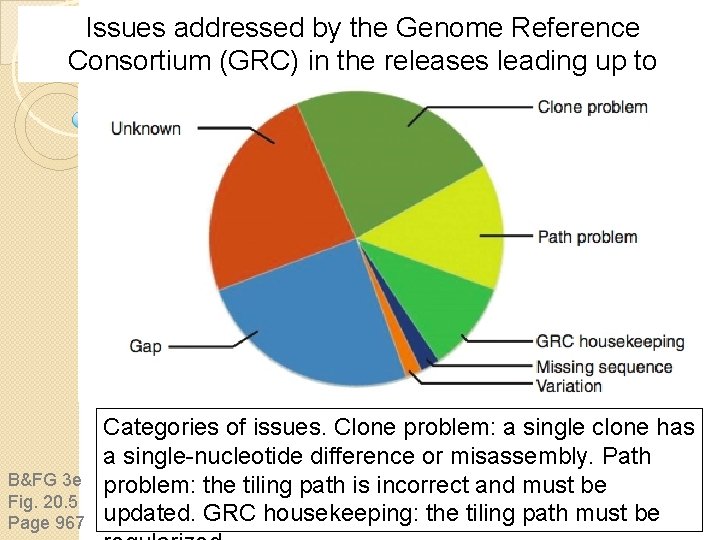
Issues addressed by the Genome Reference Consortium (GRC) in the releases leading up to GRCh 38 (Dec. 2013) B&FG 3 e Fig. 20. 5 Page 967 Categories of issues. Clone problem: a single clone has a single-nucleotide difference or misassembly. Path problem: the tiling path is incorrect and must be updated. GRC housekeeping: the tiling path must be
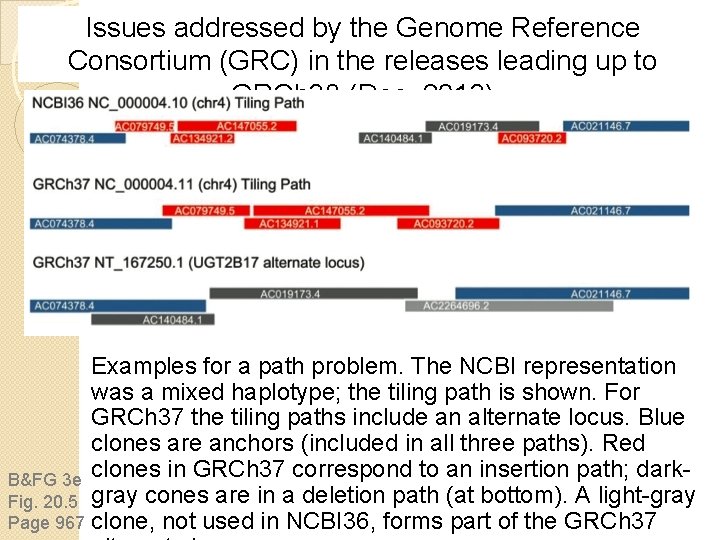
Issues addressed by the Genome Reference Consortium (GRC) in the releases leading up to GRCh 38 (Dec. 2013) Examples for a path problem. The NCBI representation was a mixed haplotype; the tiling path is shown. For GRCh 37 the tiling paths include an alternate locus. Blue clones are anchors (included in all three paths). Red B&FG 3 e clones in GRCh 37 correspond to an insertion path; dark. Fig. 20. 5 gray cones are in a deletion path (at bottom). A light-gray Page 967 clone, not used in NCBI 36, forms part of the GRCh 37
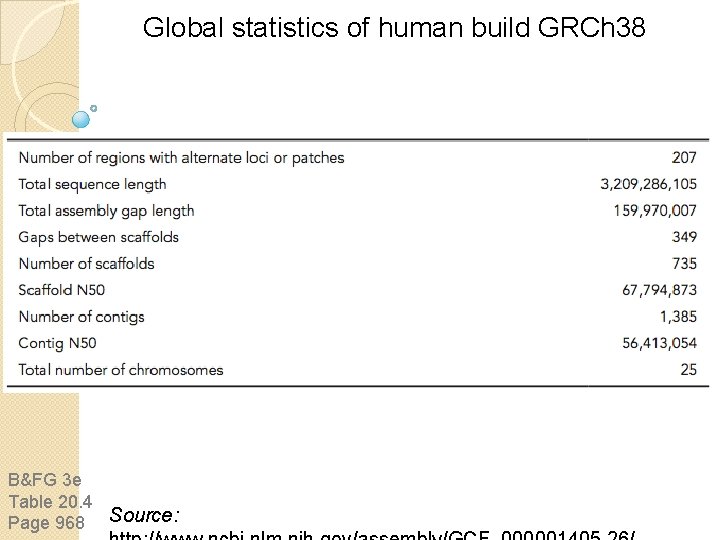
Global statistics of human build GRCh 38 B&FG 3 e Table 20. 4 Page 968 Source:
Features of the genome sequence The genome sequence (in 2001) included a mixture of finished, draft, and pre-draft data. The N 50 length describes the largest length L such that 50% of all nucleotides are contained in contigs or scaffolds of at least size L. For the 2001 version of the human genome, N 50 is at least 8. 4 Mb. B&FG 3 e Page 968
Features of the genome sequence The quality of genome sequence is assessed by countin the number of gaps and by measuring the nucleotide accuracy. About 91% of the unfinished draft sequence had an error rate less than 1 per 10, 000 bases. This corresponds to a PHRAP score >40 (i. e. an error probability of 10 -40/10, or 99. 99% accuracy).
Outline Introduction Main conclusions of human genome project Gateways to access the human genome Human Genome Project Background Strategic issues Human genome assemblies Broad genomic landscape Repeat content of human genome Gene content of human genome 25 human chromosomes Human genome variation Perspective
Broad genomic landscape The broad genomic landscape includes the following feature • Long-range variation in GC content • Cp. G islands • Comparison of genetic and physical distance • The repeat content of the human genome • The protein-coding gene content of the human genome • Non-coding genes B&FG 3 e Page 968
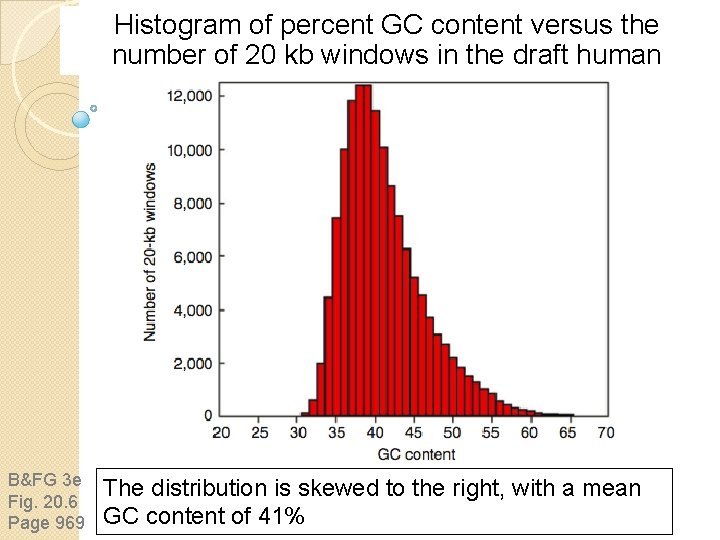
Broad genomic landscape: GC content The overall GC content of the human genome is 41%. A plot of GC content versus number of 20 kb windows shows a broad profile with skewing to the right. B&FG 3 e Page 969
Histogram of percent GC content versus the number of 20 kb windows in the draft human genome sequence B&FG 3 e Fig. 20. 6 Page 969 The distribution is skewed to the right, with a mean GC content of 41%
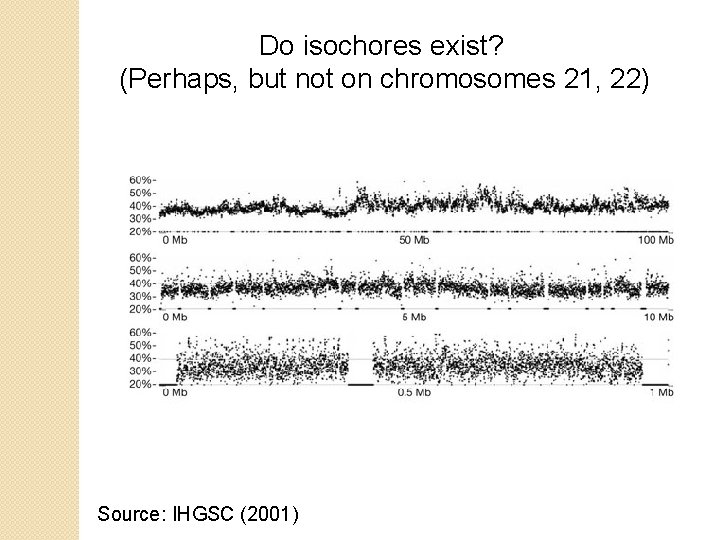
Broad genomic landscape: GC content Some genomic regions are GC-rich, while some are GC-poor. Giorgio Bernardi and colleagues described “isochores” which are large DNA segments (e. g. >300 kb) that are fairly homogeneous compositionally and can be divided into GC-rich and GC-poor subtypes. B&FG 3 e Page 969
Do isochores exist? (Perhaps, but not on chromosomes 21, 22) Source: IHGSC (2001)
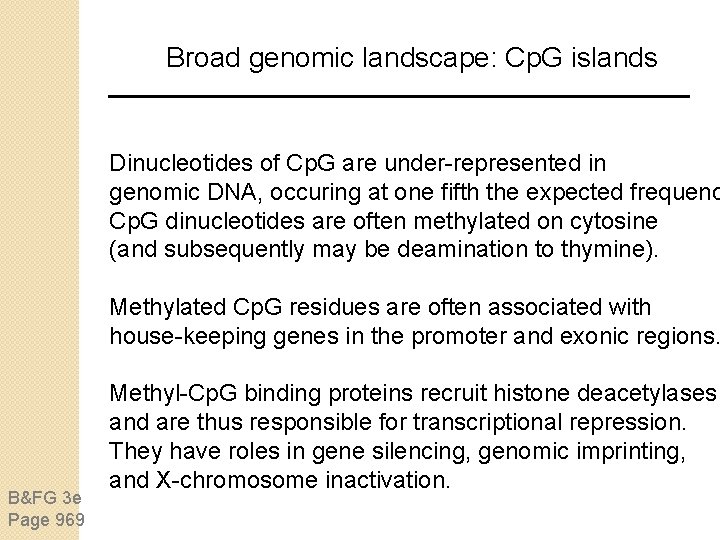
Broad genomic landscape: Cp. G islands Dinucleotides of Cp. G are under-represented in genomic DNA, occuring at one fifth the expected frequenc Cp. G dinucleotides are often methylated on cytosine (and subsequently may be deamination to thymine). Methylated Cp. G residues are often associated with house-keeping genes in the promoter and exonic regions. B&FG 3 e Page 969 Methyl-Cp. G binding proteins recruit histone deacetylases and are thus responsible for transcriptional repression. They have roles in gene silencing, genomic imprinting, and X-chromosome inactivation.
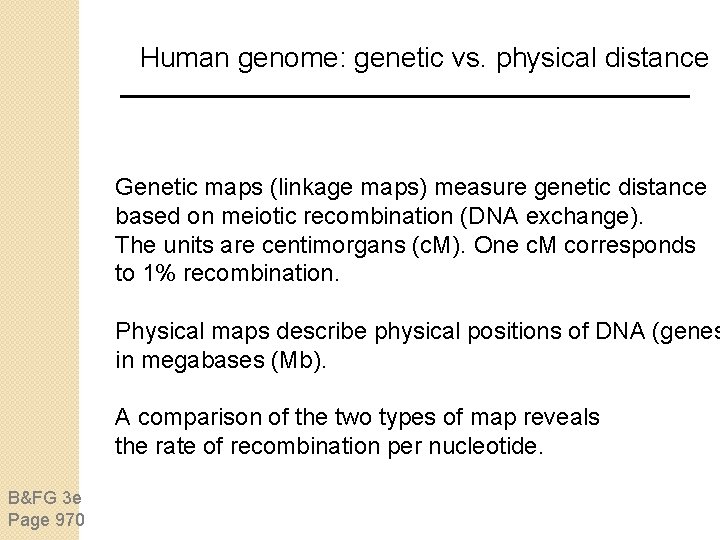
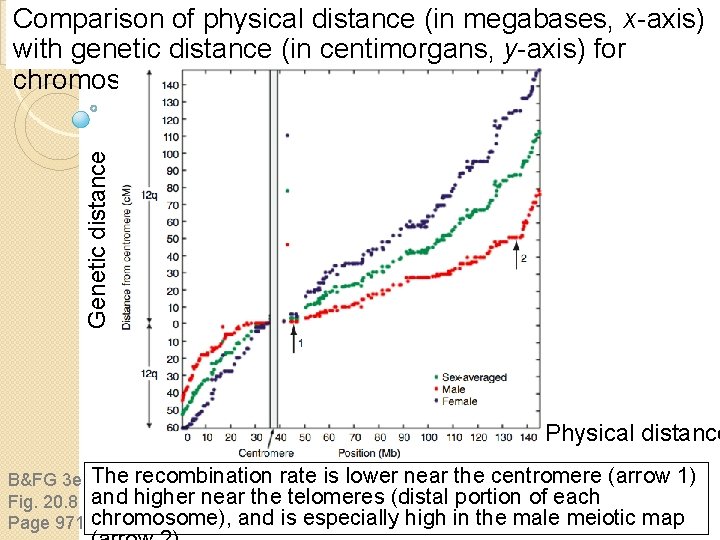
Human genome: genetic vs. physical distance Genetic maps (linkage maps) measure genetic distance based on meiotic recombination (DNA exchange). The units are centimorgans (c. M). One c. M corresponds to 1% recombination. Physical maps describe physical positions of DNA (genes in megabases (Mb). A comparison of the two types of map reveals the rate of recombination per nucleotide. B&FG 3 e Page 970
Genetic distance Comparison of physical distance (in megabases, x-axis) with genetic distance (in centimorgans, y-axis) for chromosome 12 Physical distance B&FG 3 e Fig. 20. 8 Page 971 The recombination rate is lower near the centromere (arrow 1) and higher near the telomeres (distal portion of each chromosome), and is especially high in the male meiotic map
Outline Introduction Main conclusions of human genome project Gateways to access the human genome Human Genome Project Background Strategic issues Human genome assemblies Broad genomic landscape Repeat content of human genome Gene content of human genome 25 human chromosomes Human genome variation Perspective
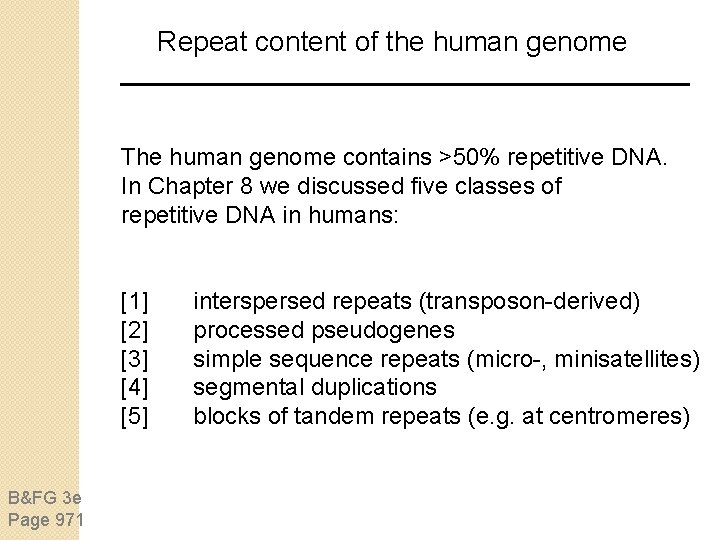
Repeat content of the human genome The human genome contains >50% repetitive DNA. In Chapter 8 we discussed five classes of repetitive DNA in humans: [1] [2] [3] [4] [5] B&FG 3 e Page 971 interspersed repeats (transposon-derived) processed pseudogenes simple sequence repeats (micro-, minisatellites) segmental duplications blocks of tandem repeats (e. g. at centromeres)
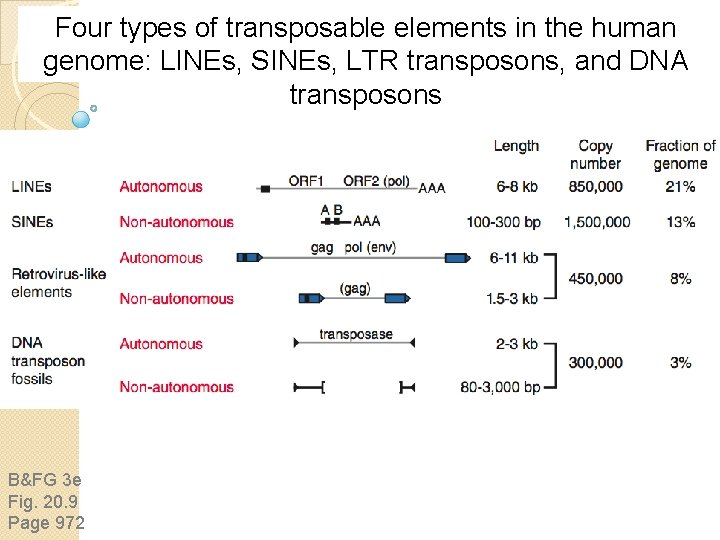
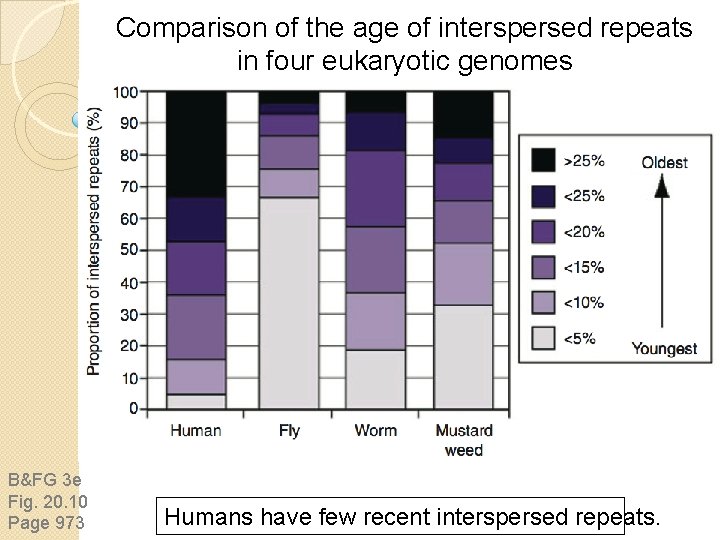
Human genome: interspersed repeats Four main classes of interspersed repeats: B&FG 3 e Page 972 [1] LINEs (21% of human genome) [2] SINEs (13%) [3] Long terminal repeat transposons (8%) [4] DNA transposons (3%)
Four types of transposable elements in the human genome: LINEs, SINEs, LTR transposons, and DNA transposons B&FG 3 e Fig. 20. 9 Page 972
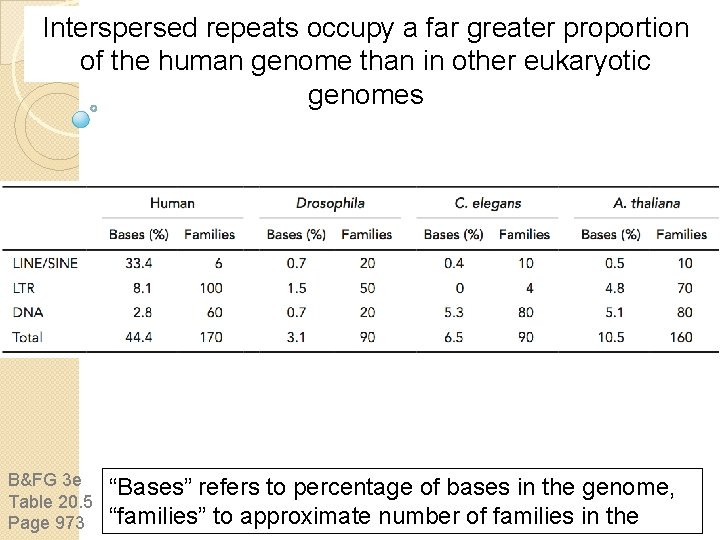
Interspersed repeats occupy a far greater proportion of the human genome than in other eukaryotic genomes B&FG 3 e Table 20. 5 Page 973 “Bases” refers to percentage of bases in the genome, “families” to approximate number of families in the
Comparison of the age of interspersed repeats in four eukaryotic genomes B&FG 3 e Fig. 20. 10 Page 973 Humans have few recent interspersed repeats.
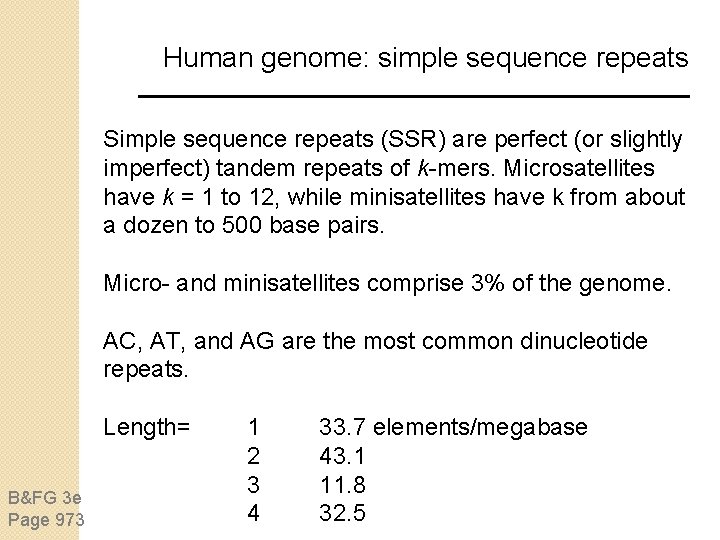
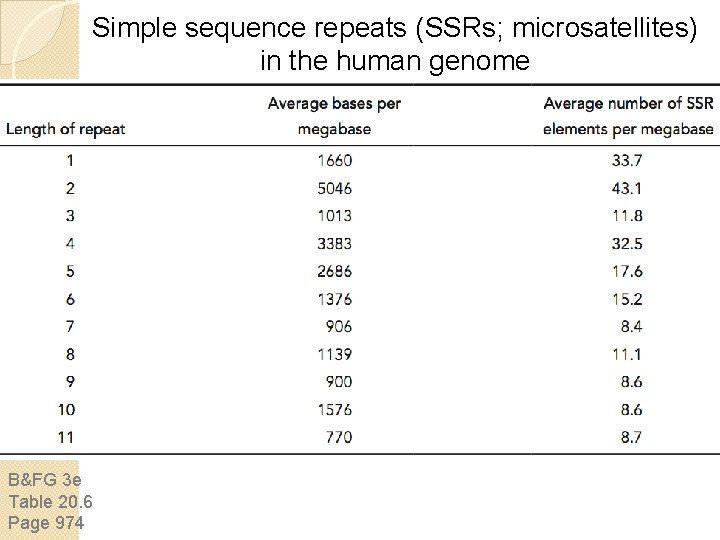
Human genome: simple sequence repeats Simple sequence repeats (SSR) are perfect (or slightly imperfect) tandem repeats of k-mers. Microsatellites have k = 1 to 12, while minisatellites have k from about a dozen to 500 base pairs. Micro- and minisatellites comprise 3% of the genome. AC, AT, and AG are the most common dinucleotide repeats. Length= B&FG 3 e Page 973 1 2 3 4 33. 7 elements/megabase 43. 1 11. 8 32. 5
Simple sequence repeats (SSRs; microsatellites) in the human genome B&FG 3 e Table 20. 6 Page 974
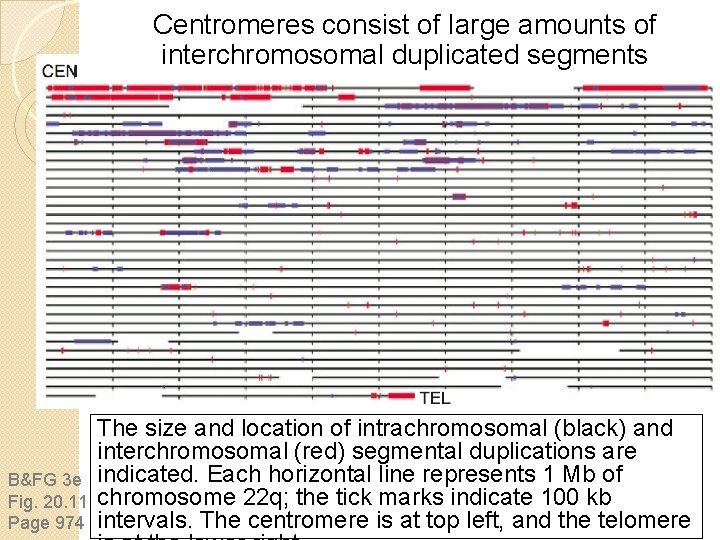
Human genome: segmental duplications About 5% of the finished human genome sequence consists of segmental duplications, typically 10 -50 kb. Centromeres contain particularly large amounts of interchromosomally duplicated DNA. B&FG 3 e Page 973
Centromeres consist of large amounts of interchromosomal duplicated segments B&FG 3 e Fig. 20. 11 Page 974 The size and location of intrachromosomal (black) and interchromosomal (red) segmental duplications are indicated. Each horizontal line represents 1 Mb of chromosome 22 q; the tick marks indicate 100 kb intervals. The centromere is at top left, and the telomere
Outline Introduction Main conclusions of human genome project Gateways to access the human genome Human Genome Project Background Strategic issues Human genome assemblies Broad genomic landscape Repeat content of human genome Gene content of human genome 25 human chromosomes Human genome variation Perspective
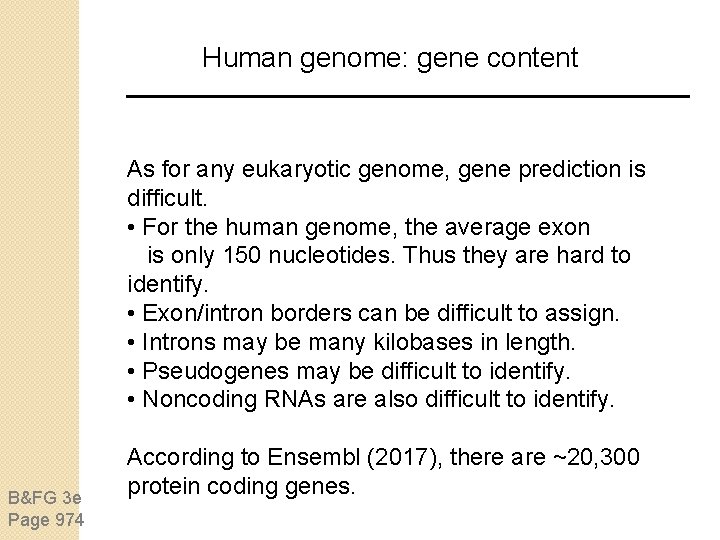
Human genome: gene content As for any eukaryotic genome, gene prediction is difficult. • For the human genome, the average exon is only 150 nucleotides. Thus they are hard to identify. • Exon/intron borders can be difficult to assign. • Introns may be many kilobases in length. • Pseudogenes may be difficult to identify. • Noncoding RNAs are also difficult to identify. B&FG 3 e Page 974 According to Ensembl (2017), there are ~20, 300 protein coding genes.
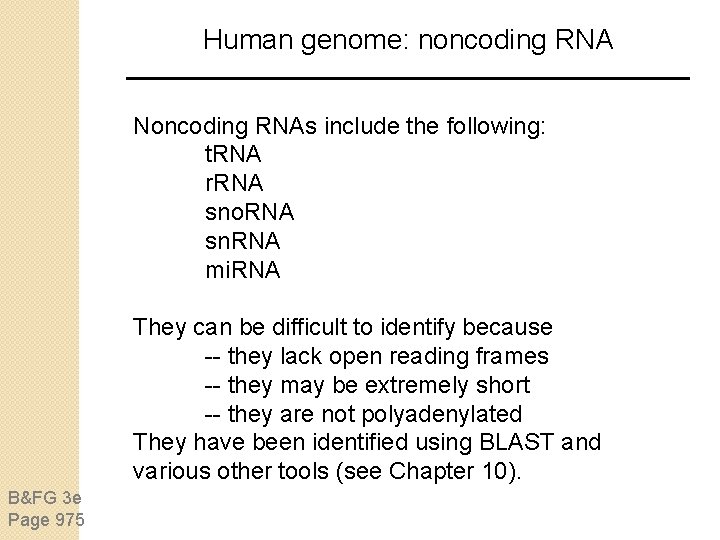
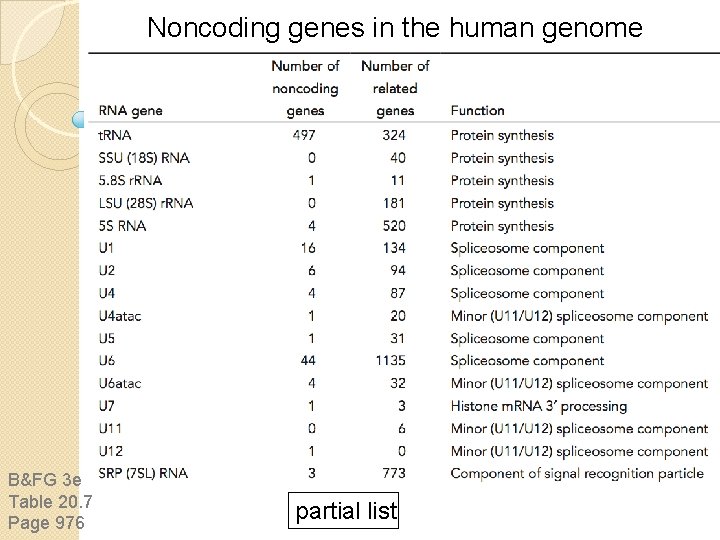
Human genome: noncoding RNA Noncoding RNAs include the following: t. RNA r. RNA sno. RNA sn. RNA mi. RNA They can be difficult to identify because -- they lack open reading frames -- they may be extremely short -- they are not polyadenylated They have been identified using BLAST and various other tools (see Chapter 10). B&FG 3 e Page 975
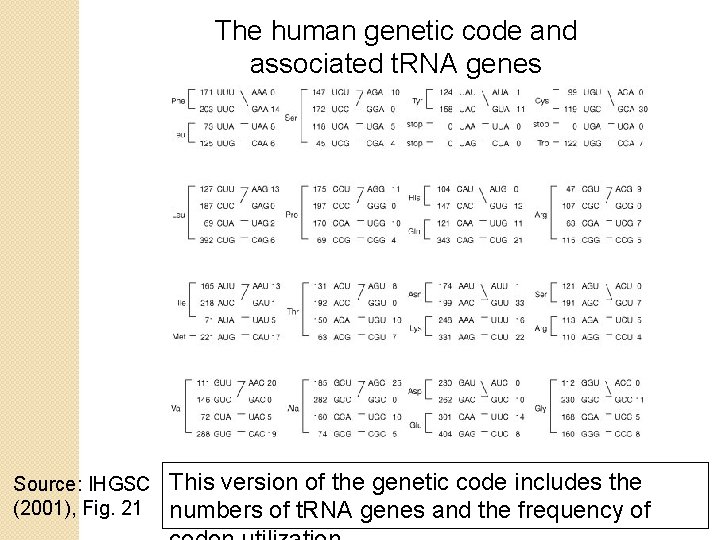
The human genetic code and associated t. RNA genes Source: IHGSC (2001), Fig. 21 This version of the genetic code includes the numbers of t. RNA genes and the frequency of
Noncoding genes in the human genome B&FG 3 e Table 20. 7 Page 976 partial list
Outline Introduction Main conclusions of human genome project Gateways to access the human genome Human Genome Project Background Strategic issues Human genome assemblies Broad genomic landscape Repeat content of human genome Gene content of human genome 25 human chromosomes Human genome variation Perspective
Human genome: protein coding genes When Ref. Seq genes (manually curated) were compared to the draft human genome sequence, 92% could be aligned at high stringency over part of their length, and 85% could be aligned at > half their length. Some Ref. Seq genes had high stringency matches to multiple genomic locations. This could be due to paralogs pseudogenes, or misassembly of the genome sequence.
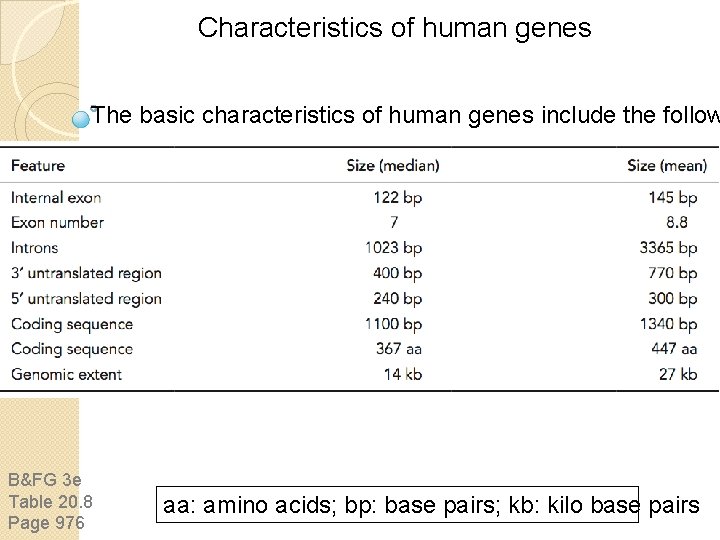
Characteristics of human genes The basic characteristics of human genes include the follow B&FG 3 e Table 20. 8 Page 976 aa: amino acids; bp: base pairs; kb: kilo base pairs
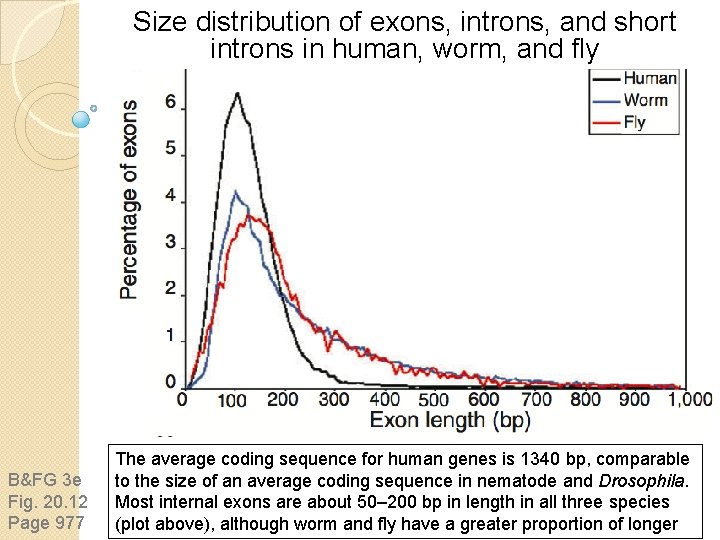
Size distribution of exons, introns, and short introns in human, worm, and fly B&FG 3 e Fig. 20. 12 Page 977 The average coding sequence for human genes is 1340 bp, comparable to the size of an average coding sequence in nematode and Drosophila. Most internal exons are about 50– 200 bp in length in all three species (plot above), although worm and fly have a greater proportion of longer
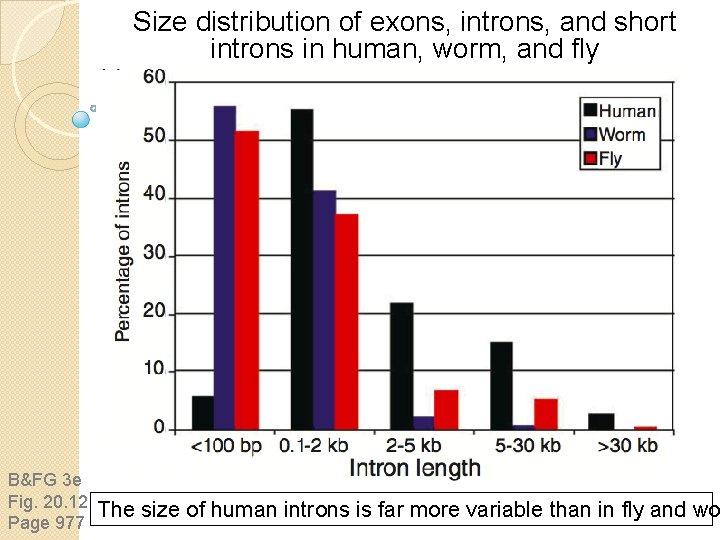
Size distribution of exons, introns, and short introns in human, worm, and fly B&FG 3 e Fig. 20. 12 Page 977 The size of human introns is far more variable than in fly and wo
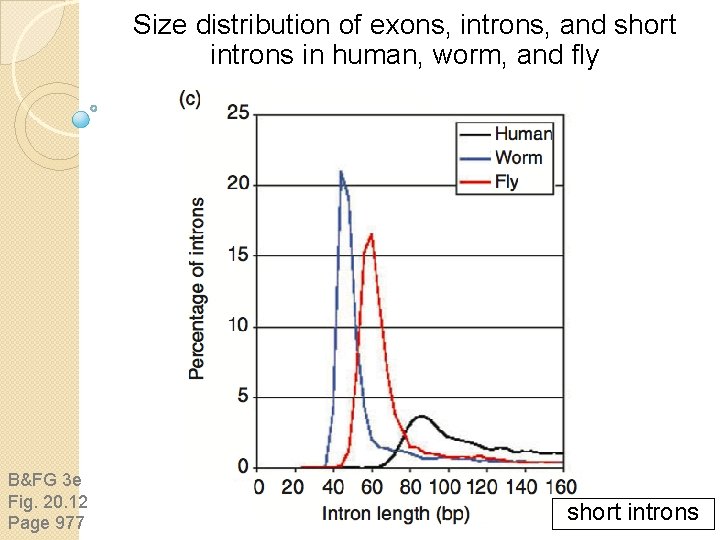
Size distribution of exons, introns, and short introns in human, worm, and fly B&FG 3 e Fig. 20. 12 Page 977 short introns
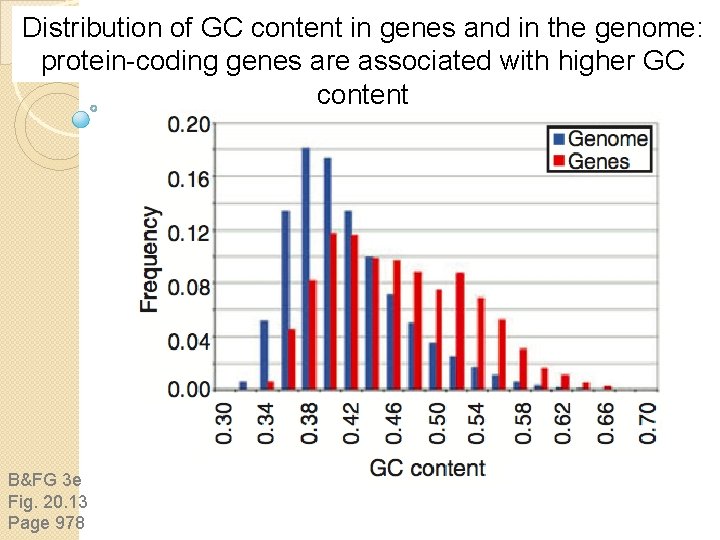
Distribution of GC content in genes and in the genome: protein-coding genes are associated with higher GC content B&FG 3 e Fig. 20. 13 Page 978
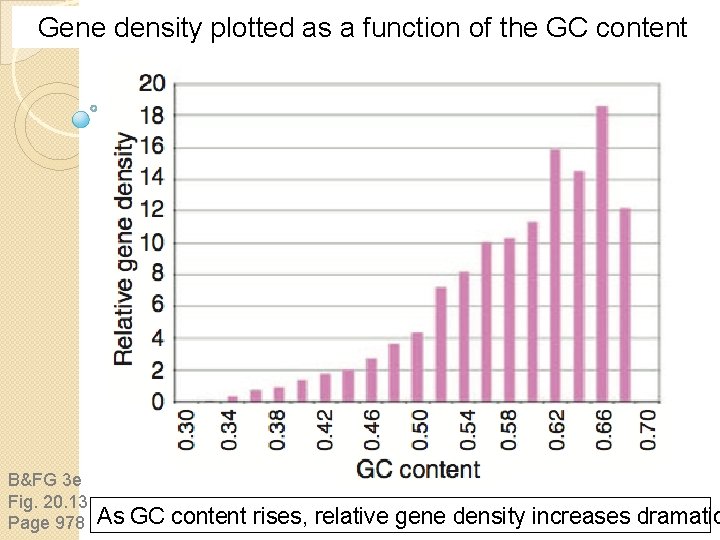
Gene density plotted as a function of the GC content B&FG 3 e Fig. 20. 13 Page 978 As GC content rises, relative gene density increases dramatic
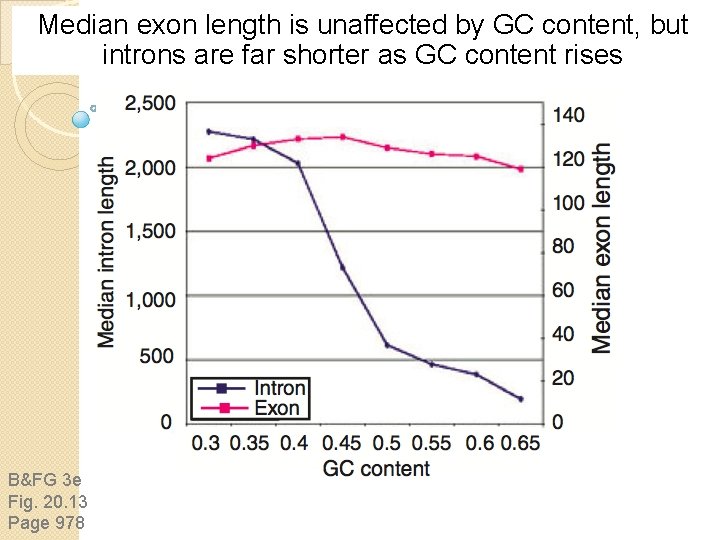
Median exon length is unaffected by GC content, but introns are far shorter as GC content rises B&FG 3 e Fig. 20. 13 Page 978
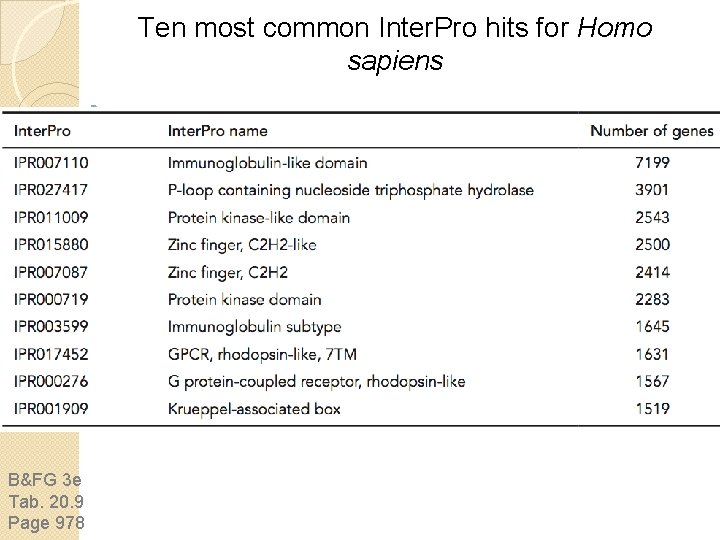
The human proteome The number of protein-coding genes in humans is comparable to the number of genes in other metazoans and plants and only three-fold greater than the number in unicellular fungi. While humans do not have more protein-coding (or noncoding) genes than other “lower” organisms, the human proteome may be more complex. B&FG 3 e Page 978
Ten most common Inter. Pro hits for Homo sapiens B&FG 3 e Tab. 20. 9 Page 978
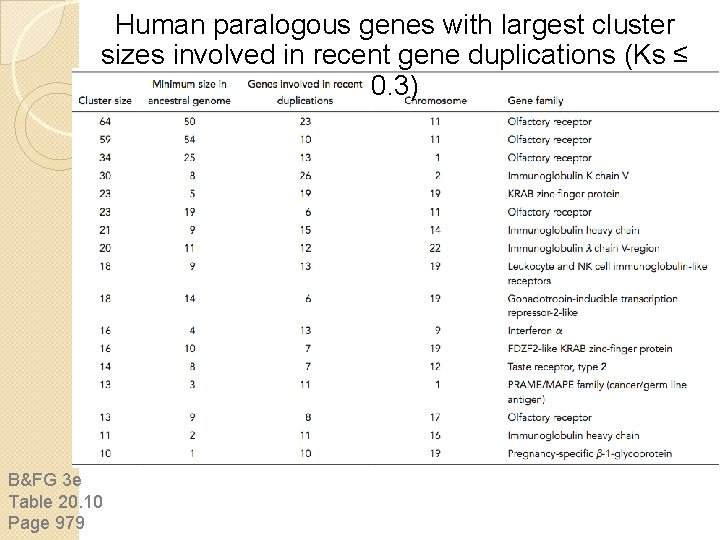
Human paralogous genes with largest cluster sizes involved in recent gene duplications (Ks ≤ 0. 3) B&FG 3 e Table 20. 10 Page 979
Outline Introduction Main conclusions of human genome project Gateways to access the human genome Human Genome Project Background Strategic issues Human genome assemblies Broad genomic landscape Repeat content of human genome Gene content of human genome 25 human chromosomes Human genome variation Perspective
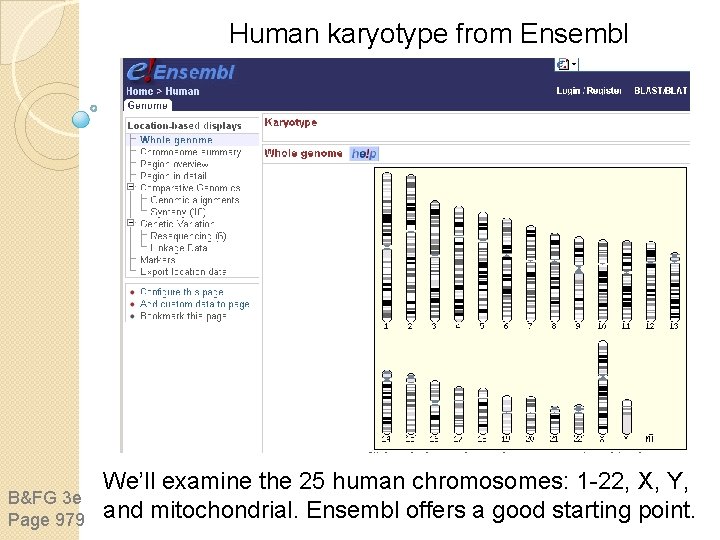
Human karyotype from Ensembl B&FG 3 e Page 979 We’ll examine the 25 human chromosomes: 1 -22, X, Y, and mitochondrial. Ensembl offers a good starting point.
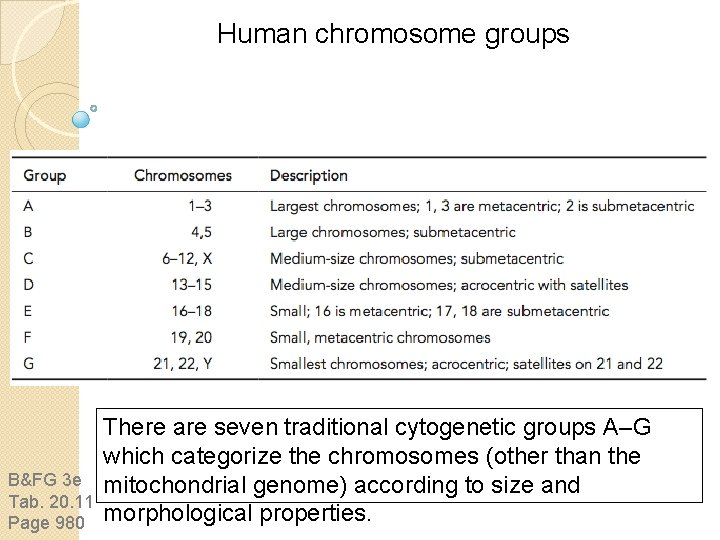
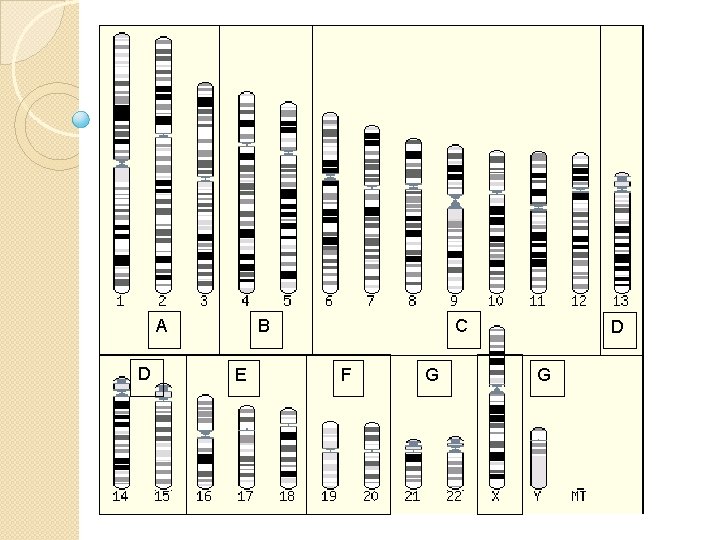
Human chromosome groups B&FG 3 e Tab. 20. 11 Page 980 There are seven traditional cytogenetic groups A–G which categorize the chromosomes (other than the mitochondrial genome) according to size and morphological properties.
A D B E C F G D G
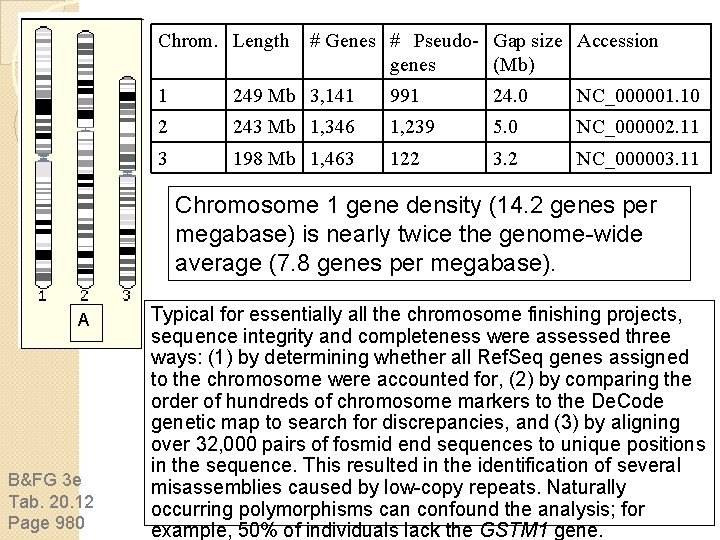
Chrom. Length # Genes # Pseudo- Gap size Accession genes (Mb) 1 249 Mb 3, 141 991 24. 0 NC_000001. 10 2 243 Mb 1, 346 1, 239 5. 0 NC_000002. 11 3 198 Mb 1, 463 122 3. 2 NC_000003. 11 Chromosome 1 gene density (14. 2 genes per megabase) is nearly twice the genome-wide average (7. 8 genes per megabase). A B&FG 3 e Tab. 20. 12 Page 980 Typical for essentially all the chromosome finishing projects, sequence integrity and completeness were assessed three ways: (1) by determining whether all Ref. Seq genes assigned to the chromosome were accounted for, (2) by comparing the order of hundreds of chromosome markers to the De. Code genetic map to search for discrepancies, and (3) by aligning over 32, 000 pairs of fosmid end sequences to unique positions in the sequence. This resulted in the identification of several misassemblies caused by low-copy repeats. Naturally occurring polymorphisms can confound the analysis; for example, 50% of individuals lack the GSTM 1 gene.
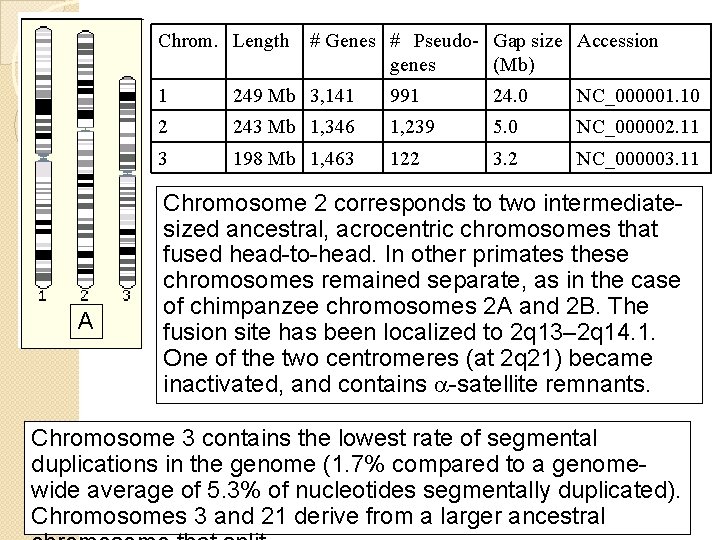
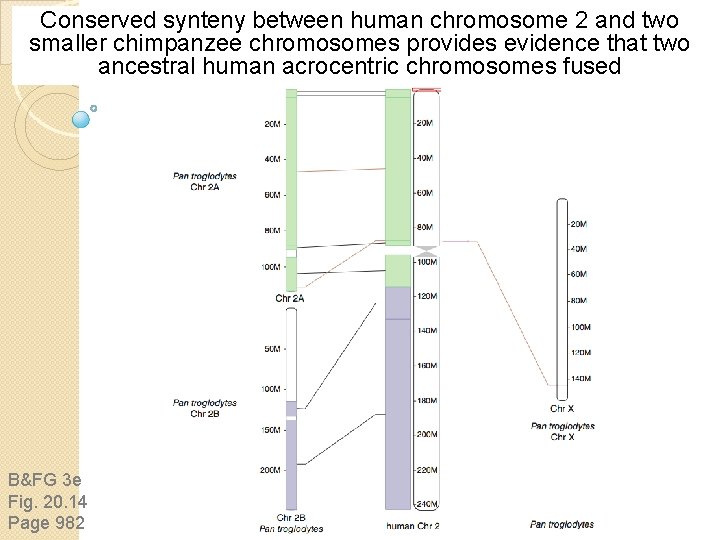
Chrom. Length A # Genes # Pseudo- Gap size Accession genes (Mb) 1 249 Mb 3, 141 991 24. 0 NC_000001. 10 2 243 Mb 1, 346 1, 239 5. 0 NC_000002. 11 3 198 Mb 1, 463 122 3. 2 NC_000003. 11 Chromosome 2 corresponds to two intermediatesized ancestral, acrocentric chromosomes that fused head-to-head. In other primates these chromosomes remained separate, as in the case of chimpanzee chromosomes 2 A and 2 B. The fusion site has been localized to 2 q 13– 2 q 14. 1. One of the two centromeres (at 2 q 21) became inactivated, and contains a-satellite remnants. Chromosome 3 contains the lowest rate of segmental duplications in the genome (1. 7% compared to a genomewide average of 5. 3% of nucleotides segmentally duplicated). Chromosomes 3 and 21 derive from a larger ancestral
Conserved synteny between human chromosome 2 and two smaller chimpanzee chromosomes provides evidence that two ancestral human acrocentric chromosomes fused B&FG 3 e Fig. 20. 14 Page 982
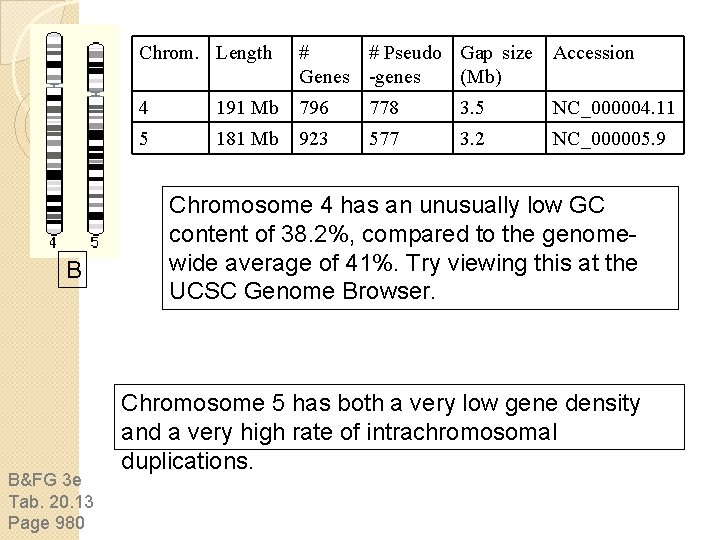
B B&FG 3 e Tab. 20. 13 Page 980 Chrom. Length # # Pseudo Gap size Accession Genes -genes (Mb) 4 191 Mb 796 778 3. 5 NC_000004. 11 5 181 Mb 923 577 3. 2 NC_000005. 9 Chromosome 4 has an unusually low GC content of 38. 2%, compared to the genomewide average of 41%. Try viewing this at the UCSC Genome Browser. Chromosome 5 has both a very low gene density and a very high rate of intrachromosomal duplications.
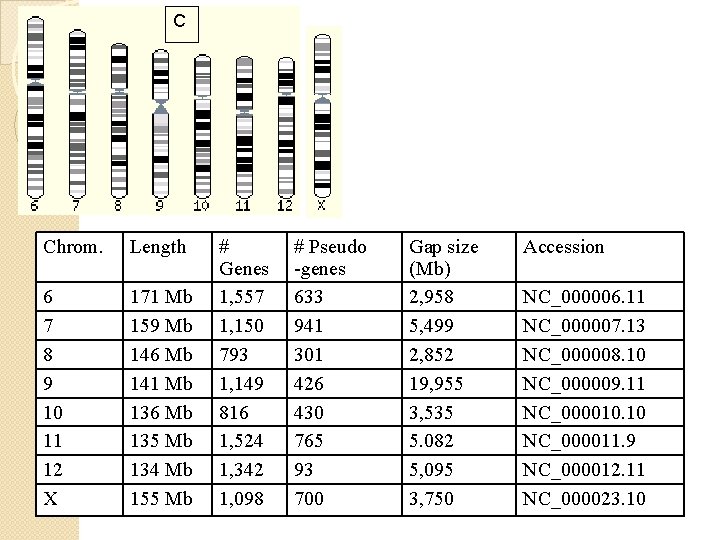
C Chrom. Length 6 7 8 9 10 11 12 X 171 Mb 159 Mb 146 Mb 141 Mb 136 Mb 135 Mb 134 Mb 155 Mb # Genes 1, 557 1, 150 793 1, 149 816 1, 524 1, 342 1, 098 # Pseudo -genes 633 941 301 426 430 765 93 700 Gap size (Mb) 2, 958 5, 499 2, 852 19, 955 3, 535 5. 082 5, 095 3, 750 Accession NC_000006. 11 NC_000007. 13 NC_000008. 10 NC_000009. 11 NC_000010. 10 NC_000011. 9 NC_000012. 11 NC_000023. 10
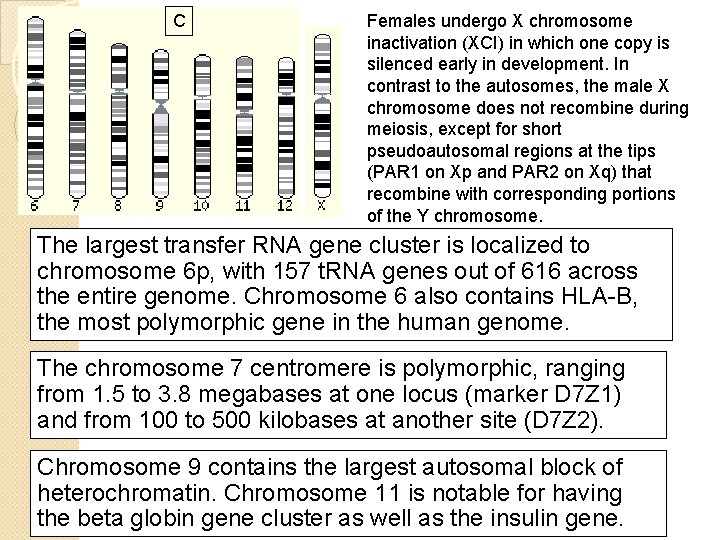
C Females undergo X chromosome inactivation (XCI) in which one copy is silenced early in development. In contrast to the autosomes, the male X chromosome does not recombine during meiosis, except for short pseudoautosomal regions at the tips (PAR 1 on Xp and PAR 2 on Xq) that recombine with corresponding portions of the Y chromosome. The largest transfer RNA gene cluster is localized to chromosome 6 p, with 157 t. RNA genes out of 616 across the entire genome. Chromosome 6 also contains HLA-B, the most polymorphic gene in the human genome. The chromosome 7 centromere is polymorphic, ranging from 1. 5 to 3. 8 megabases at one locus (marker D 7 Z 1) and from 100 to 500 kilobases at another site (D 7 Z 2). Chromosome 9 contains the largest autosomal block of heterochromatin. Chromosome 11 is notable for having the beta globin gene cluster as well as the insulin gene.
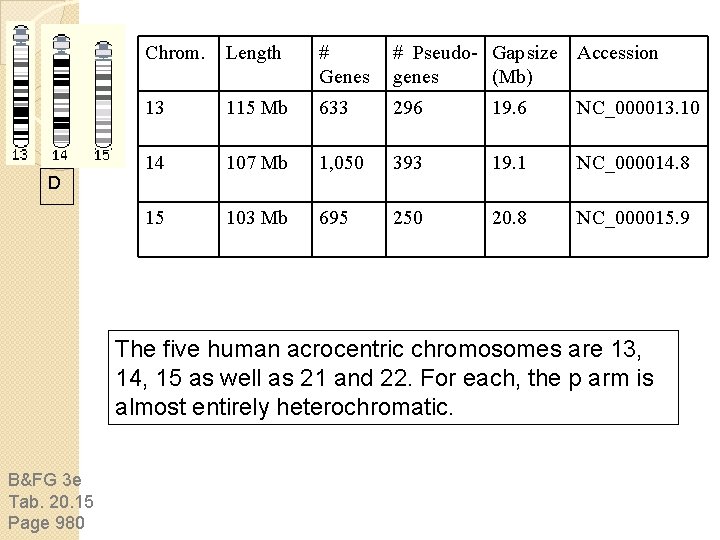
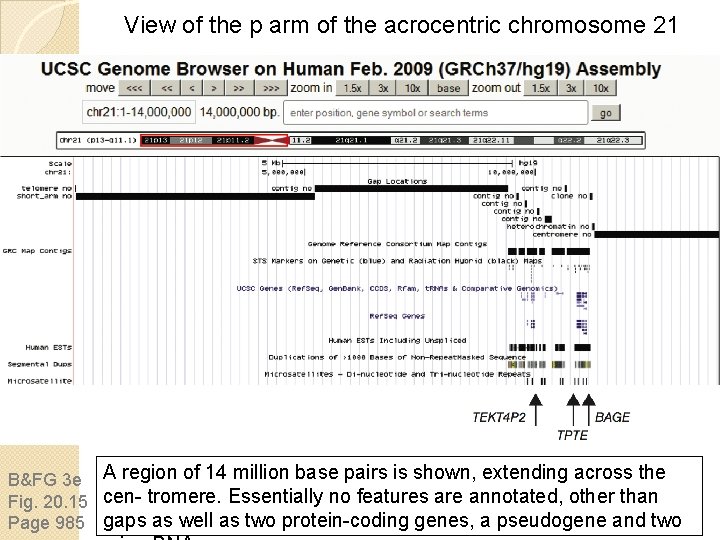
D Chrom. Length # Genes # Pseudo- Gap size Accession genes (Mb) 13 115 Mb 633 296 19. 6 NC_000013. 10 14 107 Mb 1, 050 393 19. 1 NC_000014. 8 15 103 Mb 695 250 20. 8 NC_000015. 9 The five human acrocentric chromosomes are 13, 14, 15 as well as 21 and 22. For each, the p arm is almost entirely heterochromatic. B&FG 3 e Tab. 20. 15 Page 980
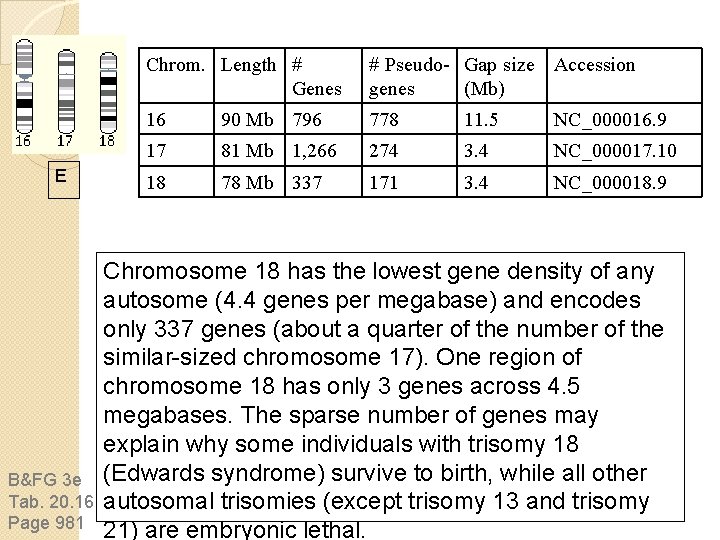
E B&FG 3 e Tab. 20. 16 Page 981 Chrom. Length # Genes # Pseudo- Gap size Accession genes (Mb) 16 90 Mb 796 778 11. 5 NC_000016. 9 17 81 Mb 1, 266 274 3. 4 NC_000017. 10 18 78 Mb 337 171 3. 4 NC_000018. 9 Chromosome 18 has the lowest gene density of any autosome (4. 4 genes per megabase) and encodes only 337 genes (about a quarter of the number of the similar-sized chromosome 17). One region of chromosome 18 has only 3 genes across 4. 5 megabases. The sparse number of genes may explain why some individuals with trisomy 18 (Edwards syndrome) survive to birth, while all other autosomal trisomies (except trisomy 13 and trisomy 21) are embryonic lethal.
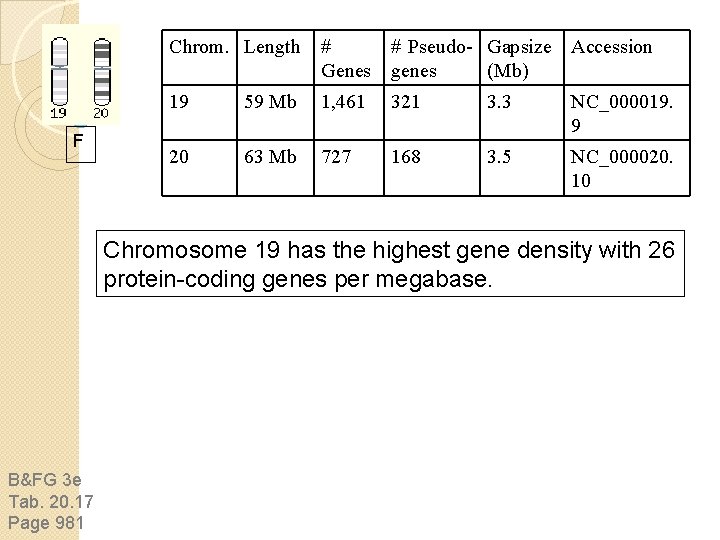
F Chrom. Length # # Pseudo- Gapsize Accession Genes genes (Mb) 19 59 Mb 1, 461 321 3. 3 NC_000019. 9 20 63 Mb 727 168 3. 5 NC_000020. 10 Chromosome 19 has the highest gene density with 26 protein-coding genes per megabase. B&FG 3 e Tab. 20. 17 Page 981
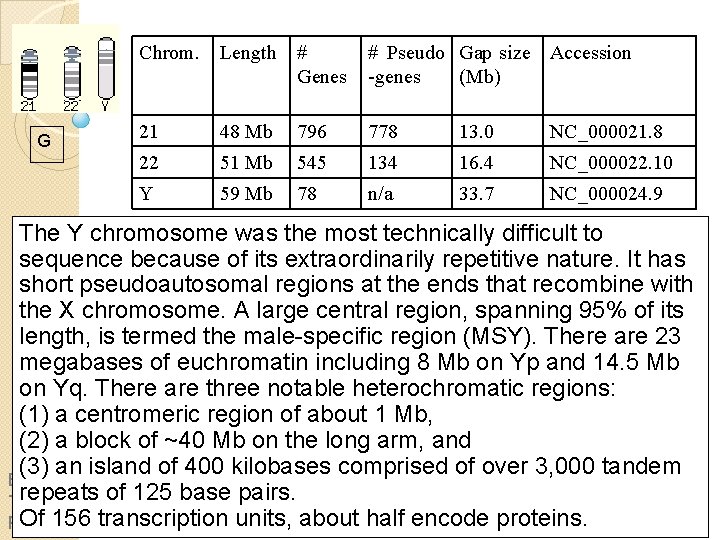
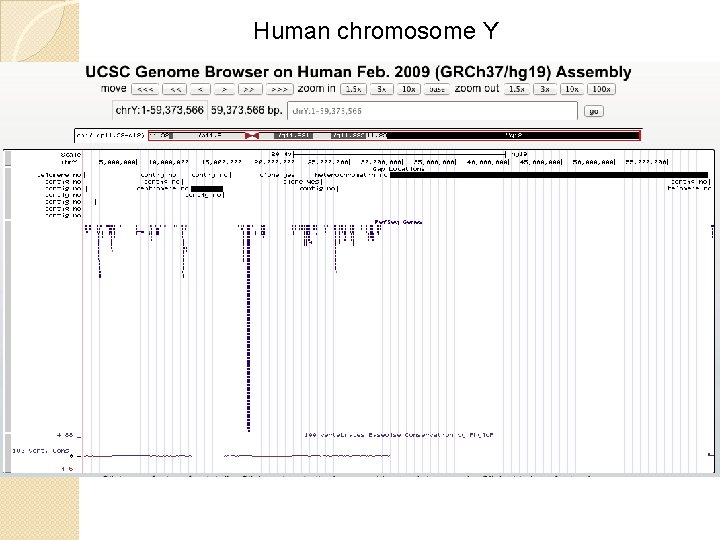
G Chrom. Length # Genes # Pseudo Gap size Accession -genes (Mb) 21 48 Mb 796 778 13. 0 NC_000021. 8 22 51 Mb 545 134 16. 4 NC_000022. 10 Y 59 Mb 78 n/a 33. 7 NC_000024. 9 The Y chromosome was the most technically difficult to sequence because of its extraordinarily repetitive nature. It has short pseudoautosomal regions at the ends that recombine with the X chromosome. A large central region, spanning 95% of its length, is termed the male-specific region (MSY). There are 23 megabases of euchromatin including 8 Mb on Yp and 14. 5 Mb on Yq. There are three notable heterochromatic regions: (1) a centromeric region of about 1 Mb, (2) a block of ~40 Mb on the long arm, and (3) an island of 400 kilobases comprised of over 3, 000 tandem B&FG 3 e repeats Tab. 20. 18 of 125 base pairs. Of 156 Page 981 transcription units, about half encode proteins.
Human chromosome Y
View of the p arm of the acrocentric chromosome 21 B&FG 3 e A region of 14 million base pairs is shown, extending across the Fig. 20. 15 cen- tromere. Essentially no features are annotated, other than Page 985 gaps as well as two protein-coding genes, a pseudogene and two
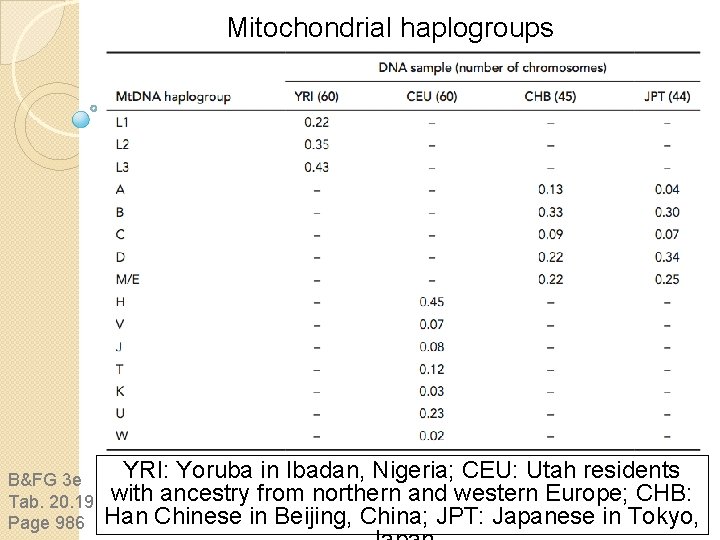
Mitochondrial haplogroups B&FG 3 e Tab. 20. 19 Page 986 YRI: Yoruba in Ibadan, Nigeria; CEU: Utah residents with ancestry from northern and western Europe; CHB: Han Chinese in Beijing, China; JPT: Japanese in Tokyo,
Outline Introduction Main conclusions of human genome project Gateways to access the human genome Human Genome Project Background Strategic issues Human genome assemblies Broad genomic landscape Repeat content of human genome Gene content of human genome 25 human chromosomes Human genome variation Perspective
Human genome variation We conclude our topic by exploring variation in the human genome, including single-nucleotide polymorphisms (SNPs) and the International Hap. Map project; the 1000 Genomes Project; and the sequencing of individual human genomes. B&FG 3 e Page 986
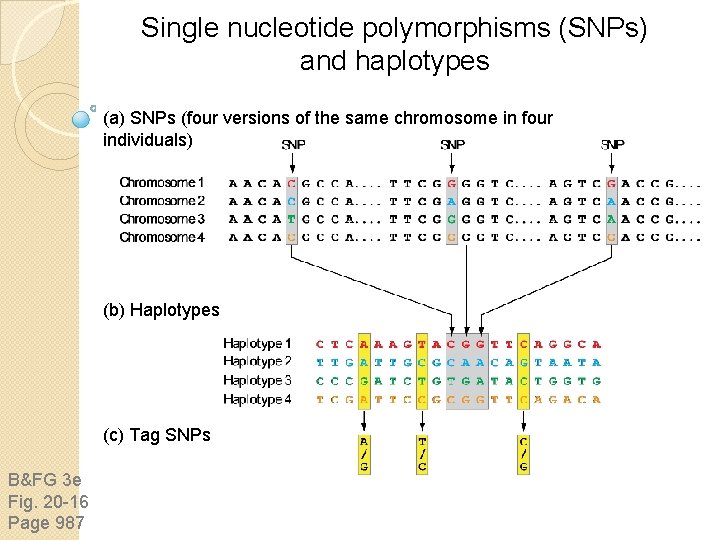
SNPs, Haplotypes, and Hap. Map B&FG 3 e Page 987 SNPs represent a fundamental form of variation in the human population. We can document: • the number of SNPs. Each person has 3 -4 million single nucleotide variants (SNVs). • the sequence (major and minor allele) • the copy number • the allele frequencies (some SNPs occur more often in people from particular geographic backgrounds) • the relationship to neighboring SNPs: linkage disequilibrium (LD) occurs when SNPs are tightly linked to each other and form blocks. The behavior of one SNP (a “tag SNP”) can serve as a proxy for the genotypes of neighboring SNPs.
Single nucleotide polymorphisms (SNPs) and haplotypes (a) SNPs (four versions of the same chromosome in four individuals) (b) Haplotypes (c) Tag SNPs B&FG 3 e Fig. 20 -16 Page 987
Viewing and Analyzing SNPs and Haplotypes SNP data can be visualized with many tools, including: • browsers at UCSC, NCBI, and Ensembl; • Haplo. View; • Integrative Genomics Viewer (IGV) from the Broad; • PLINK B&FG 3 e Page 988
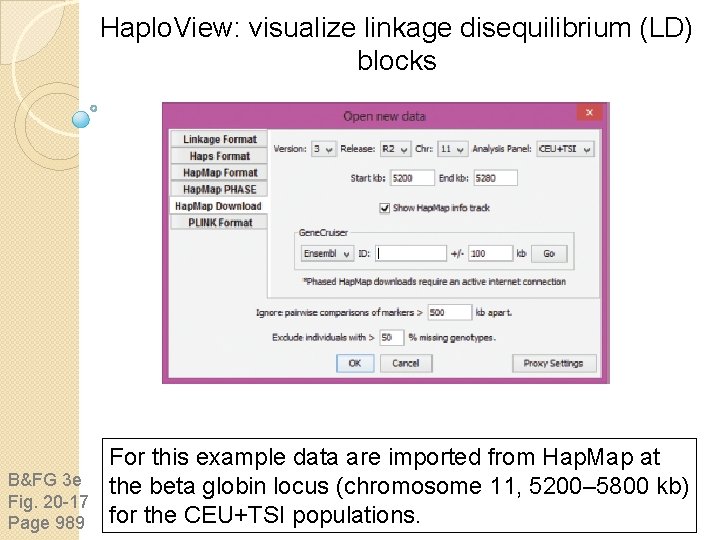
Haplo. View: visualize linkage disequilibrium (LD) blocks B&FG 3 e Fig. 20 -17 Page 989 For this example data are imported from Hap. Map at the beta globin locus (chromosome 11, 5200– 5800 kb) for the CEU+TSI populations.
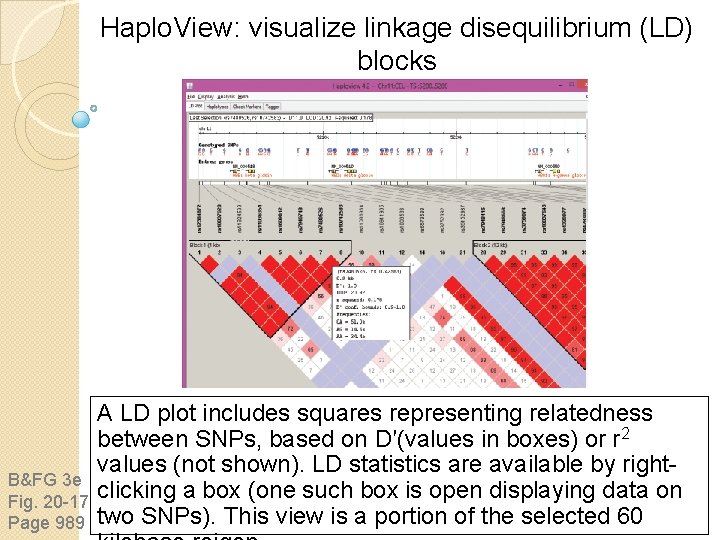
Haplo. View: visualize linkage disequilibrium (LD) blocks B&FG 3 e Fig. 20 -17 Page 989 A LD plot includes squares representing relatedness between SNPs, based on D′(values in boxes) or r 2 values (not shown). LD statistics are available by rightclicking a box (one such box is open displaying data on two SNPs). This view is a portion of the selected 60
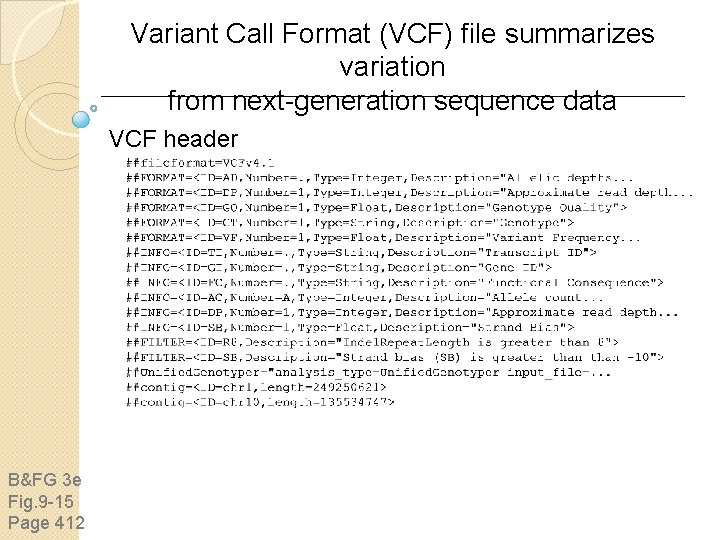
Variant Call Format (VCF) file summarizes variation from next-generation sequence data VCF header B&FG 3 e Fig. 9 -15 Page 412
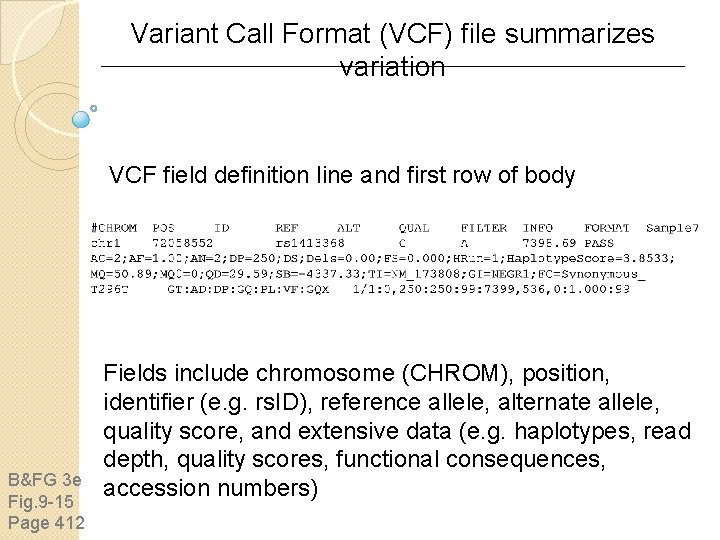
Variant Call Format (VCF) file summarizes variation VCF field definition line and first row of body B&FG 3 e Fig. 9 -15 Page 412 Fields include chromosome (CHROM), position, identifier (e. g. rs. ID), reference allele, alternate allele, quality score, and extensive data (e. g. haplotypes, read depth, quality scores, functional consequences, accession numbers)
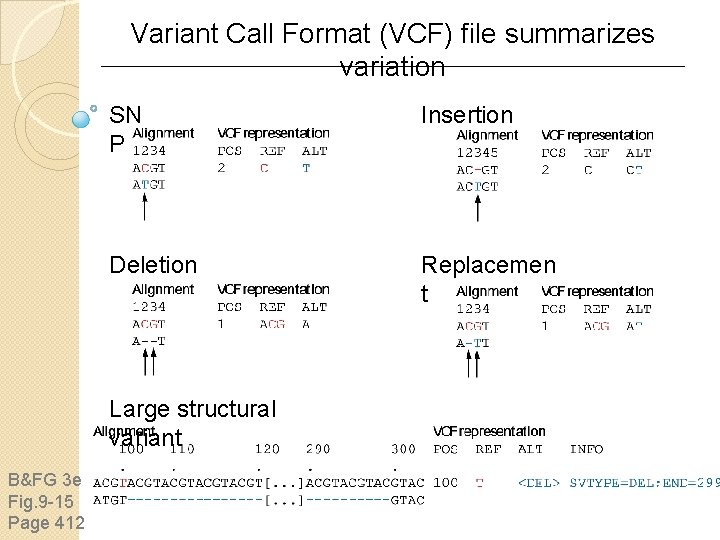
Variant Call Format (VCF) file summarizes variation SN P Insertion Deletion Replacemen t Large structural variant B&FG 3 e Fig. 9 -15 Page 412
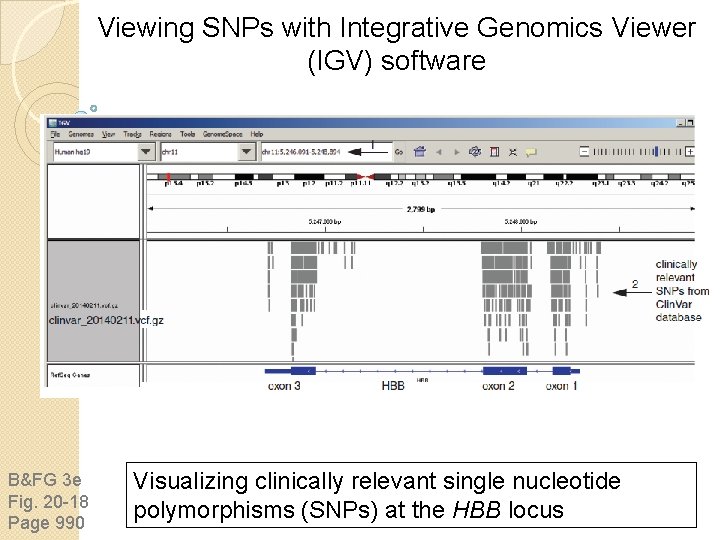
Viewing SNPs with Integrative Genomics Viewer (IGV) software B&FG 3 e Fig. 20 -18 Page 990 Visualizing clinically relevant single nucleotide polymorphisms (SNPs) at the HBB locus
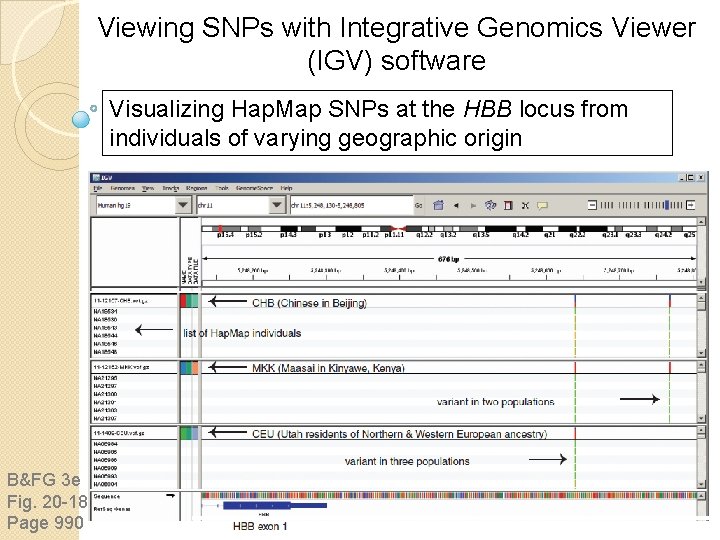
Viewing SNPs with Integrative Genomics Viewer (IGV) software Visualizing Hap. Map SNPs at the HBB locus from individuals of varying geographic origin B&FG 3 e Fig. 20 -18 Page 990
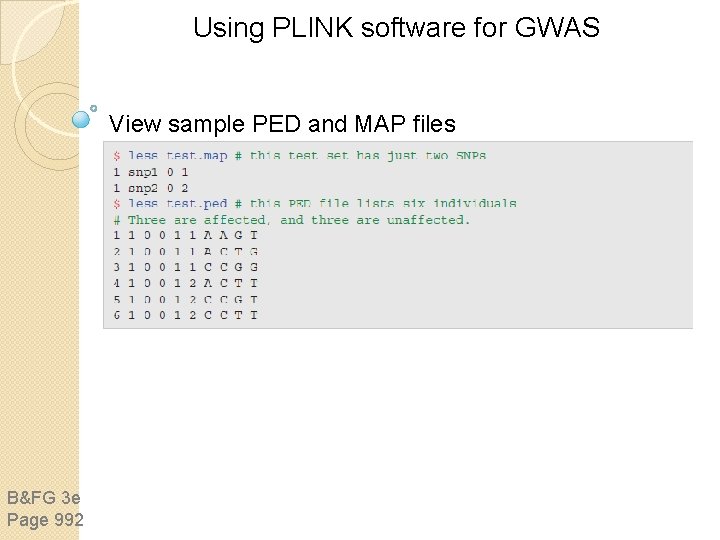
Using PLINK software for GWAS View sample PED and MAP files B&FG 3 e Page 992
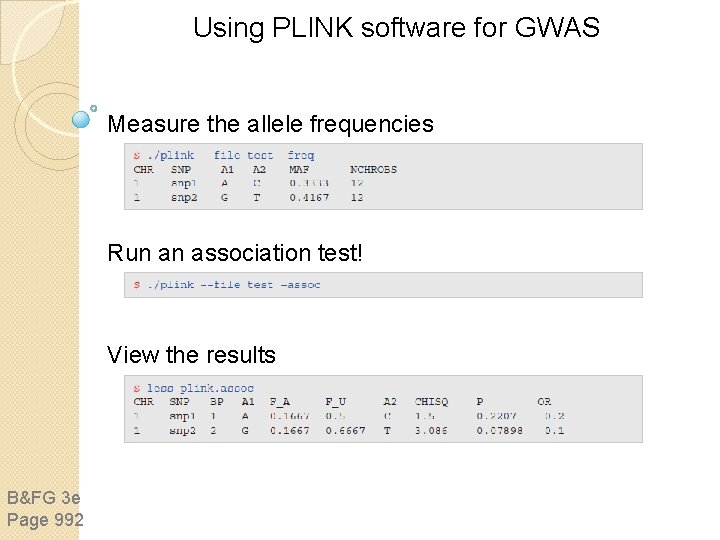
Using PLINK software for GWAS Measure the allele frequencies Run an association test! View the results B&FG 3 e Page 992
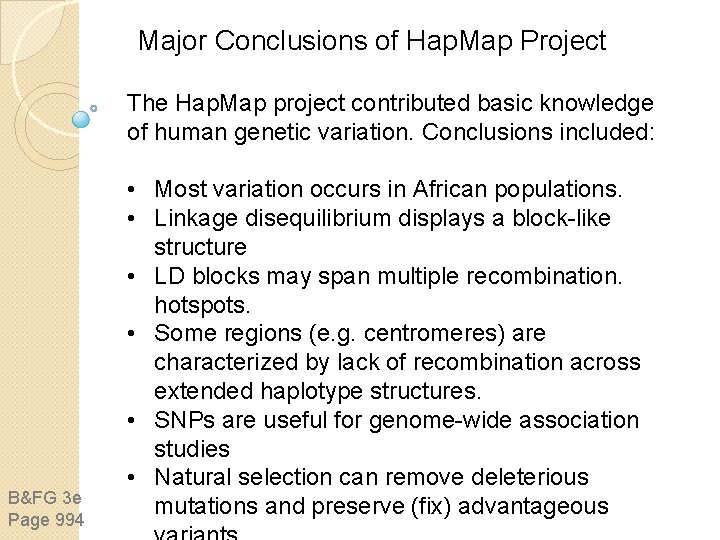
Major Conclusions of Hap. Map Project The Hap. Map project contributed basic knowledge of human genetic variation. Conclusions included: B&FG 3 e Page 994 • Most variation occurs in African populations. • Linkage disequilibrium displays a block-like structure • LD blocks may span multiple recombination. hotspots. • Some regions (e. g. centromeres) are characterized by lack of recombination across extended haplotype structures. • SNPs are useful for genome-wide association studies • Natural selection can remove deleterious mutations and preserve (fix) advantageous
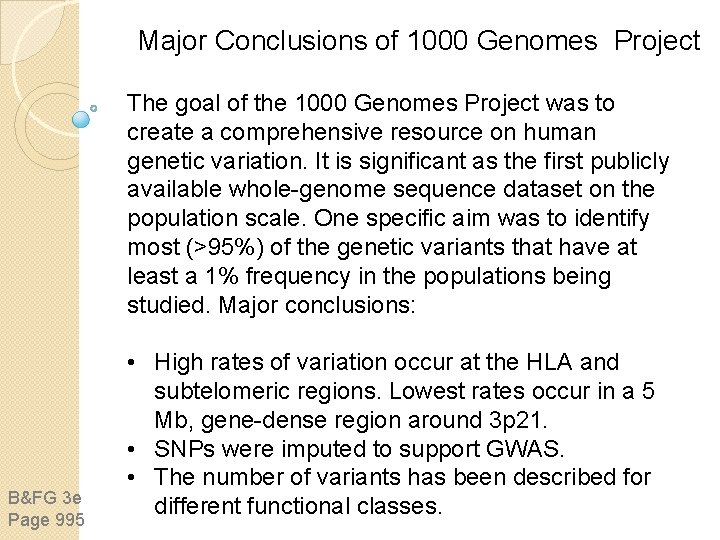
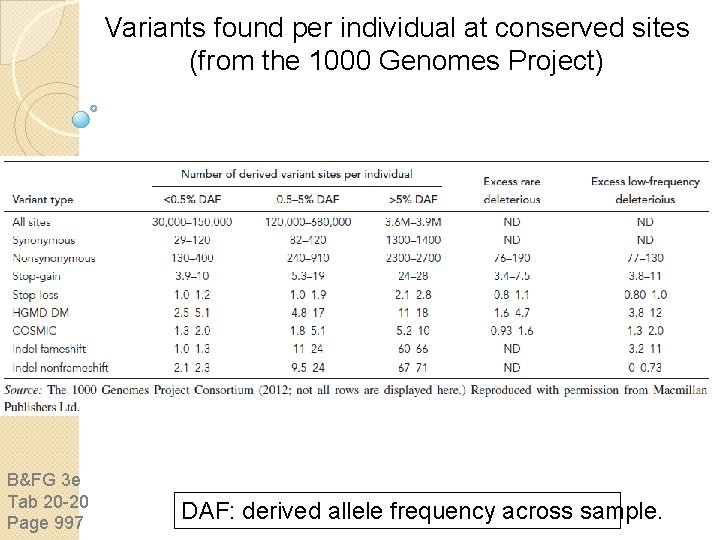
Major Conclusions of 1000 Genomes Project The goal of the 1000 Genomes Project was to create a comprehensive resource on human genetic variation. It is significant as the first publicly available whole-genome sequence dataset on the population scale. One specific aim was to identify most (>95%) of the genetic variants that have at least a 1% frequency in the populations being studied. Major conclusions: B&FG 3 e Page 995 • High rates of variation occur at the HLA and subtelomeric regions. Lowest rates occur in a 5 Mb, gene-dense region around 3 p 21. • SNPs were imputed to support GWAS. • The number of variants has been described for different functional classes.
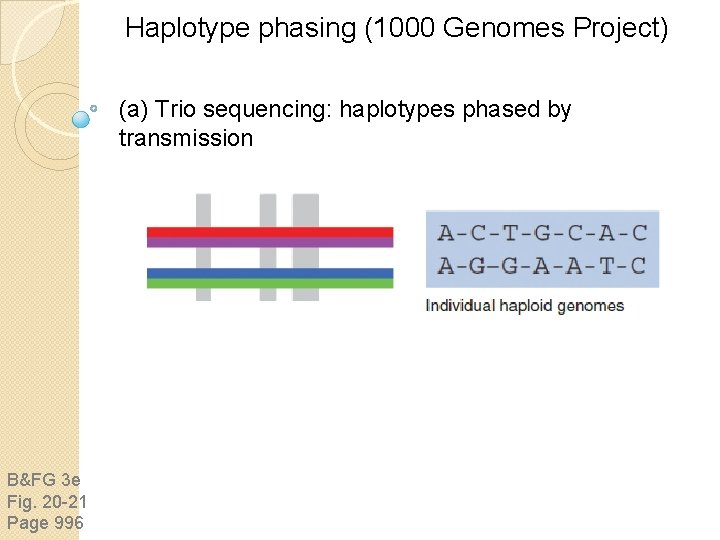
Haplotype phasing (1000 Genomes Project) (a) Trio sequencing: haplotypes phased by transmission B&FG 3 e Fig. 20 -21 Page 996
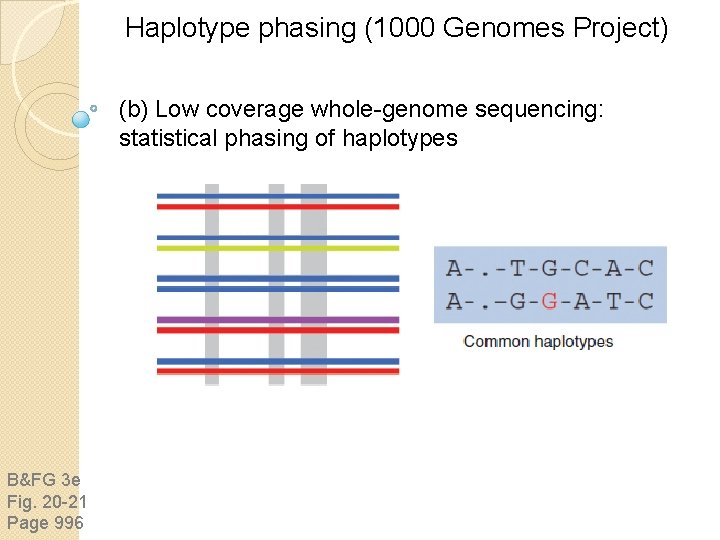
Haplotype phasing (1000 Genomes Project) (b) Low coverage whole-genome sequencing: statistical phasing of haplotypes B&FG 3 e Fig. 20 -21 Page 996
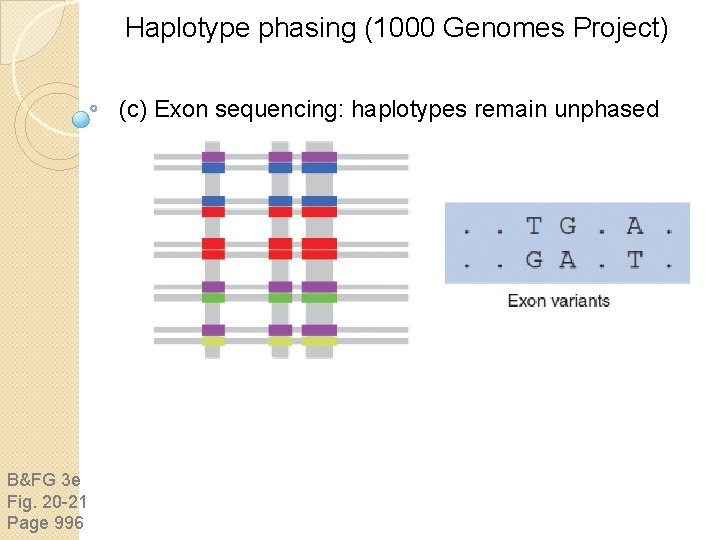
Haplotype phasing (1000 Genomes Project) (c) Exon sequencing: haplotypes remain unphased B&FG 3 e Fig. 20 -21 Page 996
Variants found per individual at conserved sites (from the 1000 Genomes Project) B&FG 3 e Tab 20 -20 Page 997 DAF: derived allele frequency across sample.
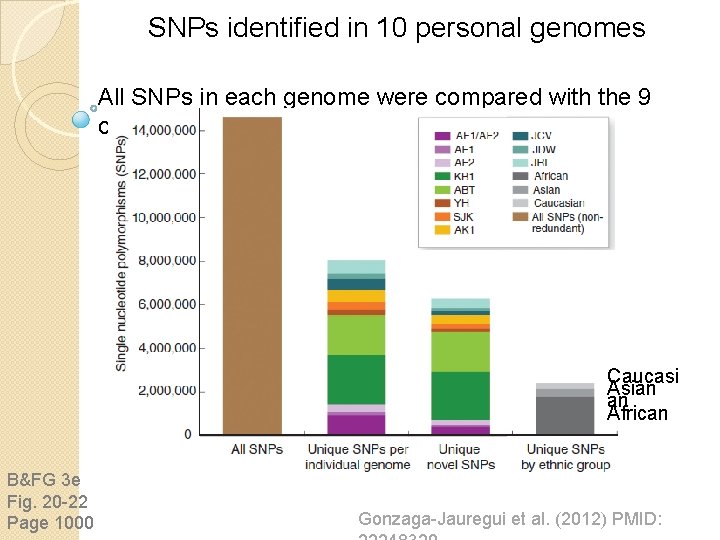
Variation: Sequencing Individual Genomes • The cost of genome sequencing continues to decline. • Individual genome sequencing has the potential to facilitate the start of an era of individualized medicine in which DNA changes that are associated with a disease condition are identified. • In 2007 the first two individual genomes were reported: J. Craig Venter and James Watson. • Each genome harbors 3 -4 million SNVs and perhaps 600, 000 structural variants. • Trio sequencing shows that each individual harbors on the order of 100 de novo variants. B&FG 3 e Page 998
SNPs identified in 10 personal genomes All SNPs in each genome were compared with the 9 others Caucasi Asian an African B&FG 3 e Fig. 20 -22 Page 1000 Gonzaga-Jauregui et al. (2012) PMID:
Outline Introduction Main conclusions of human genome project Gateways to access the human genome Human Genome Project Background Strategic issues Human genome assemblies Broad genomic landscape Repeat content of human genome Gene content of human genome 25 human chromosomes Human genome variation Perspective
Perspective Two major technological advances enabled the human genome to be sequenced: (1) the invention of automated DNA sequencing machines in the 1980 s allowed nucleotide data to be collected on a large scale; and (2) the computational biology tools necessary to analyze those sequence data were created by biologists and computer scientists. B&FG 3 e Page 999 The human genome project was completed c. 2003. The first individual genome sequence was reported in 2007 (that of J. Craig Venter). A decade later over 100, 000 genomes have been sequenced, and over 1 million exomes. We can expect to continue to catalog variation and to further relate genotype to phenotype.