Cardiac Muscle Figure 1 02 The cardiac cycle


 for skeletal and cardiac muscle")

")

 l")


 Isometric")


 as it is altered by")
")


 l .")


 curve. See cardiac muscle length-tension curve. The")


 l l l l l Sympathetic")

 Ca++ Cardiac glycosides")


, through enhanced inotropicity")


 / EDV l or l EF")


 = O 2 uptake (ml O 2/min. )")

 on cardiovascular function")


: Phase 4 Polarized Cell;")


 plane.")
 plane.")
 leads, situated in the transverse (horizontal) plane.")
.")
 -")
 -")


 heart (AV) block. There is no relationship between P waves")
 heart (AV) block. There is no relationship between P waves")

. Rate <40 / min.")
, including right or left bundle branch block. Wide")


- Slides: 124
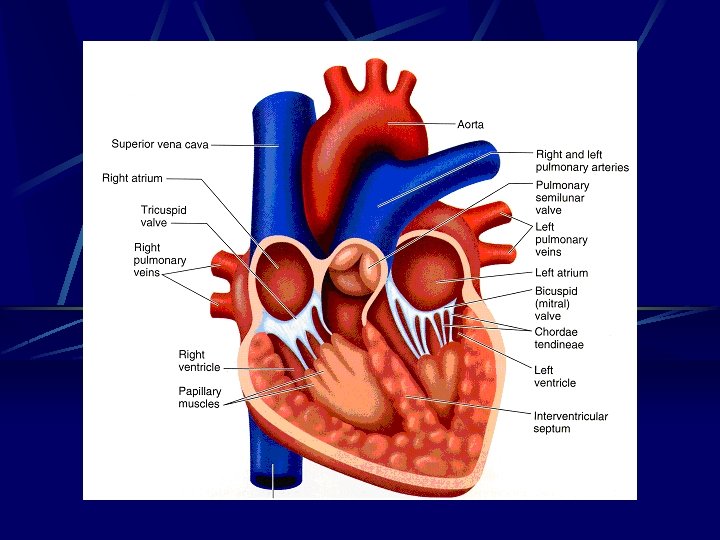
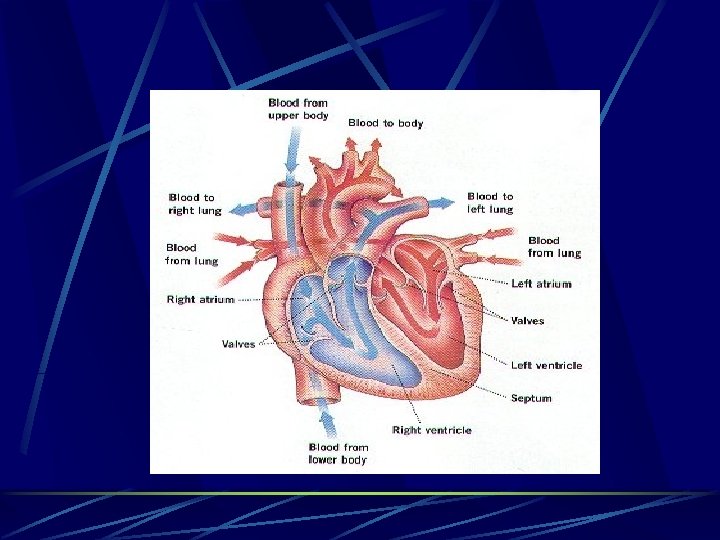
Cardiac Muscle
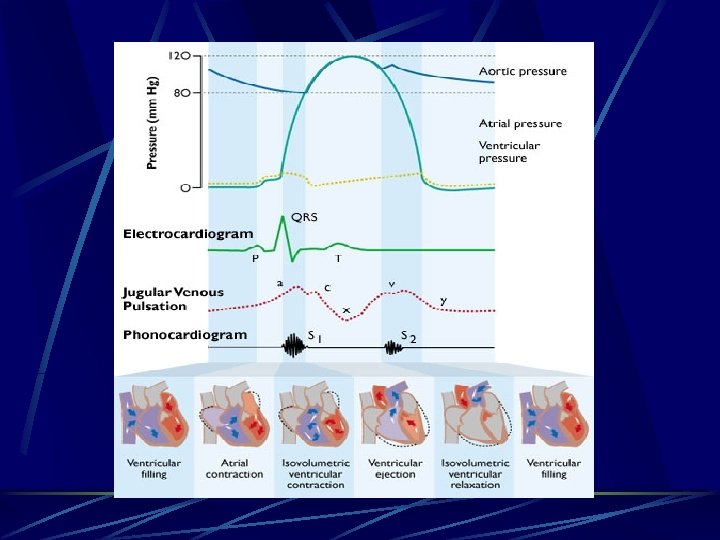
Figure 1. 02. The cardiac cycle in terms of time
Figure 1. 02 B. Left heart pressures during one cardiac cycle
Figure 1. 02 C. Ventricular blood volume during one cardiac cycle
Figure 1. 02 D. Aortic blood flow during one complete cardiac cycle
Figure 1. 02 E. ECG and heart sounds during one cardiac cycle
Figure 1. 02 F. Right heart pressures during one cardiac cycle
Figure 1. 05. Normal blood pressure and oxygen saturation values
Length-tension curves (diagrams) for skeletal and cardiac muscle
Figure 12 M 0. The effect of norepinephrine in augmenting tension and rate of tension development (Inotropicity) produced during isometric muscle twitches
Figure 14. Bowditch effect (ie. , Treppe, Staircase, force frequency relationship)
Refractory Period: Long, compared to skeletal muscle Prevents tetanus, guarantees a period of filling Prevents ineffective tachycardia Prevents re-entry ("circus" movement)
Two Kinds of Myocardial Cells: Pacemaker - exhibit automaticity (rising phase 4 prepotential) l l primary - SA nodal reserve - SA nodal, purkinje, AV nodal Follower - no automaticity l (stable phase 4 potential; atrium, ventricle)
Figure 3. The various ion pumps of the cell.
Figure 2 M 0. The three slow Ca++ channel states: resting, active, inactive. "d" and "f" are upper and lower gates in the channel.
Ion Channels: Fast - initial rapid inward Na+ current. - secondary outward K+ movement repolarization Slow* - Ca++ moves inward, responsible for maintained depolarization of the "plateau phase" (Phase 2) * An increase in contraction frequency increases Ca++ movement inward, giving the "staircase" phenomenon (Treppe, Bowditch) in cardiac muscle.
Figure 4 M 0. The fast sodium and slow calcium channels. The fast channel is in its "resting" mode; the slow channel is in its depolarization mode, ie. active state (Ca++ ions moving through). The black dot indicates Nifedipine attachment site. TTX = Tetrodotoxin, Nifedipine = a medically-used Ca++ channel blocker. "m" and "h" are upper and lower gates in the Na+ channel. "d" and "f" are upper and lower gates in the Ca++ channel.
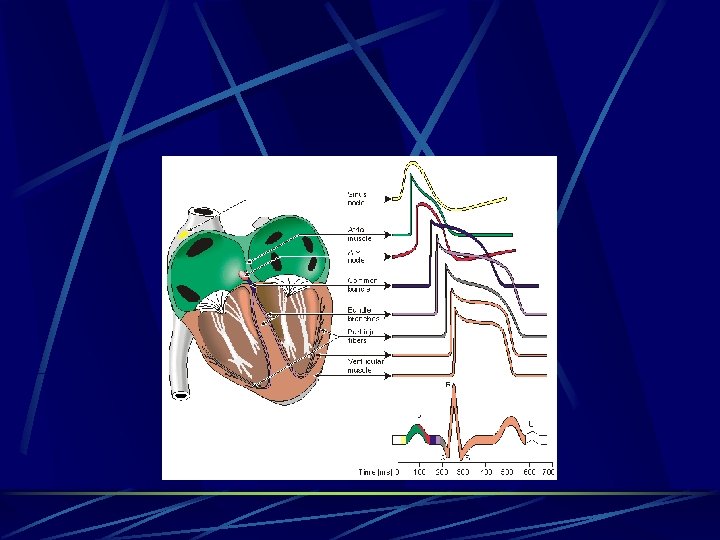
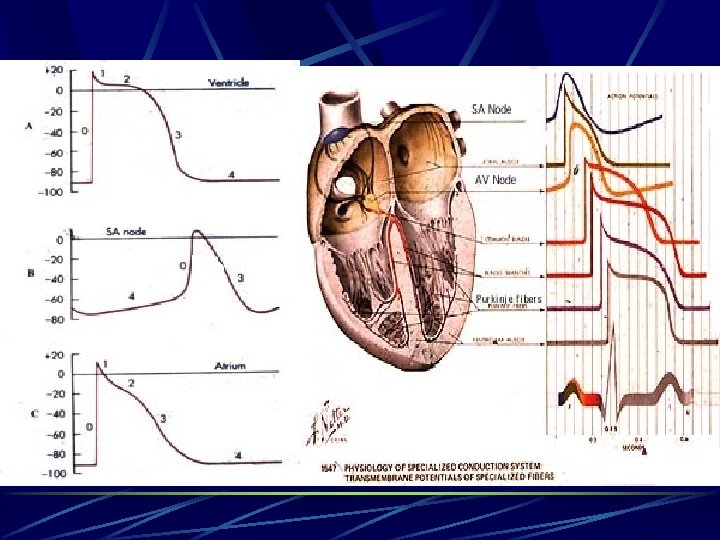
Figure 5 M 0. Changes in transmembrane potential before and during depolarization in various types of myocardial cells. Not all the depolarization / repolarizations look like that in Figure 1.
Mechanisms for Changing Pacemaker Cell Automaticity: Hyperpolarize/hypopolarize overdrive suppression Alteration of slope (rate of rise) of prepotential (diastolic potential) Alteration of threshold; e. g. epinephrine increases g. Ca++ (hypopolarizes), acetylcholine increases g. K+ (hyperpolarizes)
l l l Factors Determining Action Potential Conduction Velocity: Amplitude & rate of change of action potential increasing velocity, decreasing time - if large, more likely to depolarize adjacent cells Anatomy of conducting cells - increased diameter, increases conduction velocity - number of interconnections - longer nexus junctions (Purkinje cells) "Cable Properties" of the conducting system
Factors Affecting Conduction Through the AV Junction: Speeds l Catecholamines * l Atropine - blocks Acetylcholine l Quinidine - inhibits vagal effects l l Slows Acetylcholine * * Digitalis - central vagal (parasympathetic) stimulation Inhibitors of acetylcholine esterase, Ca++ antagonists (e. g. verapamil) An increased number of impulses arriving at AV junction increases refractoriness
Various Conditions of Muscle Contraction: Isotonic Unloaded Preloaded Afterloaded (to less than isometric) Isometric
Comparing isotonic and isometric muscle contractions. + indicates it occurs; - does not occur
Figure 6 M 0. Isometric and isotonic skeletal muscle twitches following a single action potential
Figure 9 M 0. Isometric twitch tension as it is influenced by preload (ie. initial length, Frank-Starling mechanism)
Figure 10 M 0. Velocity of muscle shortening and power output as each is influenced by increasing afterload
Figure 8 M 0. Velocity of shortening (isotonic contraction) as it is altered by afterload and preload
Effects of Increased Preload on Velocity of Shortening, etc: Increased velocity of shortening (isotonic) at any given afterload Unaltered Vmax at zero afterload Increased muscle length Increased tension development (isometric)
Effects of Afterload on Velocity of Shortening: Maximum at no load Zero at maximum load (isometric) Intermediate with some, not maximum load
Effects of Increased Inotropicity on Velocity of Shortening, etc. : Increased velocity of shortening (isotonic) at any given afterload Increased Vmax at zero afterload Same muscle length Increased tension development (isometric), and increased rate of contraction and relaxation
Figure 13 M 0. Velocity of muscle shortening and the influence of a catecholamine such as norepinephrine (Inotropicity) in modifying the relationship
Figure 7 M 0. Mechanisms for altering isometric tension in cardiac muscle vs skeletal muscle
Factors Affecting Heart Rate: l l l l Leading to an INCREASE: decreased activity of baroreceptors in the arteries, LV, and pulm. circ. (1) inspiration (2) excitement, anger, most painful stimuli (1) hypoxia (1? ) exercise (1) norepinephrine (1) , epinephrine thyroid hormones fever Bainbridge reflex Leading to a DECREASE: increased activity of baroreceptors in the arteries, LV, and pulm. circ. (2) expiration (1) fear, grief (2) stimulation of pain fibers in trigeminal nerve increased intracranial pressure (Cushing Reflex) (1)
Actions of Vagal Parasympathetic Neurons to the Heart (through release of acetylcholine) l . . . Site. . . . Action. . . . . Affecting. . . l sino-atrial node. . . . . decreases heart rate. . . chronotropicity l atrio-ventricular node. . . slowed AV conduction. . . chronotropicity l atrio-ventricular node. . delayed conduction / increased refractoriness ………………………………. . chronotropicity l Note: There are few/no parasympathetic nerve endings on the ventricular myocardium, so while acetylcholine is a potential negative inotrope for the ventricles, it is not released there.
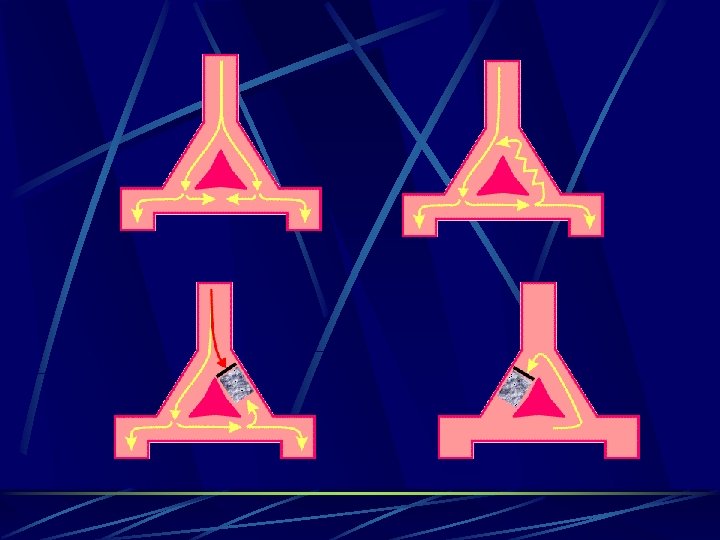
Figure 2. 01. Schematic of vagal escape. Acetylcholine release from parasympathetic ends on the SA node and AV node & Junctional tissue increases refractoriness and depresses conduction velocity. Intense stimulation will stop ventricular depolarization, ie. contraction. Reserve pacemakers come into play.
Control of Cardiac Performance: STROKE VOLUME: Extrinsic: l Release of the following substances from the sympathetic and parasympathetic branches of the autonomic nervous system, affect inotropicity: l norepinephrine (+) - neural l acetylcholine (-) - neural* l epinephrine (+) - blood borne These actions are mediated through cardiopulmonary receptors, such as the carotid sinus (aortic) baroreceptors, carotid (aortic) body chemoreceptors, central chemo-receptors, venae cavae/atrial volume receptors (Bainbridge), and the ventricular volume receptors. l Attention: Inotropicity (ie. contractility) and strength of contraction are not synonomous. Increased / decreased strength of contraction can be achieved by changing preload (ie. Frank-Starling) with no change in inotropicity. Inotropicity reflects the biochemical state within the muscle (eg. Ca<SUP++< sup>, ATP), not simply the positioning of the thick and thin l l l l myofilaments as determined by stretch. Intrinsic: Frank-Starling - through preload (heterometric autoregulation) afterload - through increased / decreased arterial blood pressure acting on aortic valve. Anrep effect - laboratory curiousity? Bowditch effect } (homeometric autoregulation) (Treppe, Staircase) environment - ischemia, O 2, CO 2 cardiac hypertrophy - longterm effect * In actual fact, there are few parasympathetic fibers in the ventricular myocardium, so ACH has little practical effect physiologically on ventricular inotropicity (contractility).
Figure 2. 02. Frank-Starling (or ventricular function) curve. See cardiac muscle length-tension curve. The black curve defines a single inotropic state.
Major Factors Determining Myocardial Stretch: Total blood volume l Body position relative to the earth and gravity pull l Intrathoracic pressure l Intrapericardial pressure l Venous tone l Pumping action of the skeletal muscle l Atrial contribution to ventricular filling l
Figure 2. 03. Some factors contributing to afterload. What are shown here are the effects of increased vascular resistance and vascular compliance. Another major factor not shown is heart dimension, ie. a dilated heart sustains greater afterload at the same arterial or ventricular pressure than a smaller heart (a larger heart has larger radii of curvature and through the Law of Laplace is at greater mechanical disadvantage relative to internal pressure than a smaller heart).
Major factors determining myocardial contractile state (ie. inotropicity) l l l l l Sympathetic nerve impulses (normal) Circulating catecholamines (normal) Force-frequency relation (Bowditch, Treppe, Staircase) Normal) Various natural inotropic agents (normal) Digitalis, other non-natural inotropic agents (medical) Anoxia, hypercapnia, acidosis (pathologic) Pharmacologic depressants (medical / pathologic) Loss of myocardium (pathologic) Intrinsic depressants (normal / pathologic) l Attention: Inotropicity (ie. contractility) and strength of contraction are not synonomous. Increased / decreased strength of contraction can be achieved by changing preload (ie. Frank-Starling) with no change in inotropicity. Inotropicity reflects the biochemical state within the muscle (eg. Ca<SUP++< sup>, ATP), not simply the positioning of the thick and thin l myofilaments as determined by stretch.
Figure 2. 04. Two Frank-Starling curves demonstrating altered inotropicity; Blue - lower inotropicity; Green higher inotropicity.
Inotropic agents: l l l l Positive: Catecholamines (epinephrine, norepinephrine, isoproterenol) Ca++ Cardiac glycosides (digitalis) Negative: Ischemia/hypoxia Acetylcholine Heart Failure
Stages of the cardiac cycle
The cardiac cycle as a loop, independent of time
Figure 2. 05. Changing pump conditions: A, changing preload; B, changing afterload; C, changing contractile state Note: Review loop-display .
changing afterload, preload remains constant
Alterations in contractile state: using systolic reserve volume (more complete emptying), through enhanced inotropicity
Figure 2. 07. Major factors contributing to cardiac output - Summary
Figure 2. 06. Mechanisms of cardiac hypertrophy. Concentric and Eccentric Hypertrophy
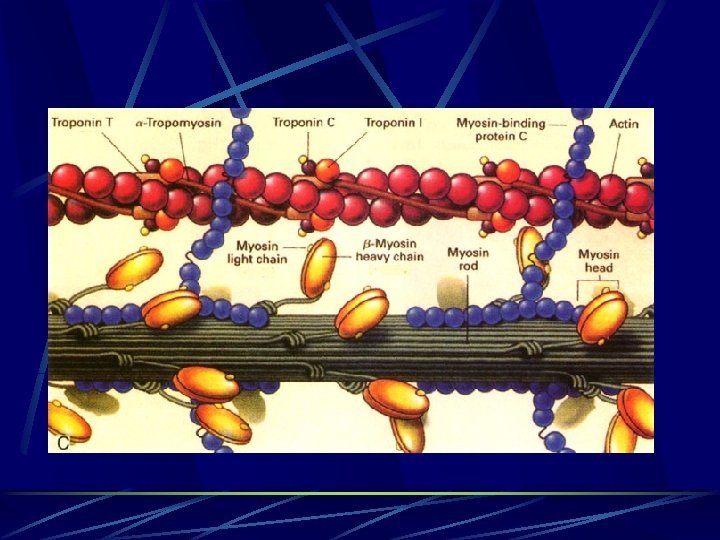
Changes in Gene Expression in Cardiac Overload: Quantitative changes: Coordinated increase in protein (myosin, actin, myoglobin, Ca++ channels, mitochondria, surface membrane) and RNA (m, r and t) synthesis. Regulated at a transcriptional and at the translational level. Adaptational, because it multiplies contractile units and decreases wall stress. Qualitative changes: Several shifts in isoforms (myosin, creatine kinase, actin, tropomyosin, LDH, Na+-K+, ATPase, and SR protein). Due to an isogene change in expression (myosin). Adaptational because it decreases Vmax. and improves heat production.
Figure 10. Velocity of muscle shortening and power output as each is influenced by increasing afterload
Ejection Fraction l EF = (EDV - ESV) / EDV l or l EF = SV / EDV, e. g. EF = 100 ml / 150 ml = 0. 66 l Note: SV = EDV - ESV
Figure 2. 09. Assessment of ventricular performance. PEP, LVET, and the ratio of PEP / LVET.
Figure 2. 08. Factors affecting pre-ejection period
Figure 2. 10. Range of ejection fractions. The normal range may extend to 0. 82 or 0. 84. Values below 0. 15 are usually incompatible with life. Note: The heart wall may be said to display normal kinesis, hypokinesis, hyperkinesis, akinesis (no motion), dyskinesis (paradoxical wall motion).
Figure 3. 01. Blood flow distribution and arteriovenous oxygen differences. The term "oxygen content" actually means "oxygen concentration". Arterial O 2 concentration is constant, while venous O 2 concentration varies from organ to organ, tissue to tissue
Ischemia Increased A-V O 2 diff. at rest usually indicates ischemia. Ischemia is relieved by: increasing blood flow l decreasing O 2 consumption Increased A-V lactate indicates inadequate flow; heart usually uses lactate, in ischemia it produces lactate l
The concept of Cardiac Reserve
Figure 3. 02. The concept of cardiovascular reserve. Cardiac Output is in units of liters
Fick Equation: Cardiac output (L/min. ) = O 2 uptake (ml O 2/min. ) / A-V O 2 diff. (ml O 2/L blood) l For Example: C. O. = 250/ (0. 19 - 0. 14) = 5100 ml/min. l O 2 uptake = 250 ml/min. ; Arterial O 2 content = 0. 19 ml/ml; Venous O 2 content = 0. 14 ml/ml l
Figure 3. 03. A dye-dilution curve
Figure 3. 04. Effects of different levels of exercise (work) on cardiovascular function
Figure 3. 05. Redistribution of cardiac output with increased exercise / workload
Figure 3. 06. Specific blood flow in various organs and tissues
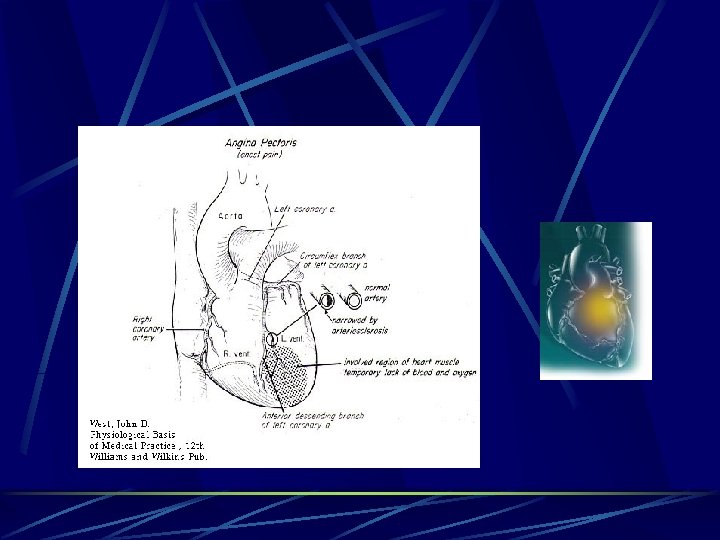
Figure 3. 07. The coronary vessels
Figure 3. 11. An angiogram of normal coronary vessels in an opened heart preparation (vessels filled with radiopaque material). On right is the horizontal main right coronary artery with small dscending twigs. On the left is the major left descending ramus and the horizontal major left circumflex ramus. Between these two are several large diagonal branches. The vessels show progressively diminishing lumina with no irregular narrowings or obstructions.
Thallium Study Examine the images below obtained during exercise stress and at rest for a normal patient. Note the uniform distribution in the walls of both right and left ventricle
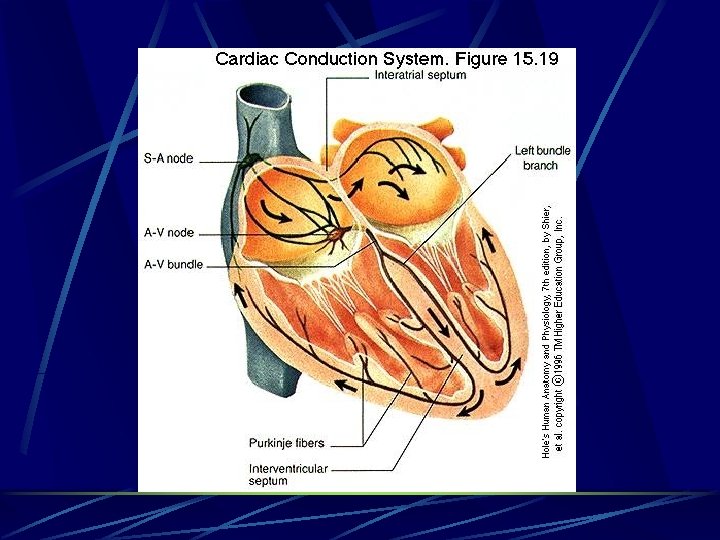
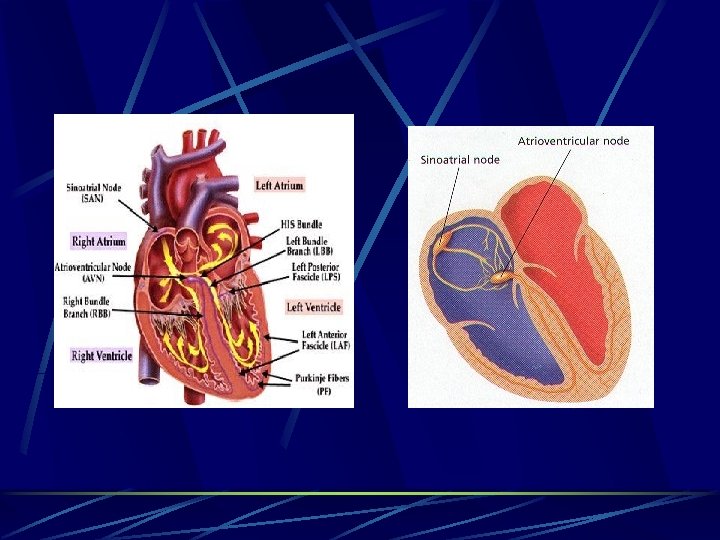
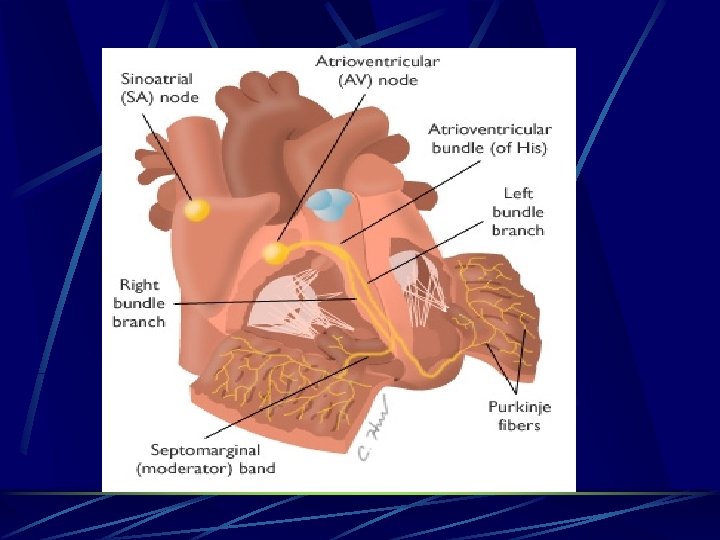
Figure 1. The conduction system for the cardiac action potential. Normally the SA node depolarizes first and then the rest of the atria. After a delay at the AV junctional tissue, the action potential is conducted down the AV node, to the AV bundle, to the bundle branches, to the Purkinje fibers, and then to the right and left ventricles.
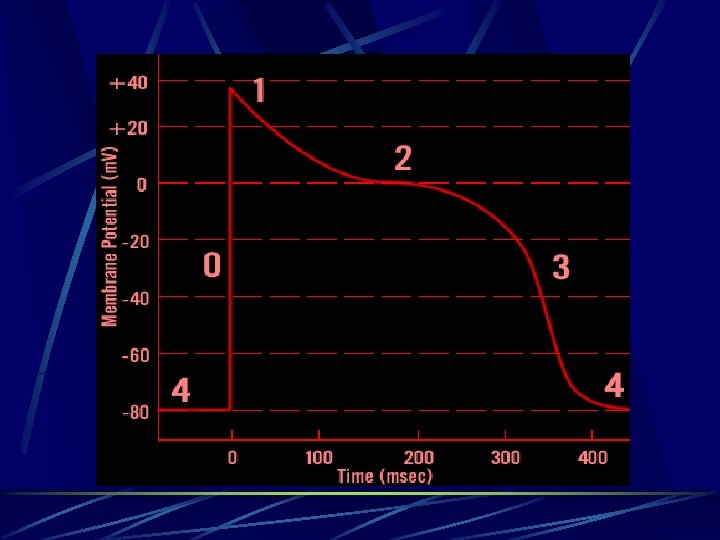
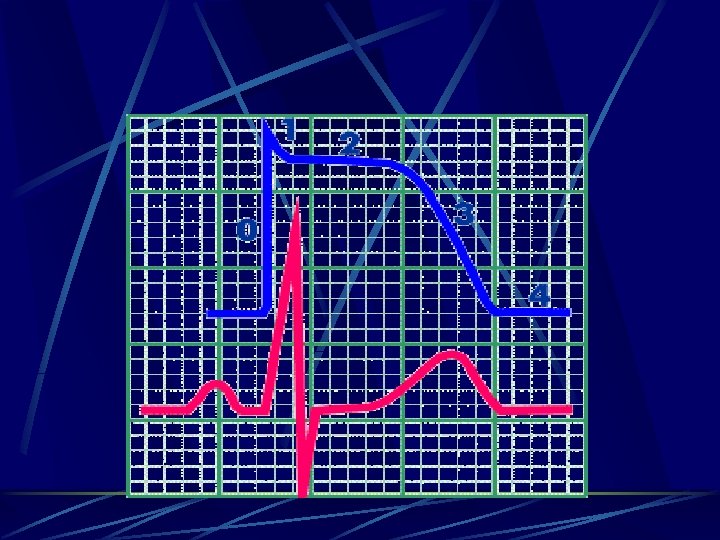
Figure 1 M 0. Electrophysiologic changes during the cardiac cycle, including threshold current, transmembrane potential and ion conductances over time. The circled numbers identify the five phases of the process.
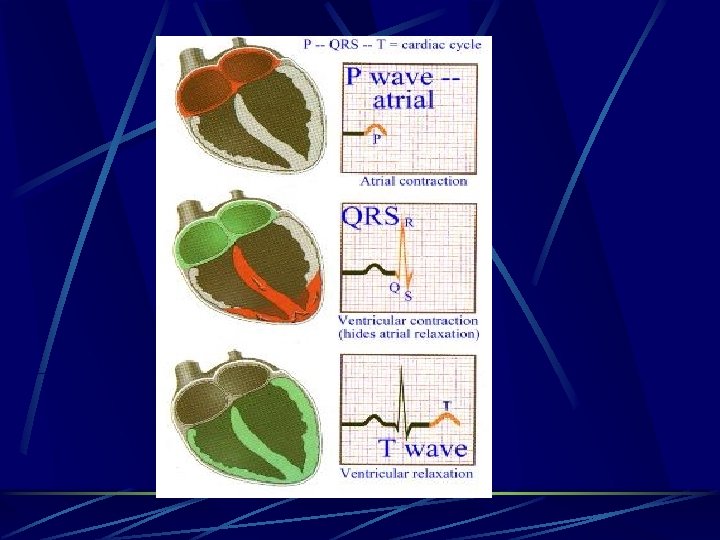
The 5 Phases of Myocardial Cell Electrophysiology (follower cells only): Phase 4 Polarized Cell; (-) inside, (+) outside; due mainly to Na+ & K+ ion positioning and higher permeability of membrane to K+, allowing loss of intracellular (+) charge. Phase 0 Cell Depolarization; greatly increased membrane permeabilty to Na+ ions, which rush in through fast channels, down conc. gradient, reversing cell polarity (fast current). Phase 1 Partial Repolarization; loss of Na+ conductance, & transient influx of Clions and outflow K+ ions. Phase 2 Plateau; due to the slow inward flow of Ca++ ions through slow channels (i. e. increased Ca++ conductance) (also some inward movement of Na+ through slow channels and outward movement of K+). Phase 2 includes most of the absolute refractory period. Phase 3 Rapid Repolarization; decreased Ca++ conductance and increased K+ conductance, thus K+ moves out; inside of cell again becomes (-) relative to outside; Na+/K+ pump re-establishes distribution of ions. Supranormal excitabilty present early in phase 3, thus greatest chance of ectopic beat.
Table 6. HIERARCHY OF PACEMAKERS BASED ON INTRINSIC FIRING RATES ________________ l l l Sinoatrial Node. . . . 70 per min. Atrioventricular Node. . . . 60 per min. Ventricle. . . . . 30 -40 per min. _________________
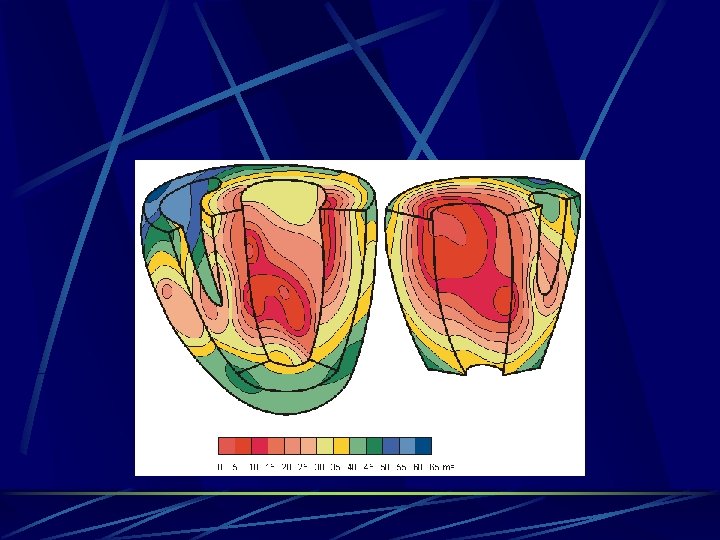
Figure 7. Sequence of depolarization / repolarization of the heart.
Figure 2. Sequence of cardiac excitation and associated changes in the ECG.
Figure 3. The Einthoven Triangle, showing Leads I, II and III.
Figure 4. A moving dipole and how it is "sensed" in front, behind at oblique angles
Figure 11. Configuration of the standard limb leads, situated in the frontal (coronal) plane.
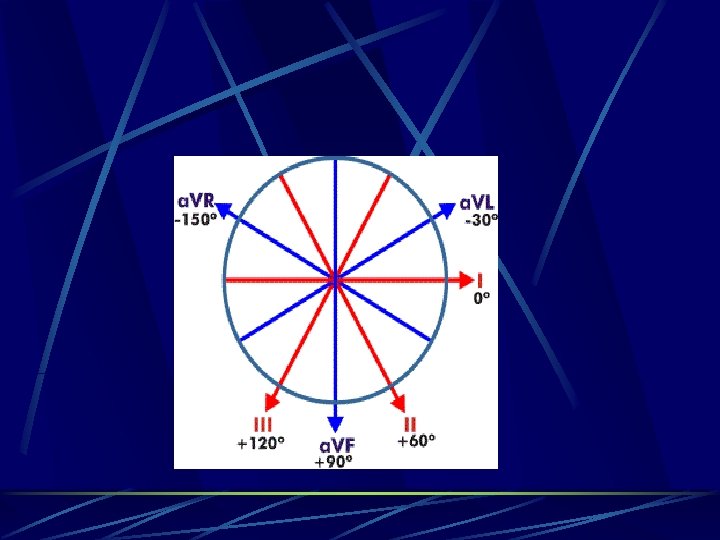
Figure 12. Configuration of the augmented limb leads, situated in the frontal (coronal) plane.
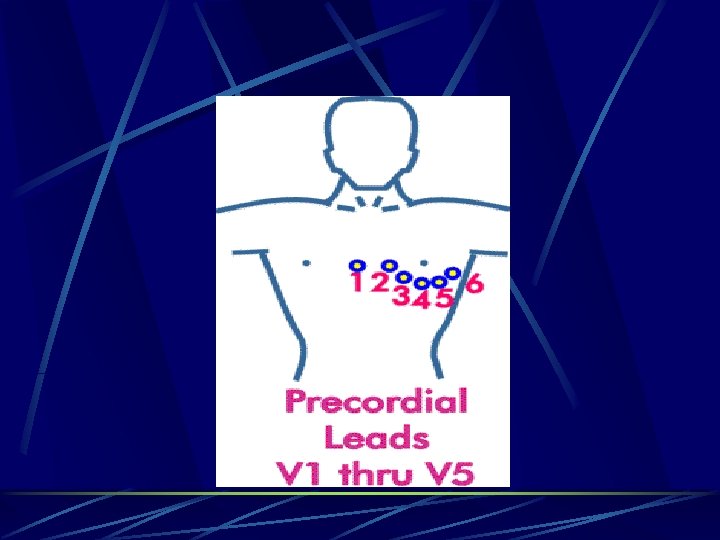
Figure 13. Configuration of the precordial (chest) leads, situated in the transverse (horizontal) plane.
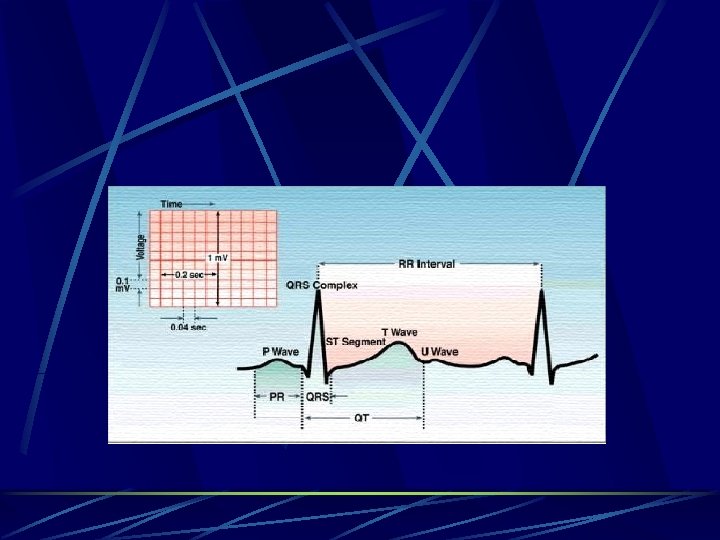
Figure 5. Standard terminology for the ECG (Lead a. Vf, 75 beats/min. ).
Figures 9. Method for accurately determining mean electrical axis of the heart (ventricles) - Step 1.
Figures 10. Method for accurately determining mean electrical axis of the heart (ventricles) - Step 2. Go to Step 1
Figure 8. Electrocardiograms of two individuals, one sedentary and one an endurance athlete (Standard paper speed 25 mm/sec. , large horizontal squares 200 msec. , small squares 40 msec. )
Figure 6. Comparison of the ECG's of an office worker and an athlete. (Standard paper speed 25 mm/sec. , large horizontal squares 200 msec. , small squares 40 msec. )
Figure 14. Normal sinus rhythm. Impulses originate at the SA node at the normal rate. All complexes are evenly spaced; rate 60 - 100/min. PR interval 120 - 200 msec
Figure 15. Sinus bradycardia. Impulses originate at the SA node at a slow rate. All complexes are normal, evenly spaced; rate <60/min. PR interval 120 - 200 msec.
Figure 16. First degree AV block. Fixed but prolonged PR interval. P wave precedes each QRS complex but PR interval, although uniform, is >0. 2 sec. (>5 small boxes).
Figure 17. Second-degree heart block: Mobitz I or Wenchebach. Progressive lengthening of the PR interval with intermittent dropped beats.
Figure 21. Third-degree (complete) heart (AV) block. There is no relationship between P waves and QRS complexes: QRS rate is slower than P wave rate. Impulses originate at both the SA node (P waves) and below the site of block in the AV node (junctional rhythm) conducting to the ventricles. Atria and ventricles depolarize independently, QRS complexes are less frequent; regular at 20 to 40/min but normal in shape
Figure 22. Third-degree (complete) heart (AV) block. There is no relationship between P waves and QRS complexes: QRS rate is slower than P wave rate. Impulses originate at SA node (P waves) and also below the site of block in ventricles (idioventricular rhythm). Atria and ventricles depolarize independently, QRS complexes are less frequent; regular at 20 to 40/min but wide and abnormal in shape.
Figure 18. Junctional rhythm. Impulses originate in the AV node or AV junctional tissue, with retrograde and antegrade transmission. In this example, retrograde transmission is taking place into the atria, giving an inverted P wave. The ventricular rate is slower than with sinus rhythm and the QRS is narrow. If there is also sinus node depolarization, a normal-appearing P wave may be present. If a wandering pacemaker is present in the atria, inverted P waves can precede the QRS complex
Figure 19. Idioventricular rhythm. No P waves (ventricular impulse origin). Rate <40 / min. ; QRS > 0. 10 sec.
Figure 20. Intraventricular conduction defect (IVCD), including right or left bundle branch block. Wide QRS (2 -1/2 small boxes), often notched, preceded by P wave with normal PR interval.
Figure 23. Wandering atrial pacemaker. Impulses originate from varying points in atria. Variation in wave contour, PR interval, PP and thus RR intervals.
Figure 24. Atrial flutter. Impulses travel in circular course in atria, setting up regular, rapid (220 to 300/min. ) flutter (F) waves without any isoelectric baseline. Ventricular rate (QRS) is regular or irregular and slower depending upon the degree of block.
Figure 25. Atrial fibrillation - impulses take random, chaotic pathways in atria. Baseline coarsely or finely irregular; P waves absent. Ventricular response (QRS) irregular, slow or rapid
Figure 26. Ventricular tachycardia. Arrow shows slowed conduction in the margin of the ischemic area, which permits a circular course of impulses and reentry with rapid repetitive depolarization.
Figure 27. Ventricular fibrillation.
Figure 28. The effect of increases in serum K concentration on the ECG
the end