Cardiovascular Physiology Heart Cardiac Cycle The Cardiac Cycle


- Slides: 26

Cardiovascular Physiology: Heart Cardiac Cycle

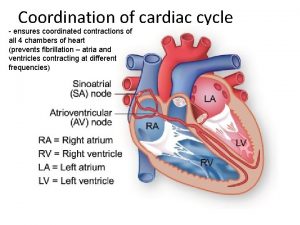
The Cardiac Cycle Cardiac cycle = the period between the start of one heartbeat and the beginning of the next § Consists of systole + diastole § Systole=contraction § Diastole=relaxation

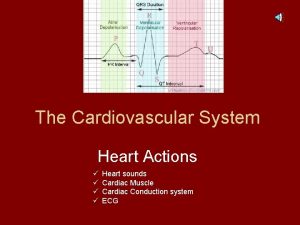
The Cardiac Cycle § Correlate the EKG with systole + diastole of the heart § Electrical events occur before mechanical contraction § EKG animation Copyright © 2009 Pearson Education, Inc. , publishing as Pearson Benjamin Cummings

The Cardiac Cycle Atrial Cardiac Cycle 1. Atria passively fill (end of diastole) 2. Atria isovolumetrically contract (start of systole) 3. Atria eject blood into ventricles (end of systole) 4. Atria relax (start of diastole) Ventricular Cardiac Cycle 1. Ventricles passively fill as atria fill and contract (end of diastole) 2. -4. Same steps as above

The Cardiac Cycle

Blood Flow and Pressure § During systole blood pressure increases § During diastole blood pressure decreases § Blood flows from high low pressure § Contractions and valves dictate blood flow through the heart

The Cardiac Cycle § Start at ventricular diastole and left side of heart (highest pressure values) § Blood flows from high low pressure § Contractions and valves dictate blood flow § Blood pressure in each chamber rises during systole and falls during diastoles

Isovolumetric contraction Ventricular ejection Atrial contraction Isovolumetric relaxation Ventricular filling Left atrium Right ventricle Left ventricle Ventricular filling Systole Early diastole Mid-to-late diastole Phase 1 2 3 4 volume (m. L) Pressure (mm Hg) Atrioventricular valves Open Closed Aortic and pulmonary Closed Open (semilunar) valves 110 Open Closed Aortic pressure 70 40 Atrial pressure Ventricular pressure 0 130 100 60 Heart sounds Electrocardiogram Copyright © 2011 Pearson Education, Inc. 1 Ventricular volume

The Cardiac Cycle 1. Ventricular Filling (Phase 1 on diagram) § Blood relaxed atria atrioventricular valves ventricles § Driven by pressure in veins (venous return) § Atria contract more blood in ventricles atria diastole § and ventricular systole begins 2. Isovolumetric Contraction (Phase 2) § Ventricles start to contract (systole) § Ventricular pressure > atrial pressure AV valves close § Semilunar valves are closed because ventricular pressure < pulmonary + aortic arterial pressures § So, no blood flowing=isovolumetric-same volume

The Cardiac Cycle 3. Ventricular Ejection (Phase 3) § Ventricles continue contracting § Ventricular pressure > aortic pressure § Blood aorta + pulmonary arteries (ventricular ejection) 4. Isovolumetric Relaxation (Phase 4) § Eventually ventricular pressure < aortic pressure semilunar valves close—start of diastole § All valves are closed so some blood is still in ventricles as they relax § Ventricular pressure < atrial pressure so AV valves open and ventricle passively fill with blood until they contract again

Ventricular Pressure Copyright © 2011 Pearson Education, Inc.

Aortic Pressure Copyright © 2011 Pearson Education, Inc.

Aortic Pressure § During ventricular contraction the aorta stored energy by stretching (pressure reservoir) § During ventricular diastole aorta releases pressure to maintain blood flow to body § This is why aortic pressure is higher than ventricular pressure during diastole § MAP=profusion pressure to organs § Dicrotic notch shows semilunar valves closing

Heart Sounds **Heart Murmur=sounds produced by regurgitation through valves Copyright © 2011 Pearson Education, Inc.

Changes in Ventricular Volume ** Left ventricle Copyright © 2011 Pearson Education, Inc.

Cardiodynamics Figure 20– 19 A Simple Model of Stroke Volume

Cardiodynamics § The movement and force generated by cardiac contractions § End-diastolic volume (EDV) § End-systolic volume (ESV) § Stroke volume (SV)= volume of blood ejected per beat § SV = EDV – ESV § Ejection fraction § The percentage of EDV represented by SV § Cardiac output (CO) § The volume pumped by left ventricle in 1 minute § CO=SV X HR Copyright © 2009 Pearson

Catecholamines Modulate HR KEY Integrating center Cardiovascular control center in medulla oblongata Efferent path Effector Tissue response Sympathetic neurons (NE or Epi) Parasympathetic neurons (Ach) 1 -receptors of autorhythmic cells Muscarinic receptors of autorhythmic cells Na+ and Ca 2+ influx K+ efflux; Ca 2+ influx Rate of depolarization Hyperpolarizes cell and rate of depolarization Heart rate

Catecholamines Modulate SV Figure 13. 29

Stroke Volume & Starling’s Law Increase EDV by increasing venous return via: • Skeletal muscle pump • Respiratory pump • Sympathetic nervous system • Arterial vasoconstriction Increase stretch of cardiac fibers Increase strength of contraction Increase stroke volume

Starling’s Law Figure 13. 28

Green= w/ adrenergic stimulation Blue= normal Yellow and red= heart failure; increased volume does not equal increase contraction and stroke volume http: //cardiovascres. oxfordjournals. org/content/77/4/627/F 1. expansion

Stroke Volume and Heart Rate Determine Cardiac Output CARDIAC OUTPUT is a function of Heart rate Stroke volume determined by Rate of depolarization in autorhythmic cells Force of contraction in ventricular myocardium is influenced by Decreases Due to parasympathetic innervation Increases increases Contractility Sympathetic innervation and epinephrine increases End-diastolic volume which varies with Venous constriction Venous return aided by Skeletal muscle pump Respiratory pump Figure 14 -31

Arterial Blood Pressure (mm Hg) Pressure in the aorta varies with the cardiac cycle. Two pressure readings: § Systolic blood pressure = maximum pressure § Due to ejection of blood into aorta § Diastolic blood pressure = minimum pressure § Not zero due to elastic recoil of aorta § Normal BP 120/80 mm Hg § Higher than normal= hypertension § Lower than normal= hypotension 24

Arterial blood pressure 25 Figure 14. 8

Blood pressure values: what do they mean? Pulse pressure (PP)= SP-DP § § § Force your heart generates when it contracts Use SP, DP, and PP as indicators of cardiovascular health Patient 1: 120/80; PP=? Patient 2: 140/100; PP=? Who is at greater risk? MAP = DP + 1/3 (SP-DP) § Pressure required to profuse brain, coronary arteries, and kidney with blood > 60 mm Hg CO = MAP TPR CO = SV x HR 26
 Anatomy and physiology unit 7 cardiovascular system
 Refractory period heart
 Heart as a pump physiology
 Events of cardiac cycle class 11
 Cardiac output and heart rate
 Cardiac cycle
 Ecg phases
 Cardiac cycle animation
 Cardiac cycle graph
 Wigger diagram
 Why mba ppt
 Cardiac cycle
 Cardiac cycle
 Atrial systole
 Cardiac cycle
 Heart dullness
 Sheep heart vs human heart
 Heart 2 heart
 Capillary bed labeled
 Riesgo cardiovascular por perimetro abdominal
 Maniobra de azoulay
 What makes up the cardiovascular system
 Rutas integrales de atencion en salud
 Pithed rat meaning
 Fresenius national cardiovascular partners
 Totally tubular dude
 Cardiovascular drift
