
Chapter Opener 9 Figure 9 1 Connective tissue
- Slides: 95
Chapter Opener 9
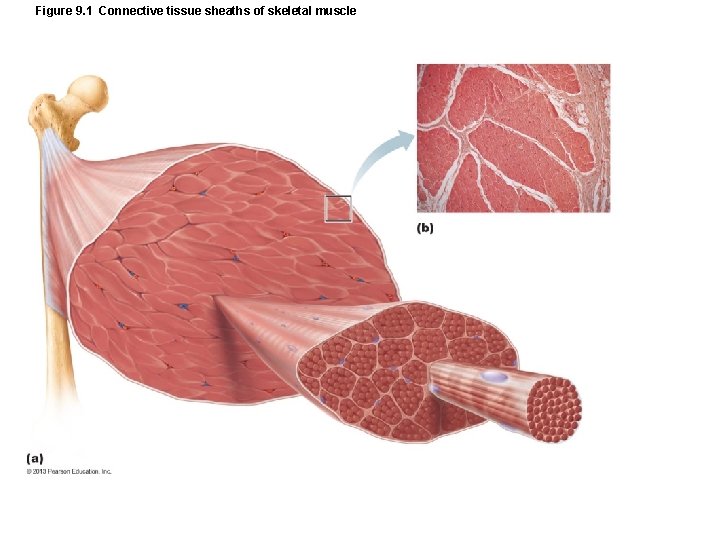
Figure 9. 1 Connective tissue sheaths of skeletal muscle
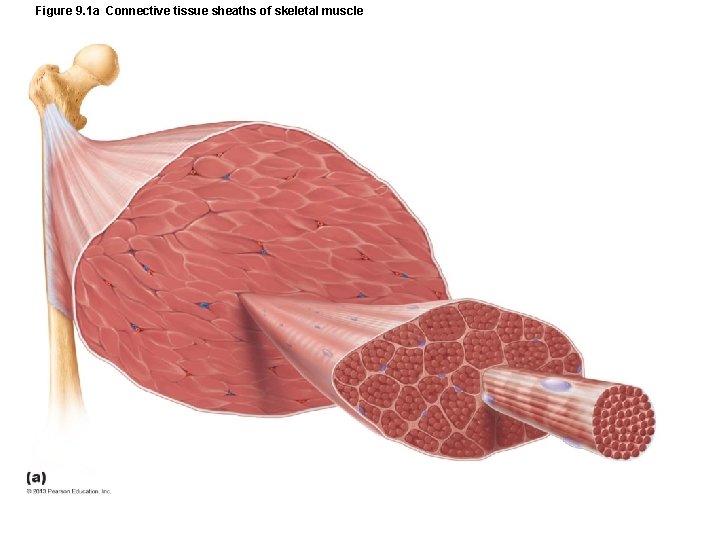
Figure 9. 1 a Connective tissue sheaths of skeletal muscle
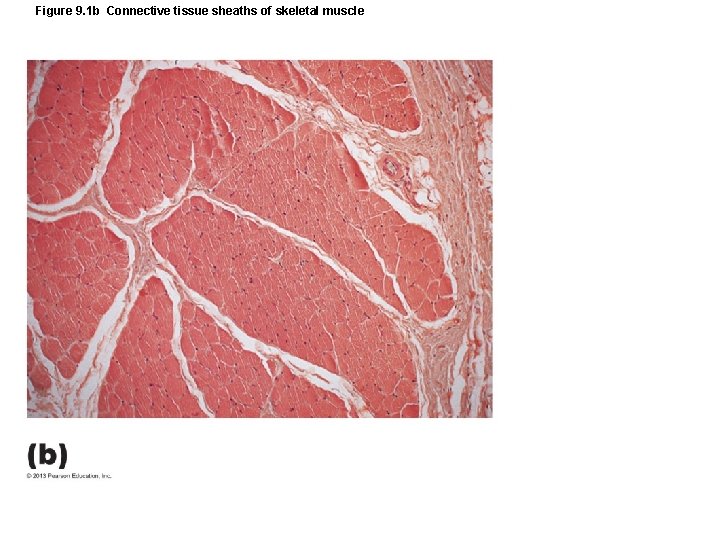
Figure 9. 1 b Connective tissue sheaths of skeletal muscle
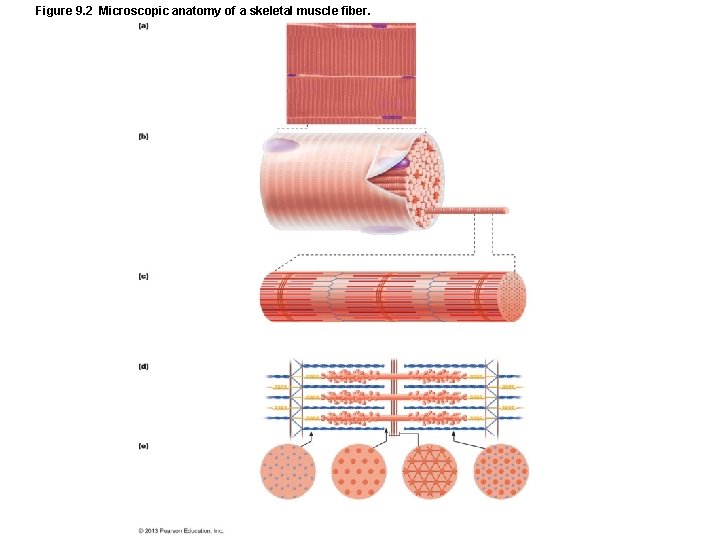
Figure 9. 2 Microscopic anatomy of a skeletal muscle fiber.
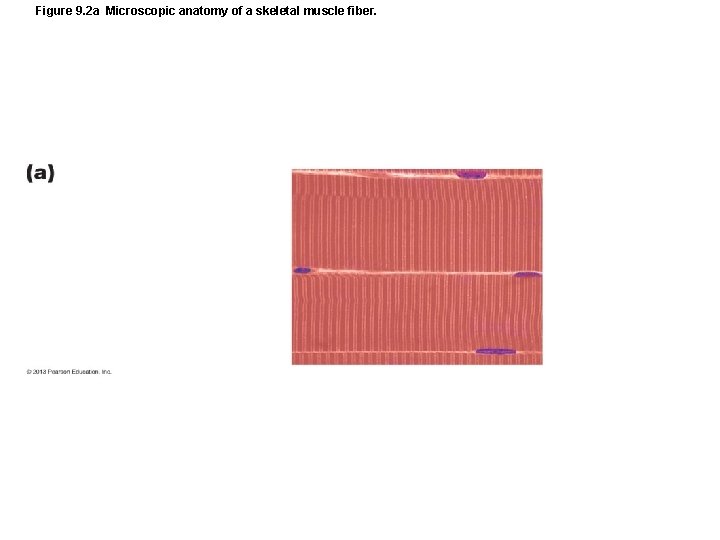
Figure 9. 2 a Microscopic anatomy of a skeletal muscle fiber.
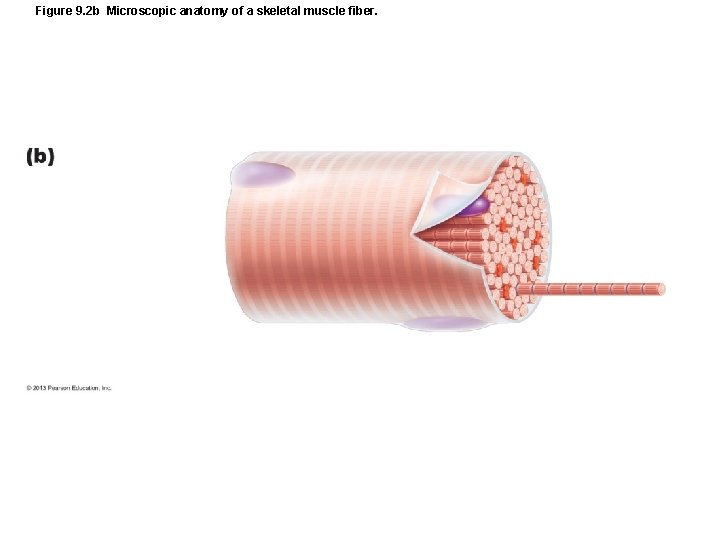
Figure 9. 2 b Microscopic anatomy of a skeletal muscle fiber.
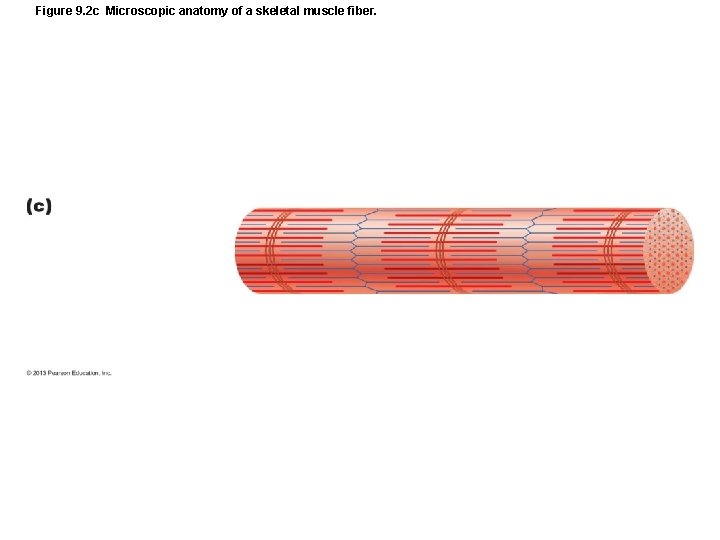
Figure 9. 2 c Microscopic anatomy of a skeletal muscle fiber.
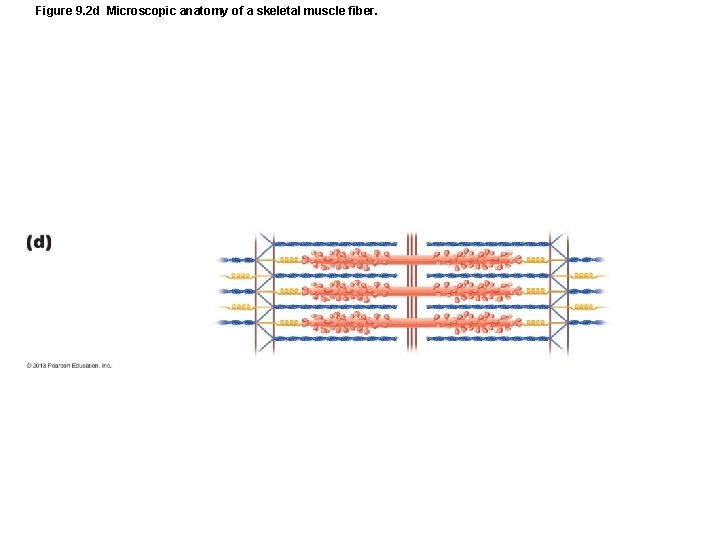
Figure 9. 2 d Microscopic anatomy of a skeletal muscle fiber.
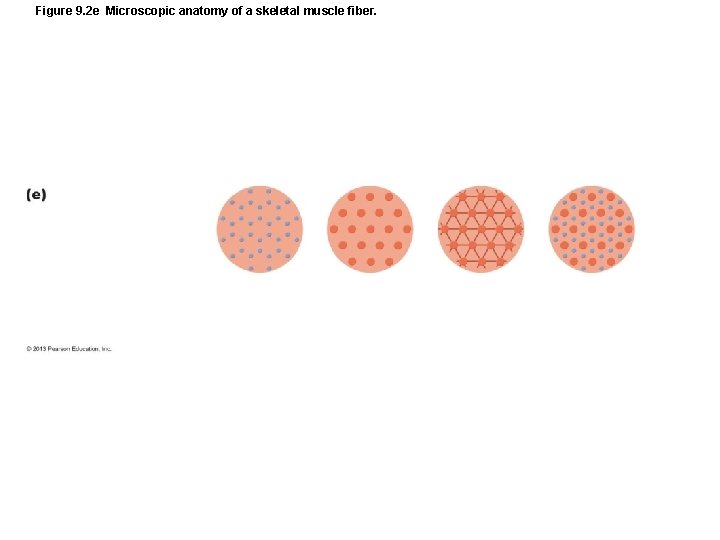
Figure 9. 2 e Microscopic anatomy of a skeletal muscle fiber.
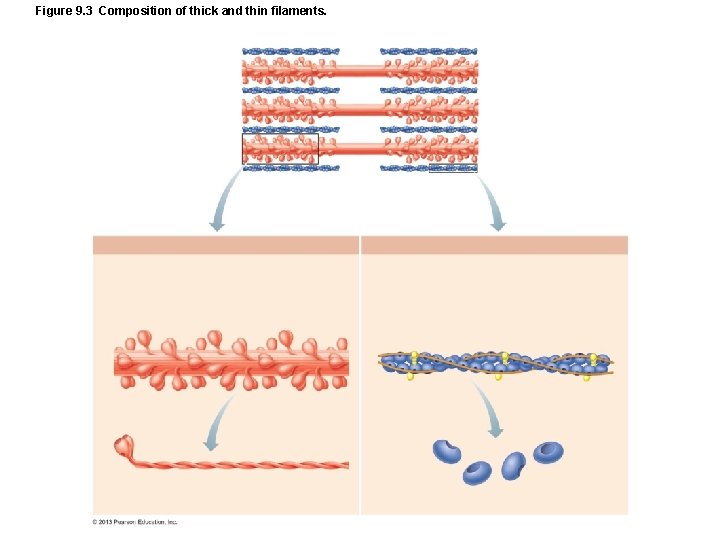
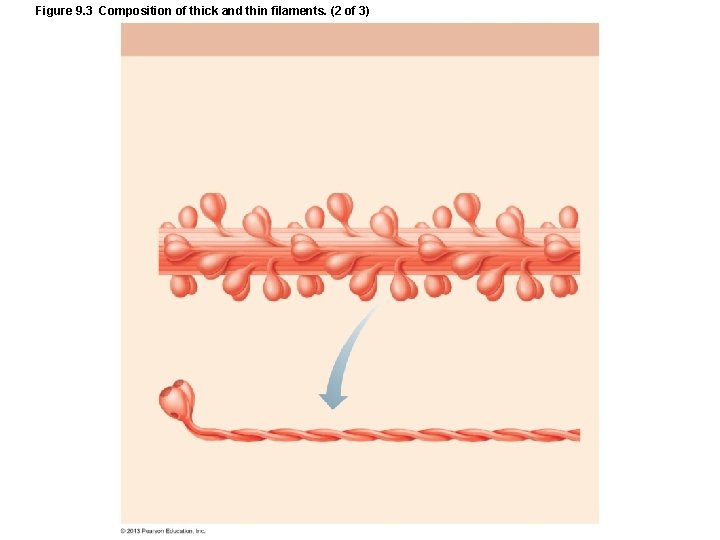
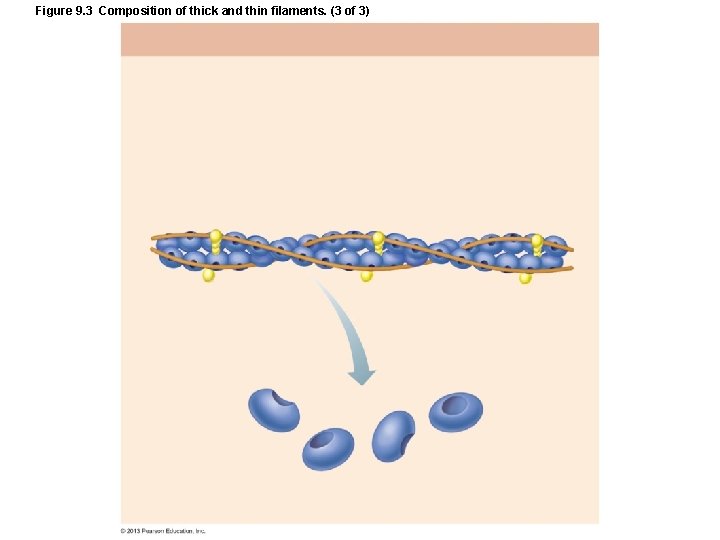
Figure 9. 3 Composition of thick and thin filaments.
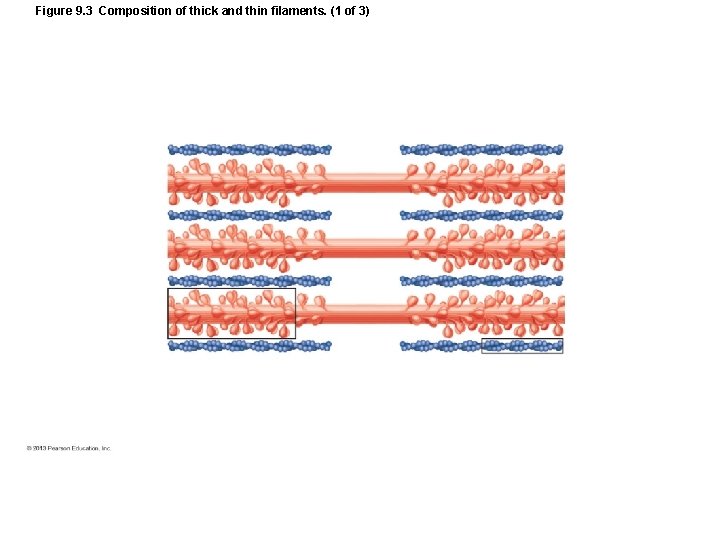
Figure 9. 3 Composition of thick and thin filaments. (1 of 3)
Figure 9. 3 Composition of thick and thin filaments. (2 of 3)
Figure 9. 3 Composition of thick and thin filaments. (3 of 3)
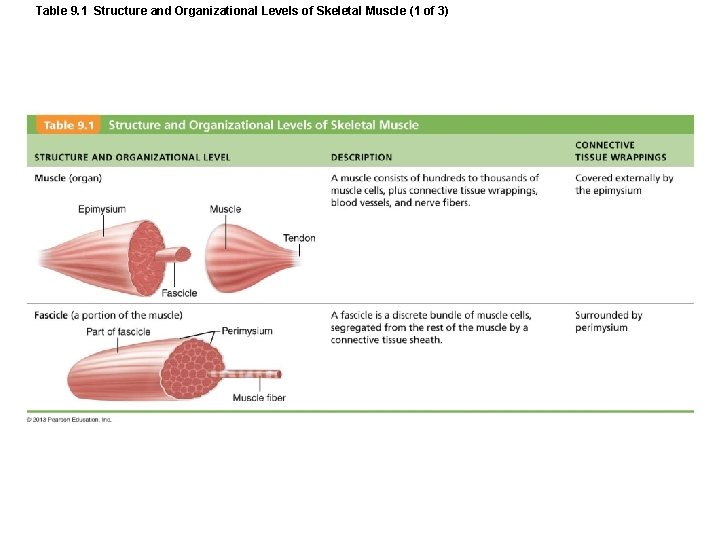
Table 9. 1 Structure and Organizational Levels of Skeletal Muscle (1 of 3)
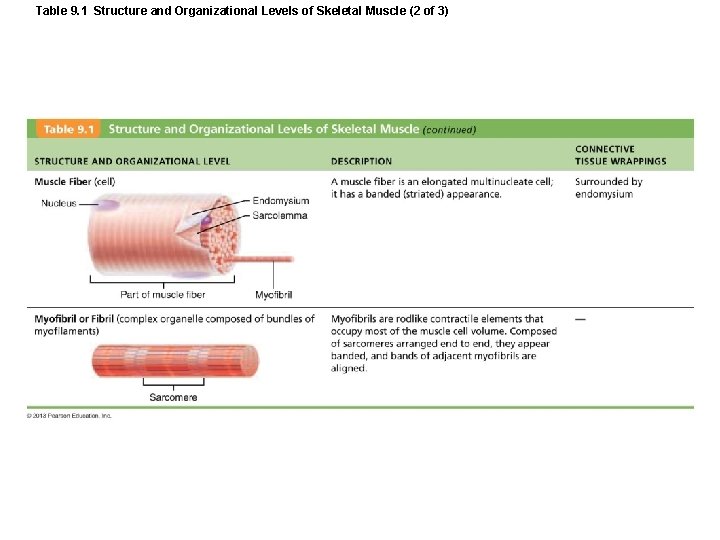
Table 9. 1 Structure and Organizational Levels of Skeletal Muscle (2 of 3)
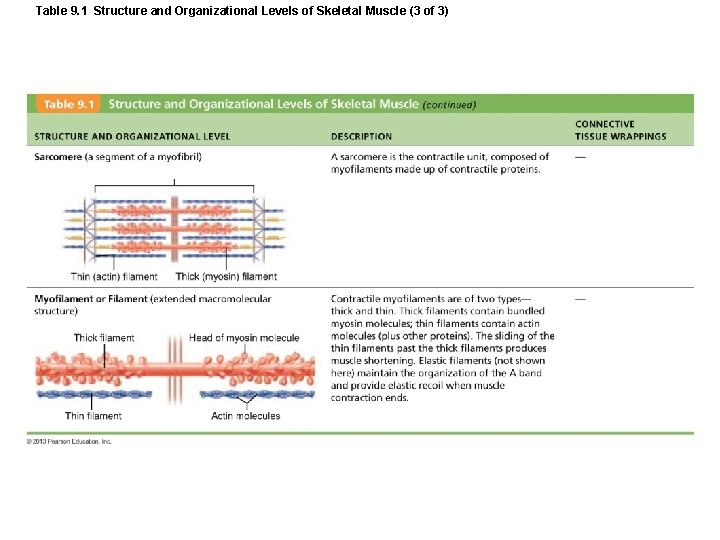
Table 9. 1 Structure and Organizational Levels of Skeletal Muscle (3 of 3)
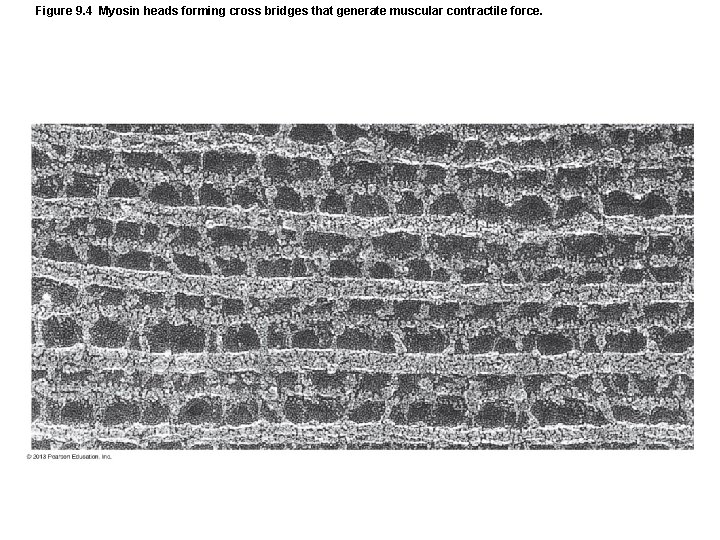
Figure 9. 4 Myosin heads forming cross bridges that generate muscular contractile force.
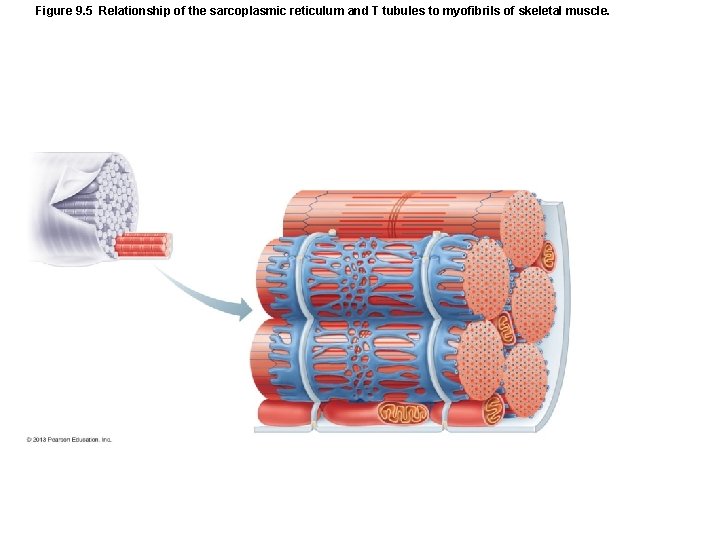
Figure 9. 5 Relationship of the sarcoplasmic reticulum and T tubules to myofibrils of skeletal muscle.
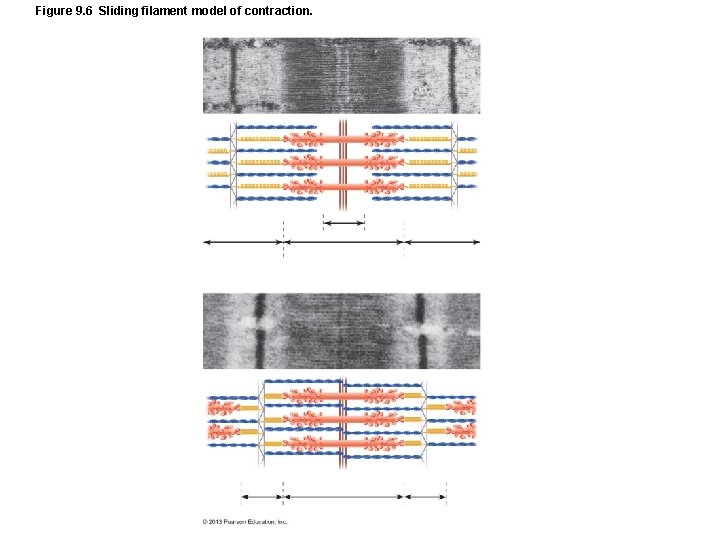
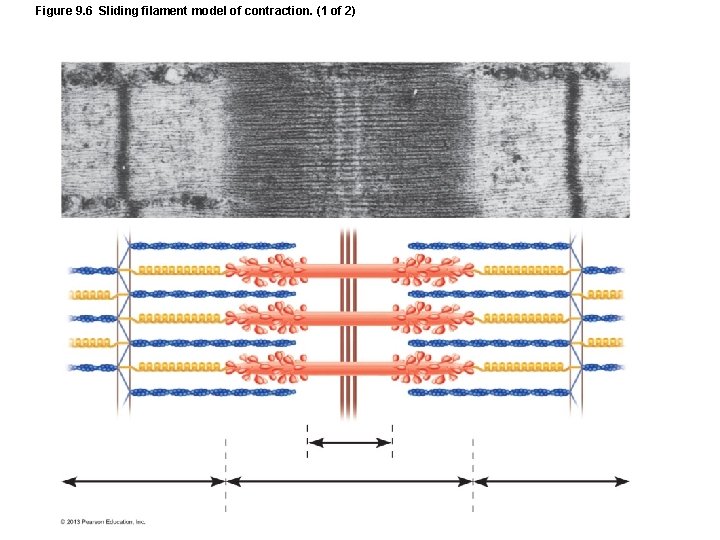
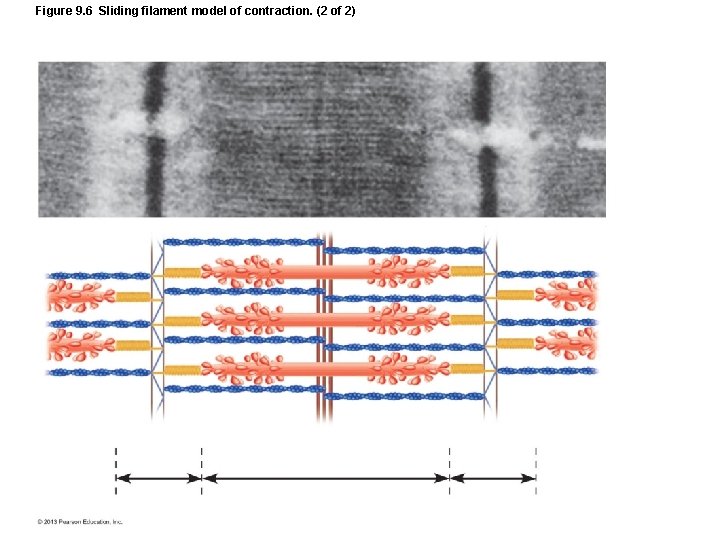
Figure 9. 6 Sliding filament model of contraction.
Figure 9. 6 Sliding filament model of contraction. (1 of 2)
Figure 9. 6 Sliding filament model of contraction. (2 of 2)
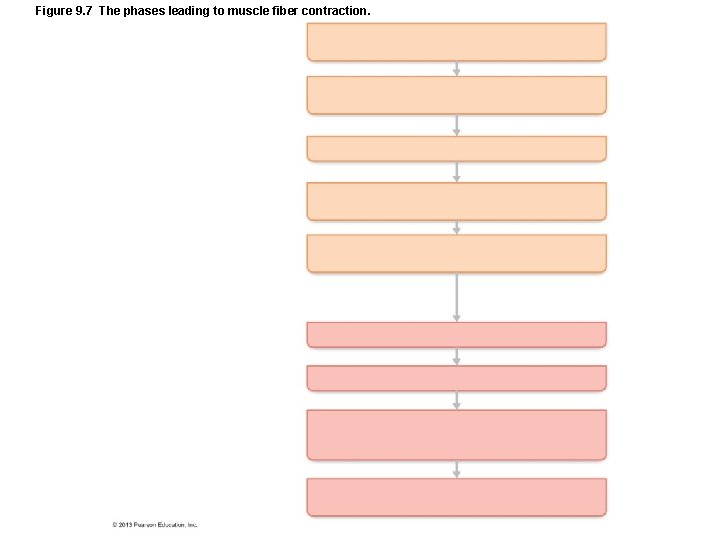
Figure 9. 7 The phases leading to muscle fiber contraction.
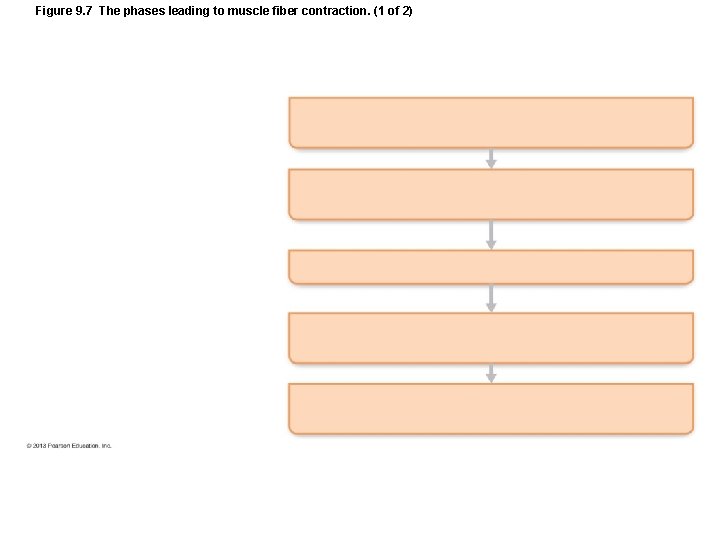
Figure 9. 7 The phases leading to muscle fiber contraction. (1 of 2)
Figure 9. 7 The phases leading to muscle fiber contraction. (2 of 2)
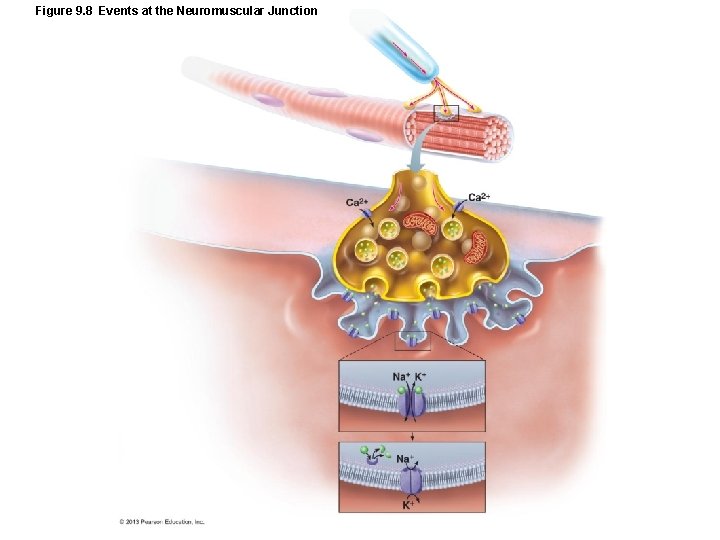
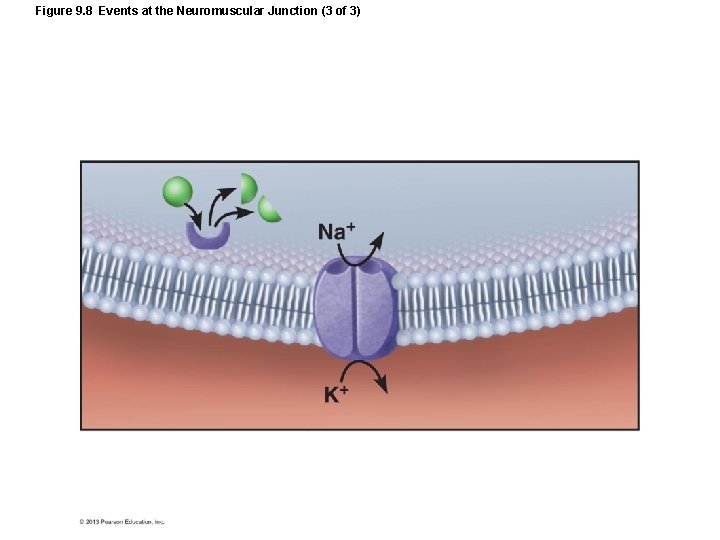
Figure 9. 8 Events at the Neuromuscular Junction
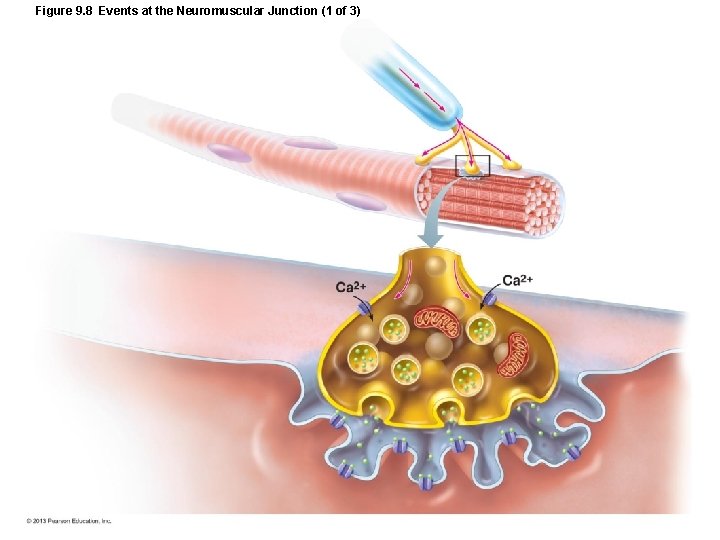
Figure 9. 8 Events at the Neuromuscular Junction (1 of 3)
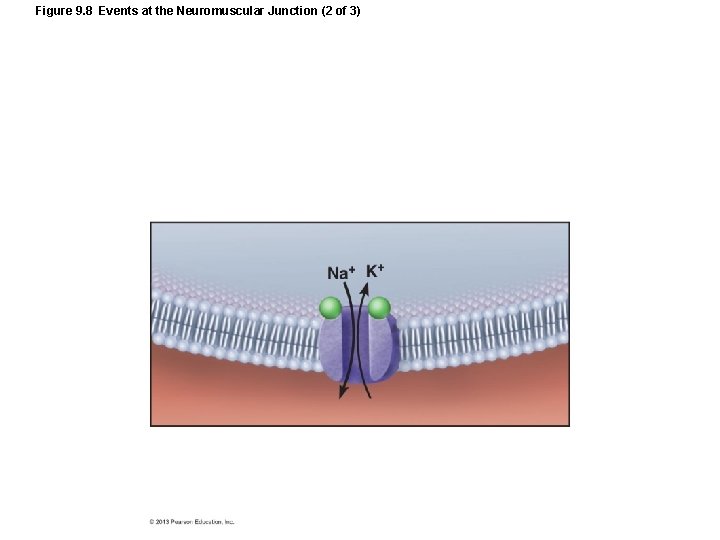
Figure 9. 8 Events at the Neuromuscular Junction (2 of 3)
Figure 9. 8 Events at the Neuromuscular Junction (3 of 3)
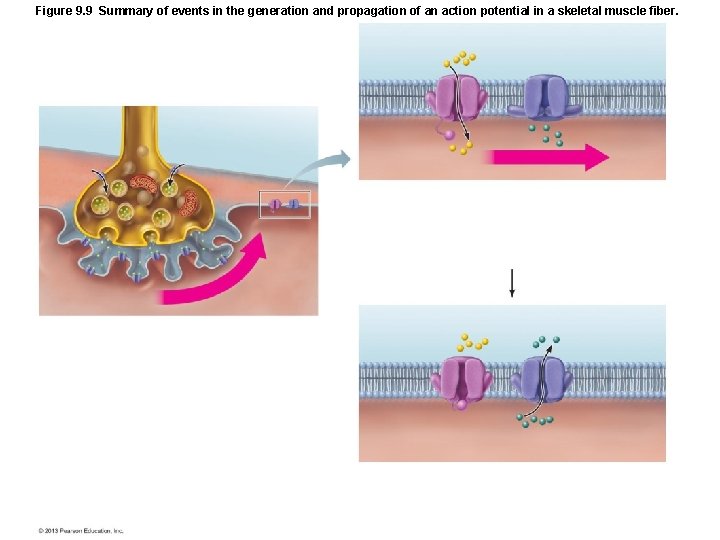
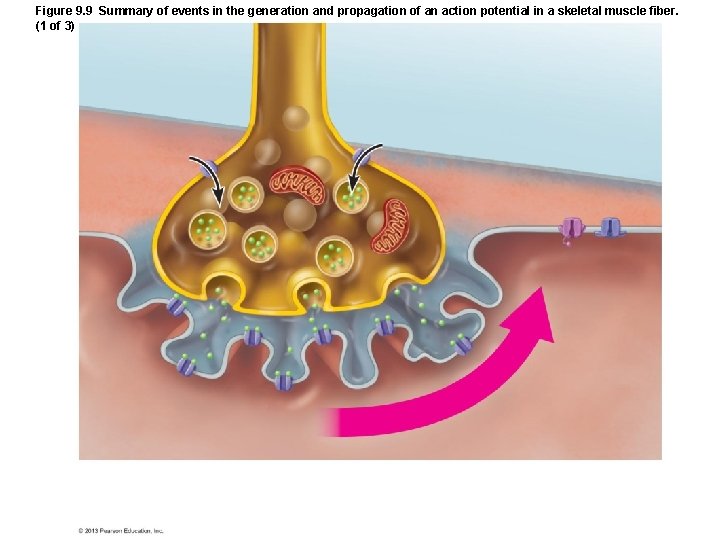
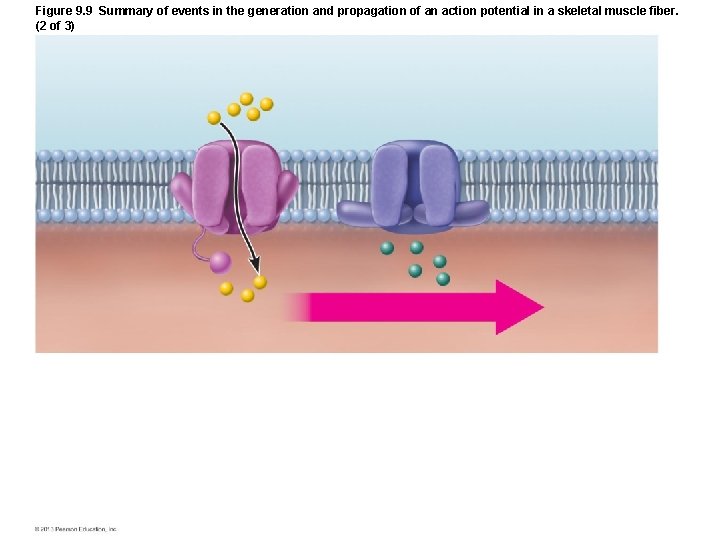
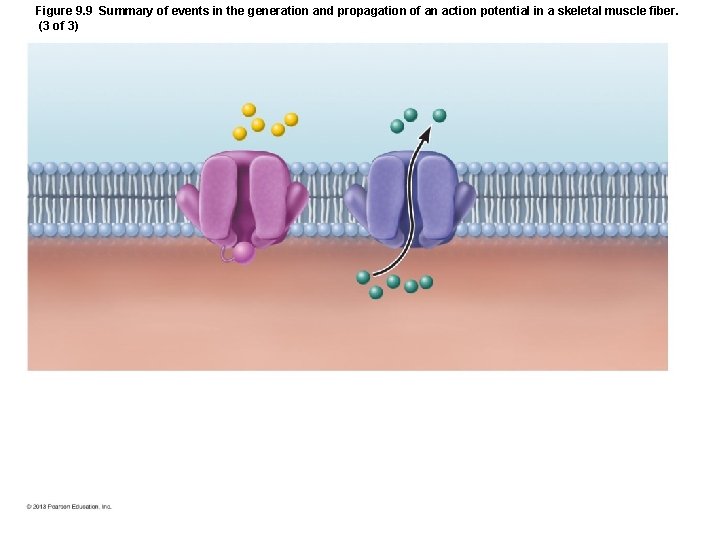
Figure 9. 9 Summary of events in the generation and propagation of an action potential in a skeletal muscle fiber.
Figure 9. 9 Summary of events in the generation and propagation of an action potential in a skeletal muscle fiber. (1 of 3)
Figure 9. 9 Summary of events in the generation and propagation of an action potential in a skeletal muscle fiber. (2 of 3)
Figure 9. 9 Summary of events in the generation and propagation of an action potential in a skeletal muscle fiber. (3 of 3)
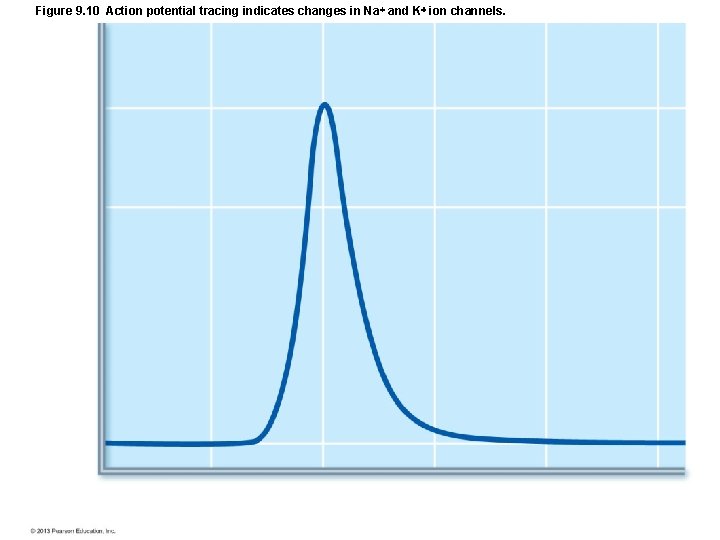
Figure 9. 10 Action potential tracing indicates changes in Na and K ion channels.
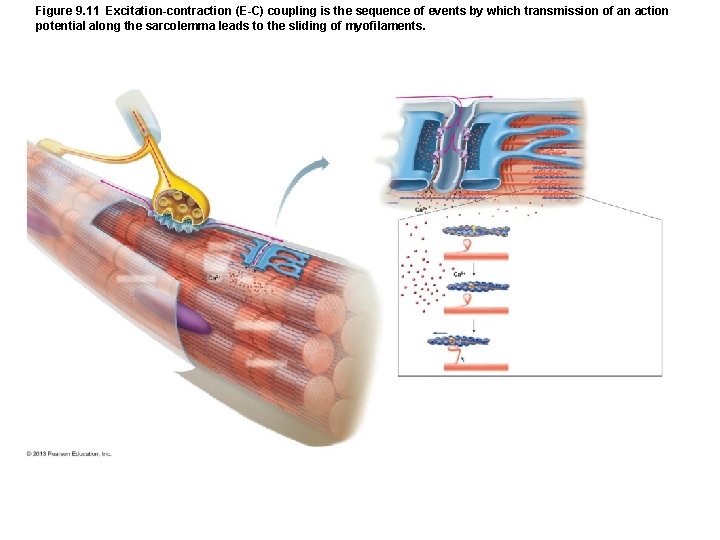
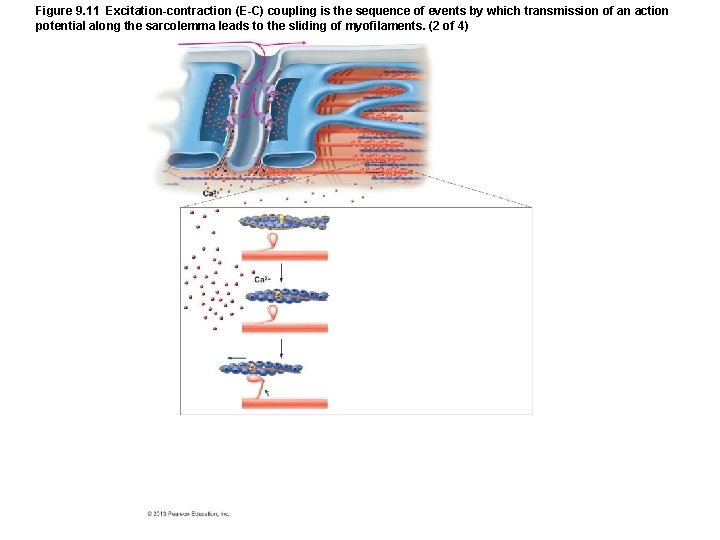
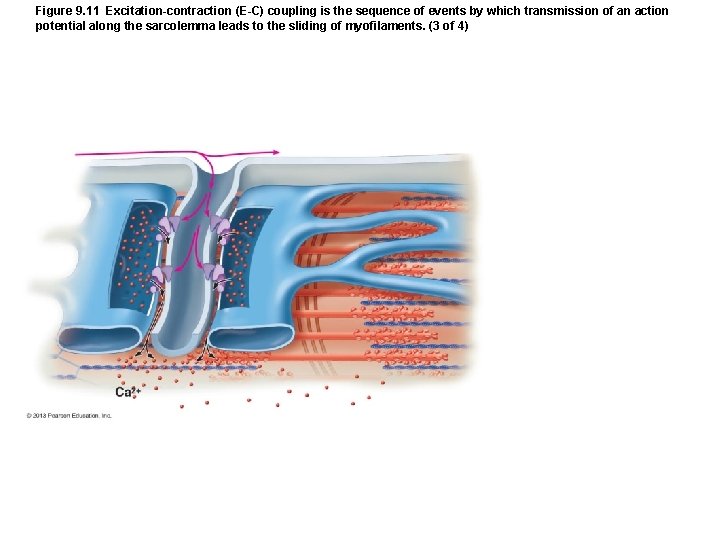
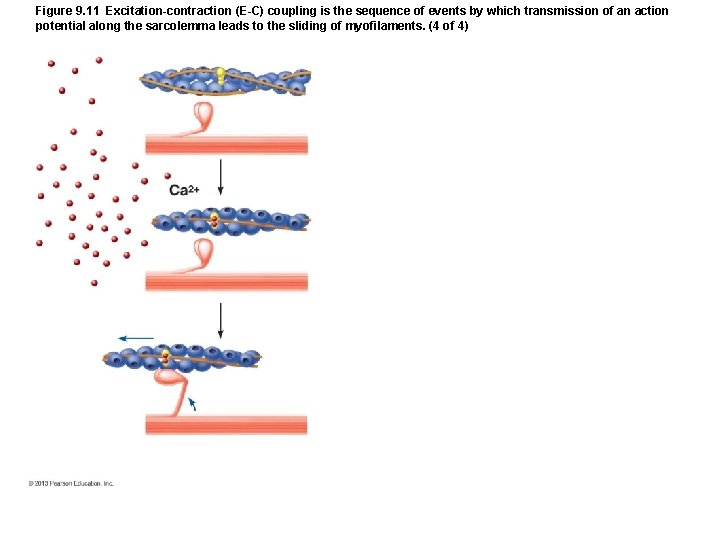
Figure 9. 11 Excitation-contraction (E-C) coupling is the sequence of events by which transmission of an action potential along the sarcolemma leads to the sliding of myofilaments.
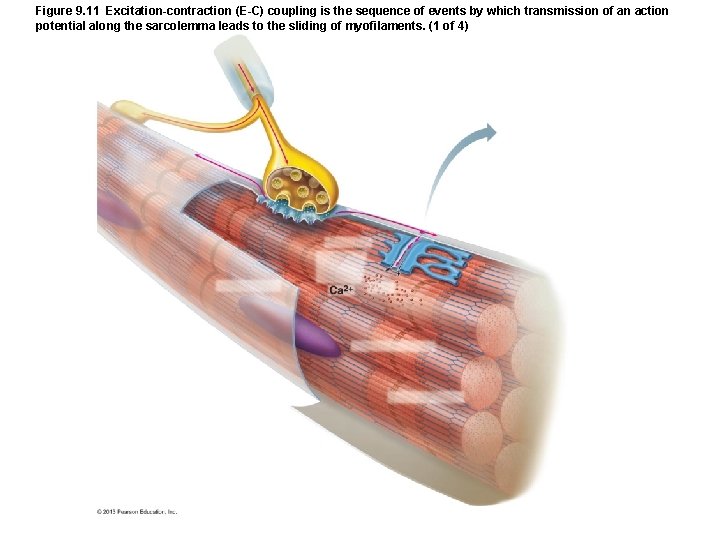
Figure 9. 11 Excitation-contraction (E-C) coupling is the sequence of events by which transmission of an action potential along the sarcolemma leads to the sliding of myofilaments. (1 of 4)
Figure 9. 11 Excitation-contraction (E-C) coupling is the sequence of events by which transmission of an action potential along the sarcolemma leads to the sliding of myofilaments. (2 of 4)
Figure 9. 11 Excitation-contraction (E-C) coupling is the sequence of events by which transmission of an action potential along the sarcolemma leads to the sliding of myofilaments. (3 of 4)
Figure 9. 11 Excitation-contraction (E-C) coupling is the sequence of events by which transmission of an action potential along the sarcolemma leads to the sliding of myofilaments. (4 of 4)
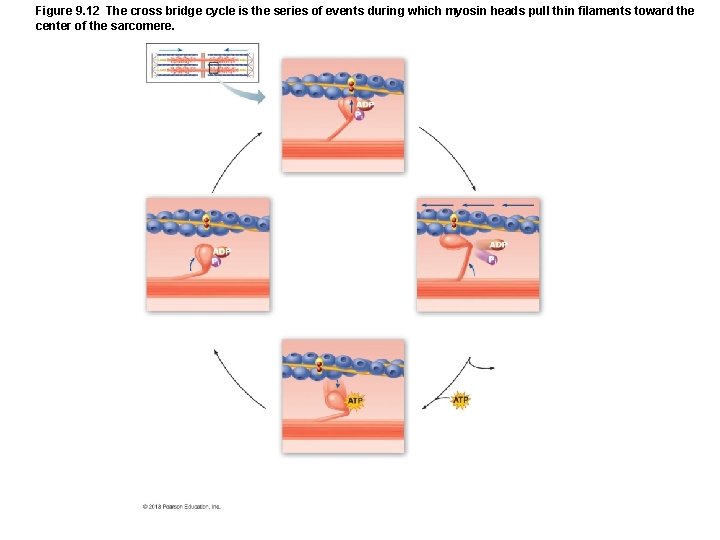
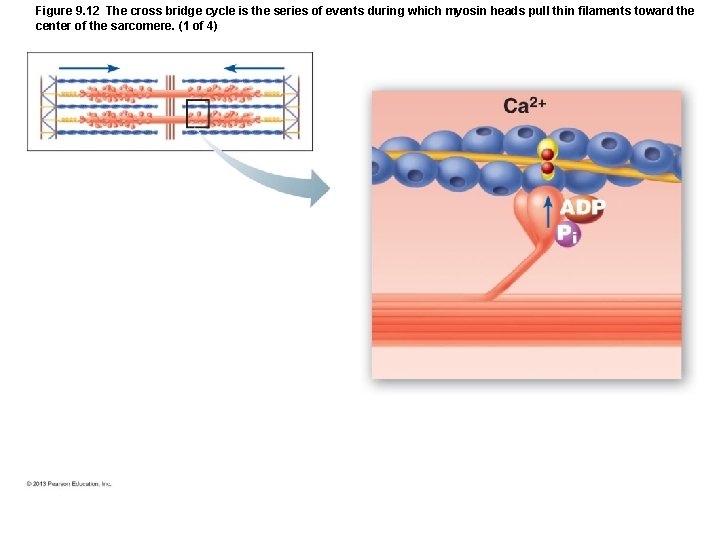
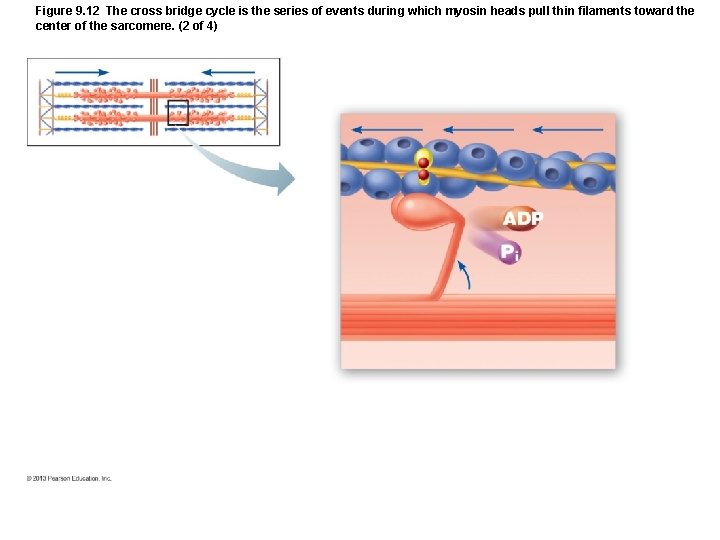
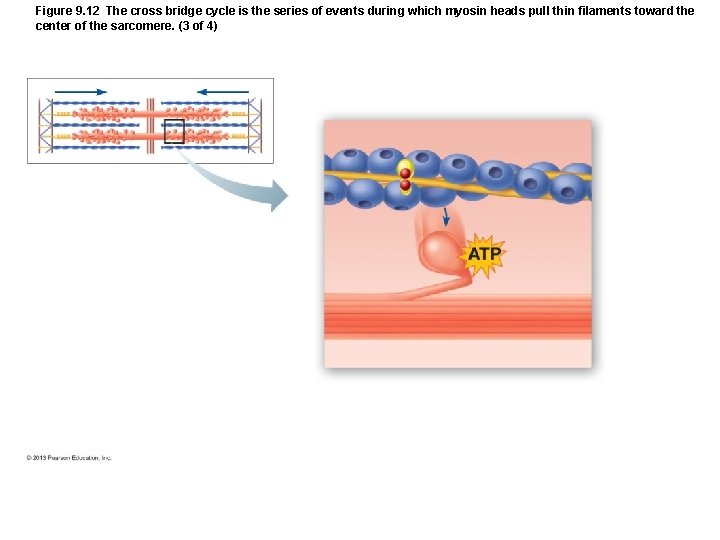
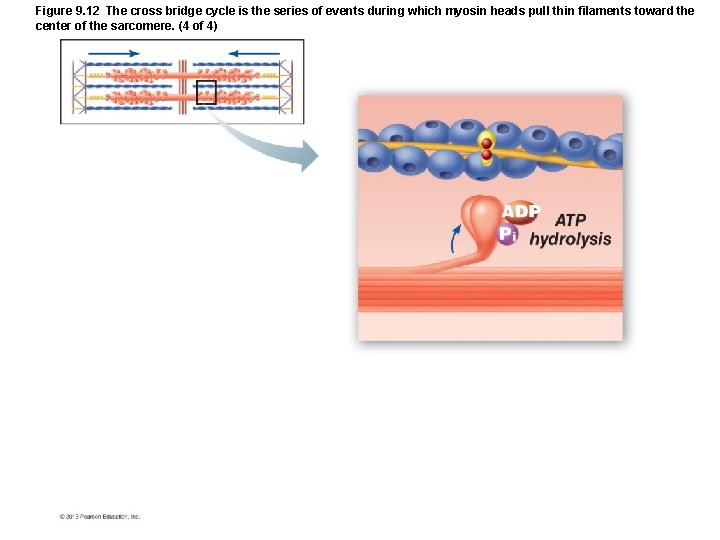
Figure 9. 12 The cross bridge cycle is the series of events during which myosin heads pull thin filaments toward the center of the sarcomere.
Figure 9. 12 The cross bridge cycle is the series of events during which myosin heads pull thin filaments toward the center of the sarcomere. (1 of 4)
Figure 9. 12 The cross bridge cycle is the series of events during which myosin heads pull thin filaments toward the center of the sarcomere. (2 of 4)
Figure 9. 12 The cross bridge cycle is the series of events during which myosin heads pull thin filaments toward the center of the sarcomere. (3 of 4)
Figure 9. 12 The cross bridge cycle is the series of events during which myosin heads pull thin filaments toward the center of the sarcomere. (4 of 4)
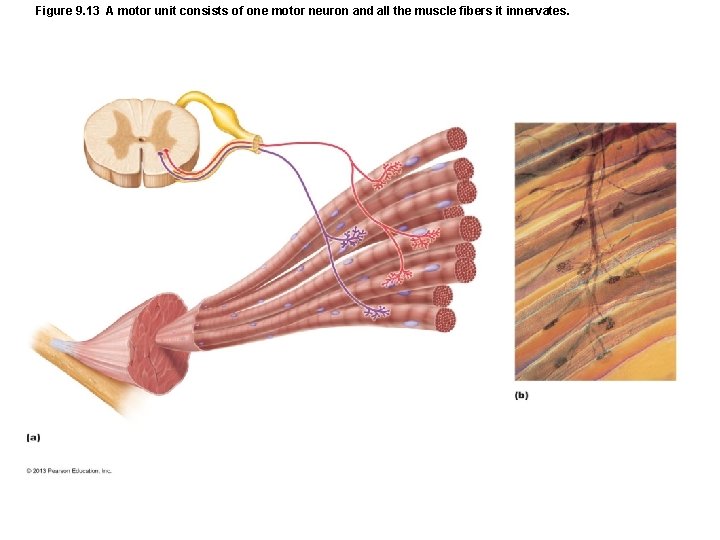
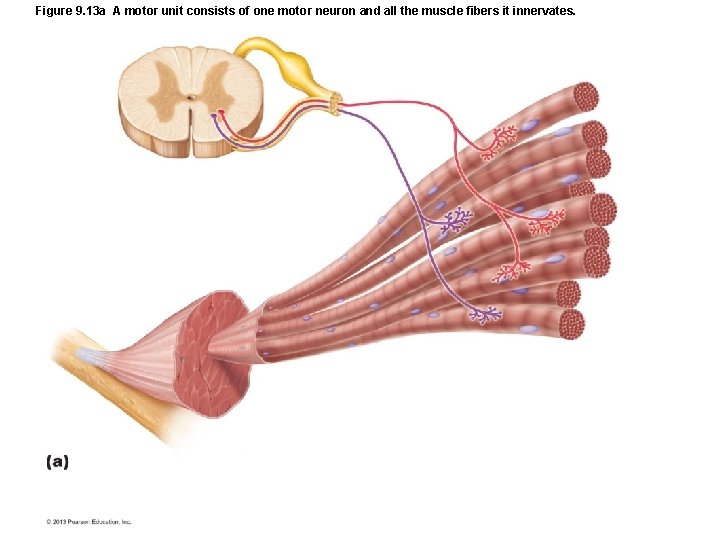
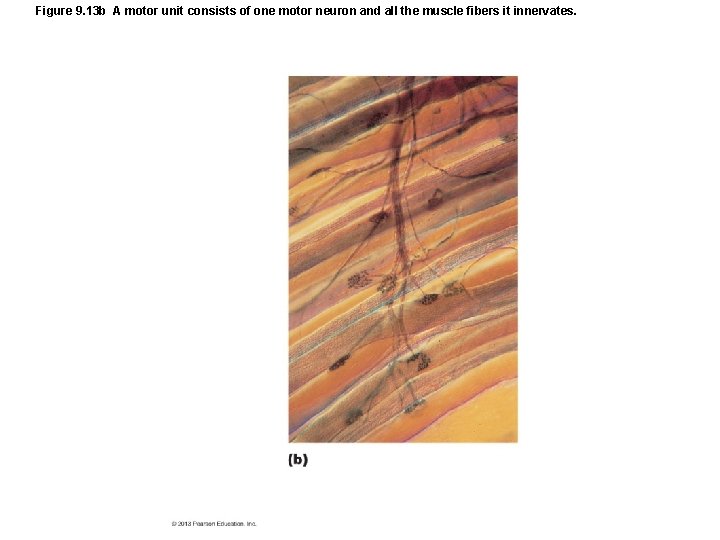
Figure 9. 13 A motor unit consists of one motor neuron and all the muscle fibers it innervates.
Figure 9. 13 a A motor unit consists of one motor neuron and all the muscle fibers it innervates.
Figure 9. 13 b A motor unit consists of one motor neuron and all the muscle fibers it innervates.
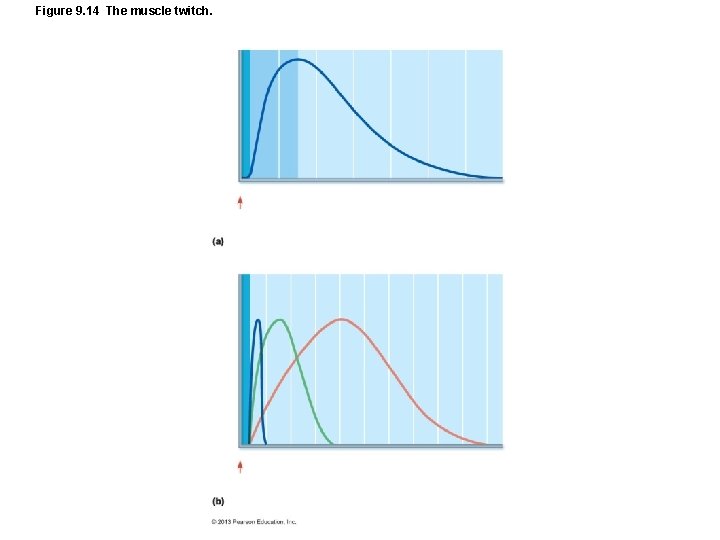
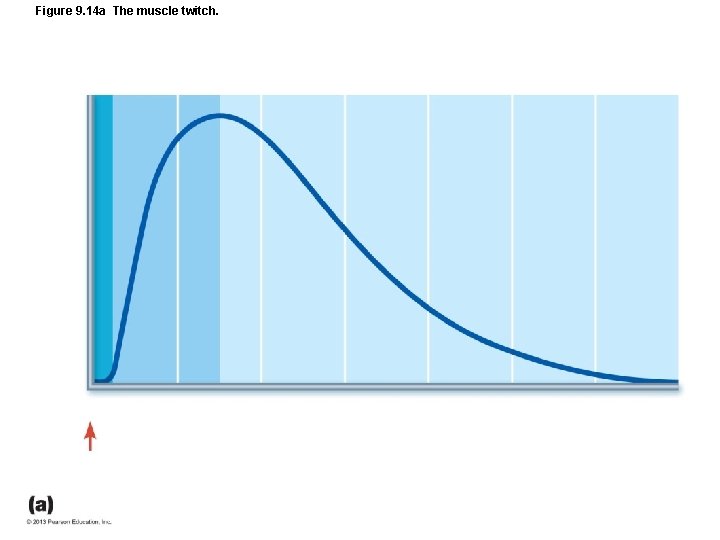
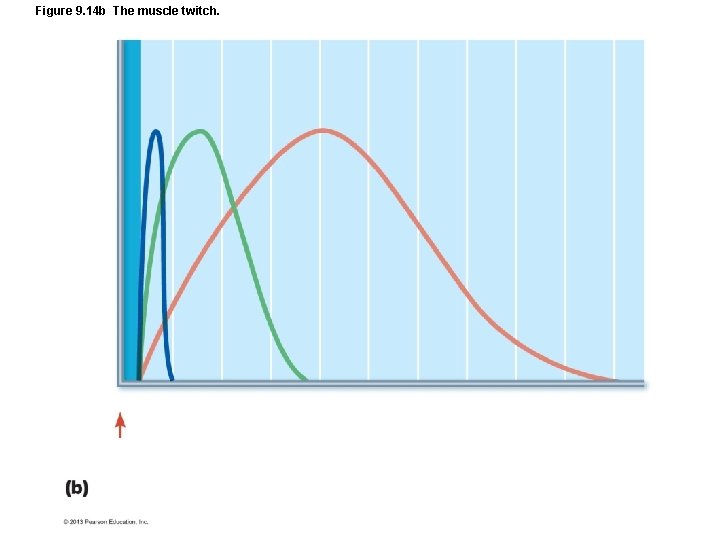
Figure 9. 14 The muscle twitch.
Figure 9. 14 a The muscle twitch.
Figure 9. 14 b The muscle twitch.
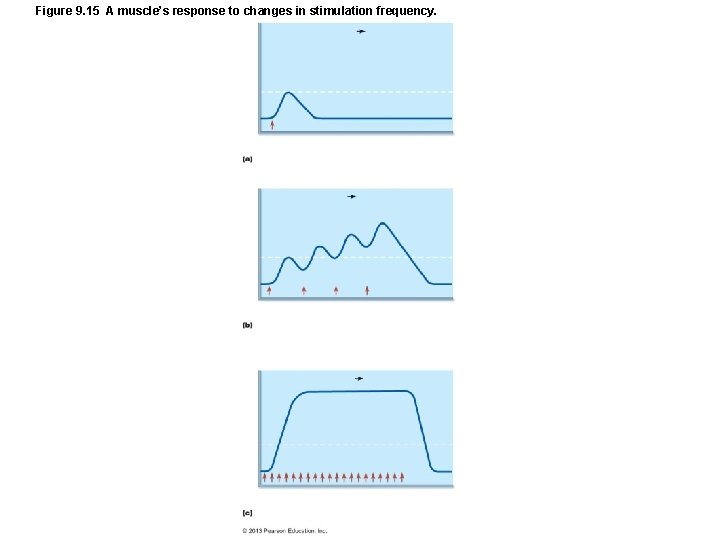
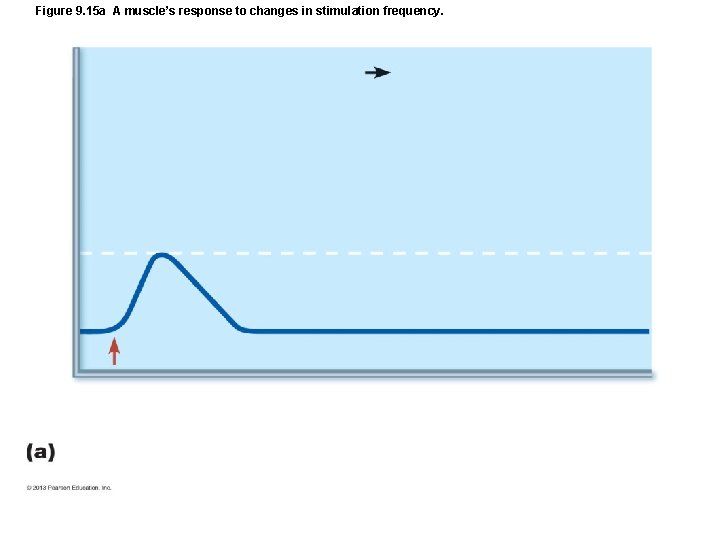
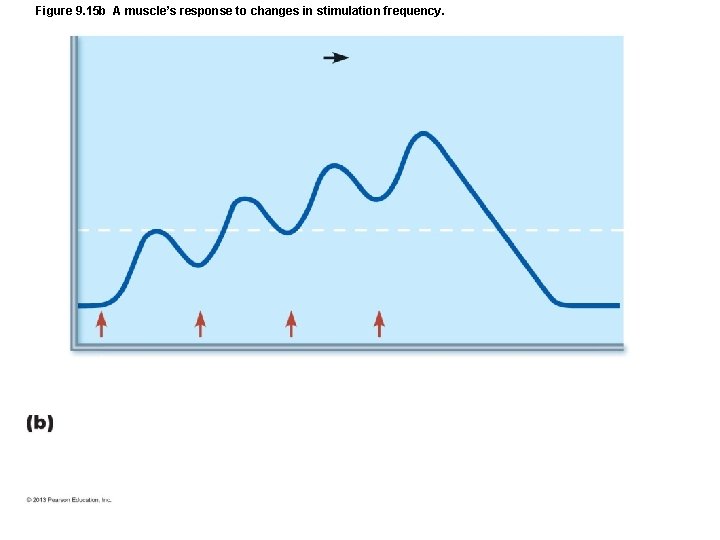
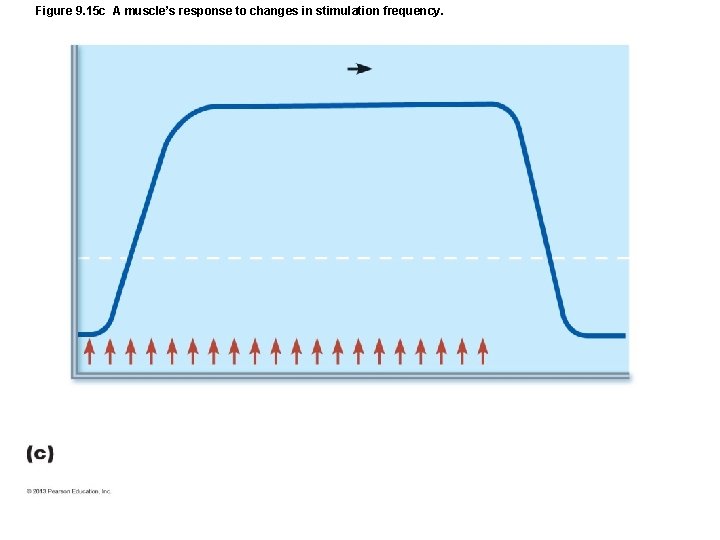
Figure 9. 15 A muscle’s response to changes in stimulation frequency.
Figure 9. 15 a A muscle’s response to changes in stimulation frequency.
Figure 9. 15 b A muscle’s response to changes in stimulation frequency.
Figure 9. 15 c A muscle’s response to changes in stimulation frequency.
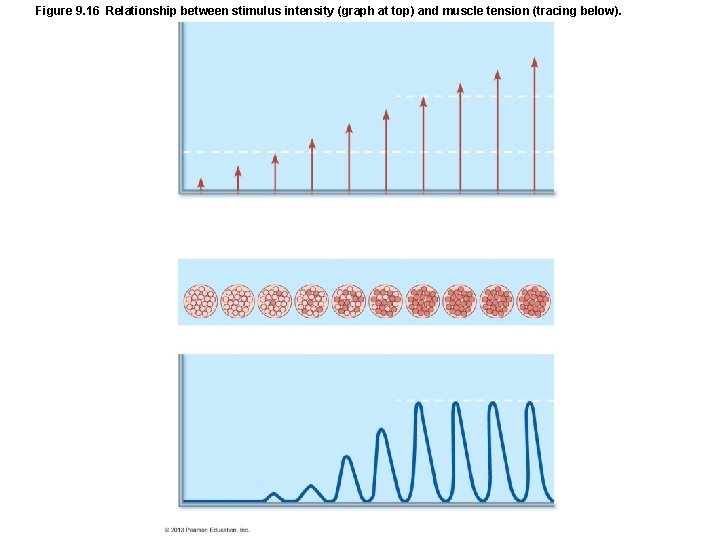
Figure 9. 16 Relationship between stimulus intensity (graph at top) and muscle tension (tracing below).
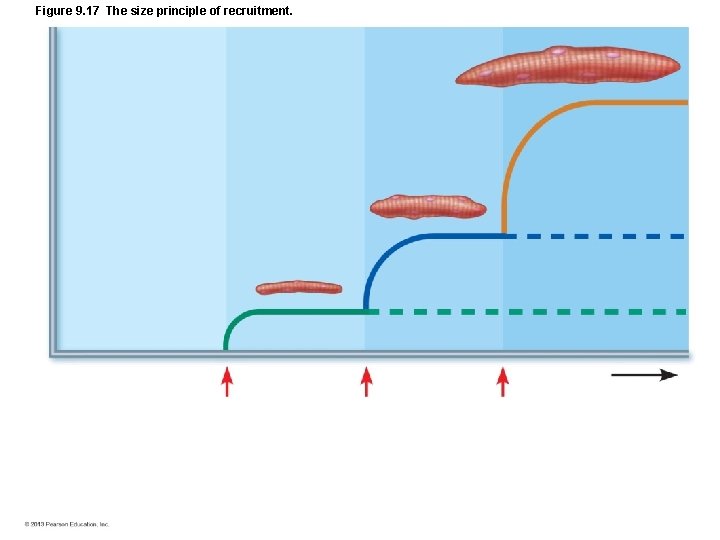
Figure 9. 17 The size principle of recruitment.
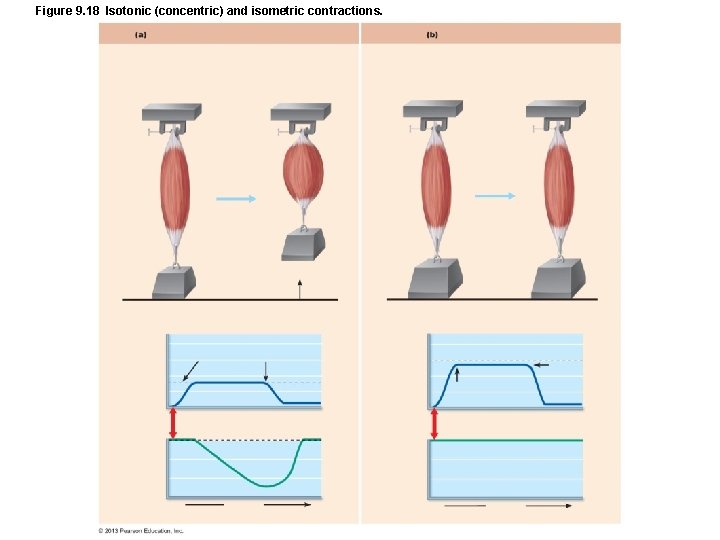
Figure 9. 18 Isotonic (concentric) and isometric contractions.
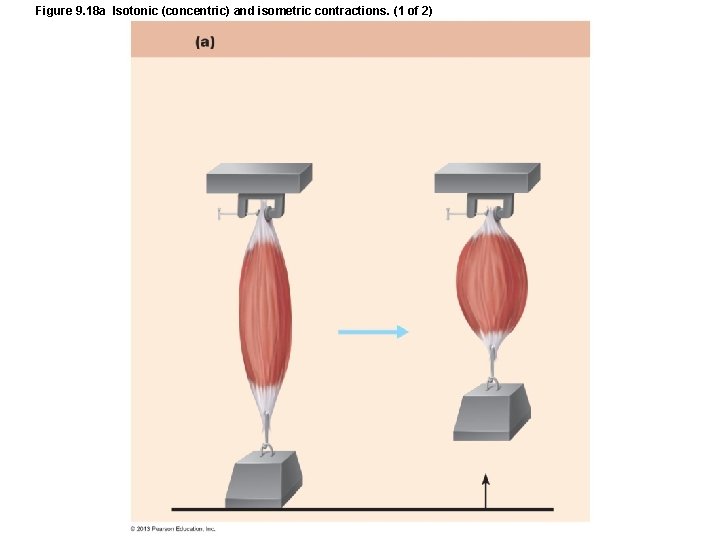
Figure 9. 18 a Isotonic (concentric) and isometric contractions. (1 of 2)
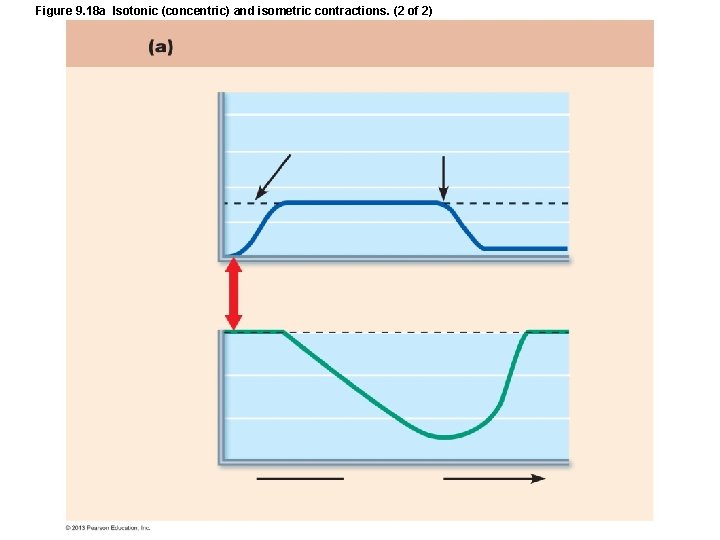
Figure 9. 18 a Isotonic (concentric) and isometric contractions. (2 of 2)
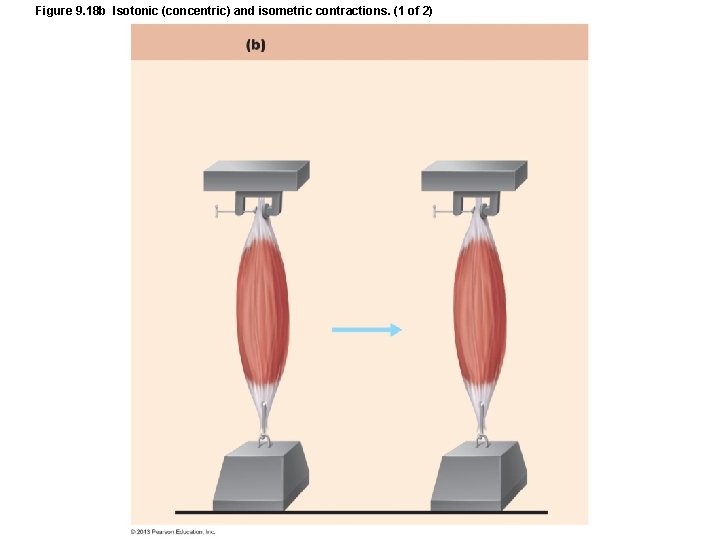
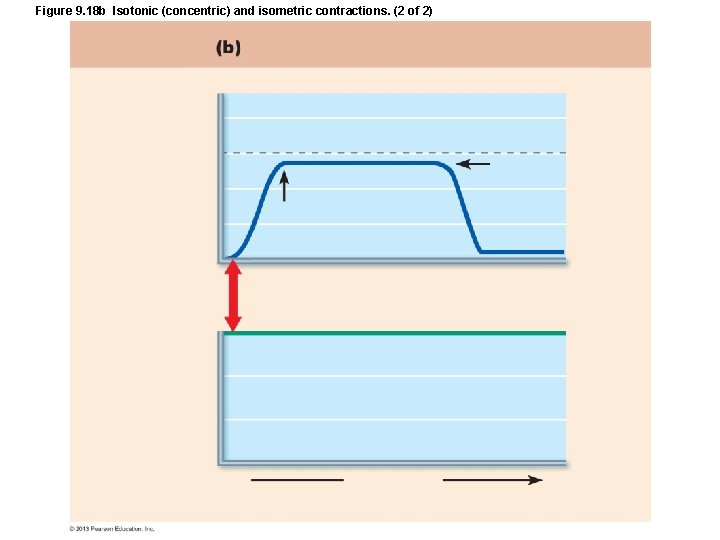
Figure 9. 18 b Isotonic (concentric) and isometric contractions. (1 of 2)
Figure 9. 18 b Isotonic (concentric) and isometric contractions. (2 of 2)
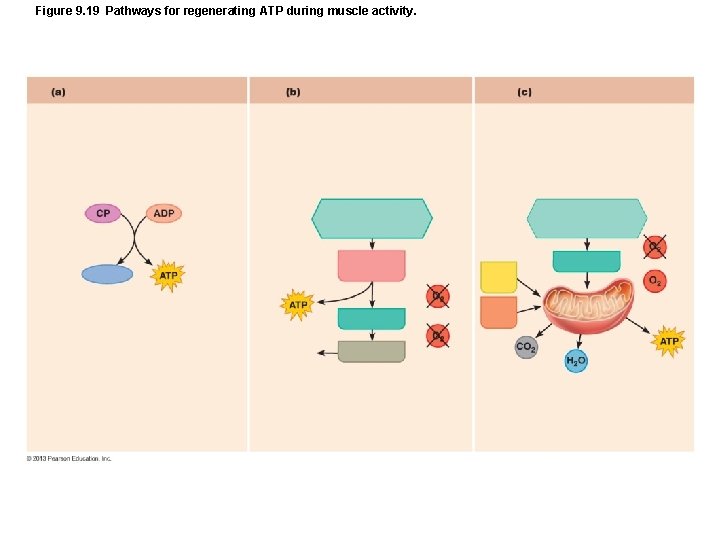
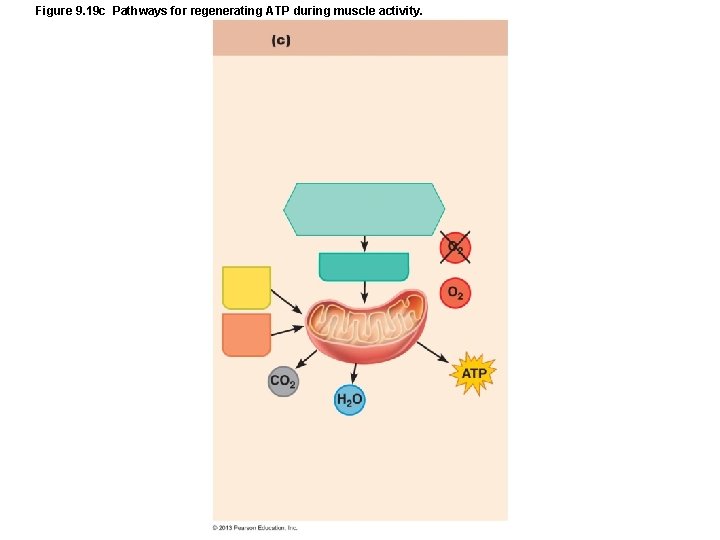
Figure 9. 19 Pathways for regenerating ATP during muscle activity.
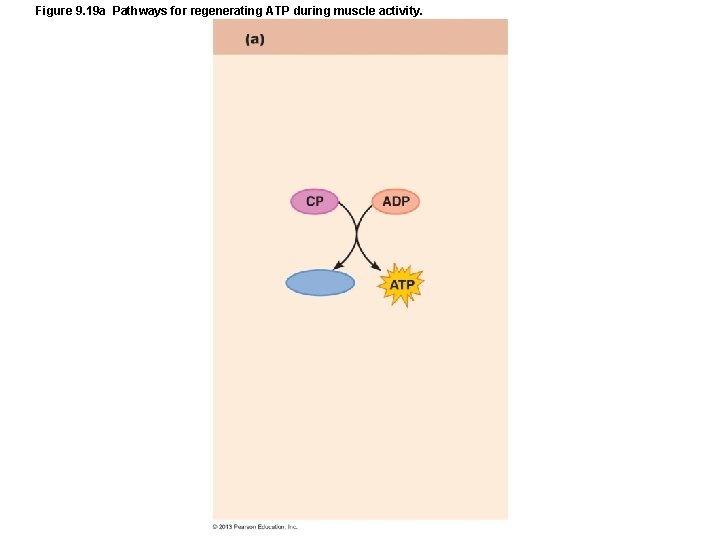
Figure 9. 19 a Pathways for regenerating ATP during muscle activity.
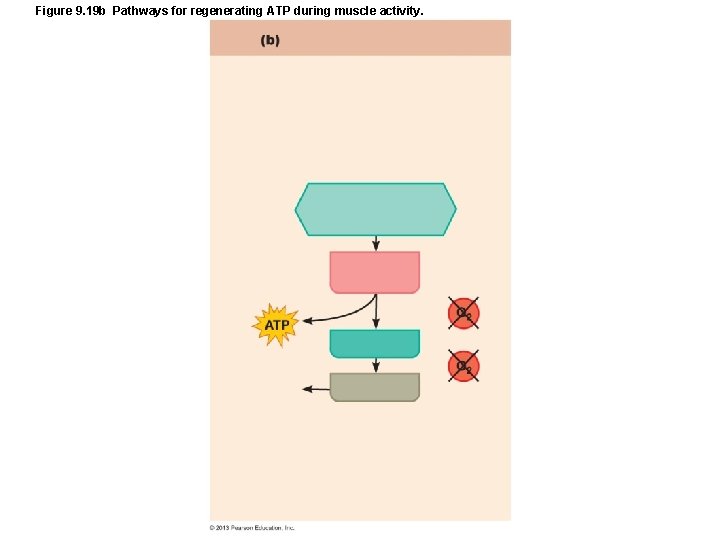
Figure 9. 19 b Pathways for regenerating ATP during muscle activity.
Figure 9. 19 c Pathways for regenerating ATP during muscle activity.
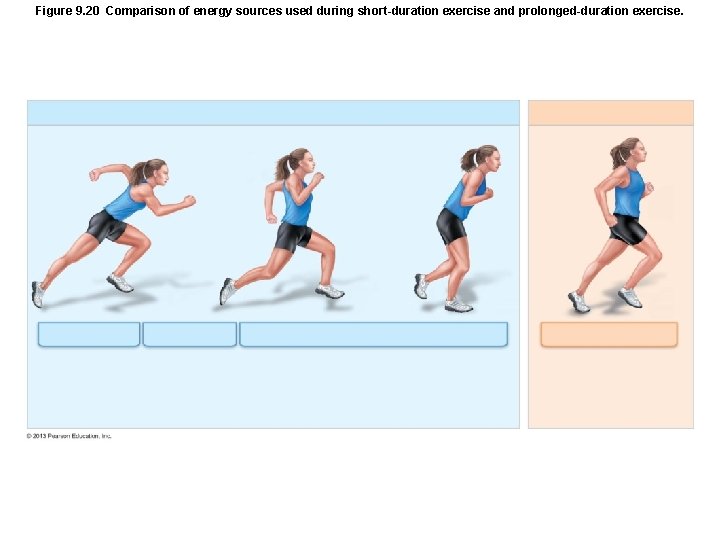
Figure 9. 20 Comparison of energy sources used during short-duration exercise and prolonged-duration exercise.
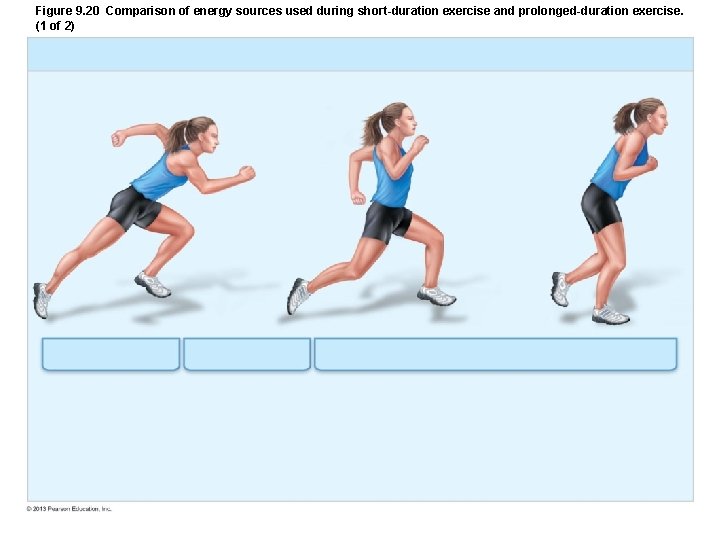
Figure 9. 20 Comparison of energy sources used during short-duration exercise and prolonged-duration exercise. (1 of 2)
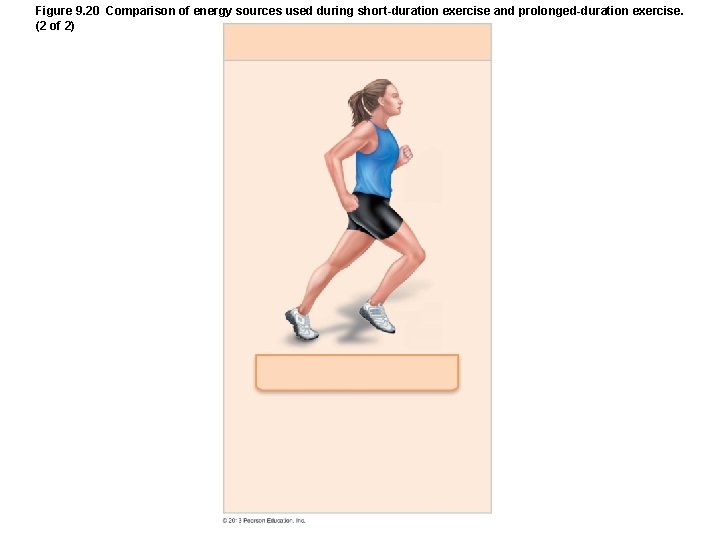
Figure 9. 20 Comparison of energy sources used during short-duration exercise and prolonged-duration exercise. (2 of 2)
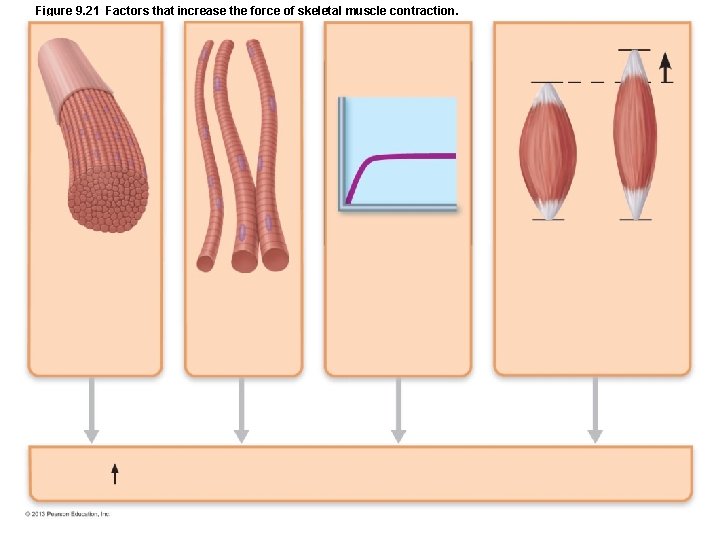
Figure 9. 21 Factors that increase the force of skeletal muscle contraction.
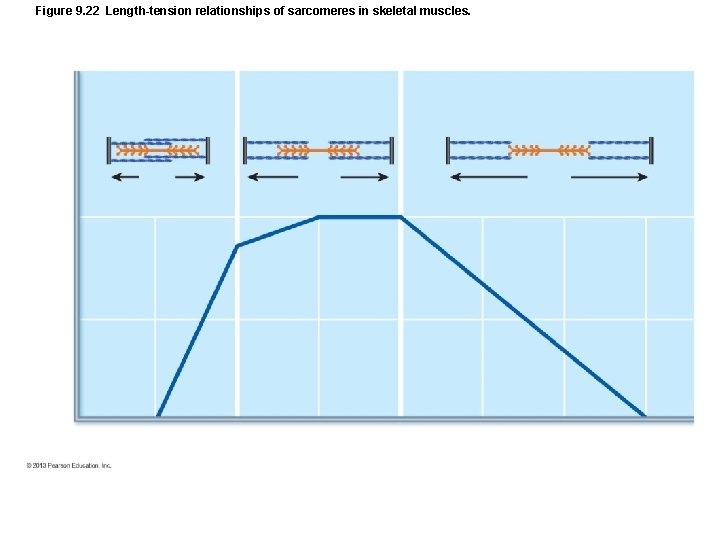
Figure 9. 22 Length-tension relationships of sarcomeres in skeletal muscles.
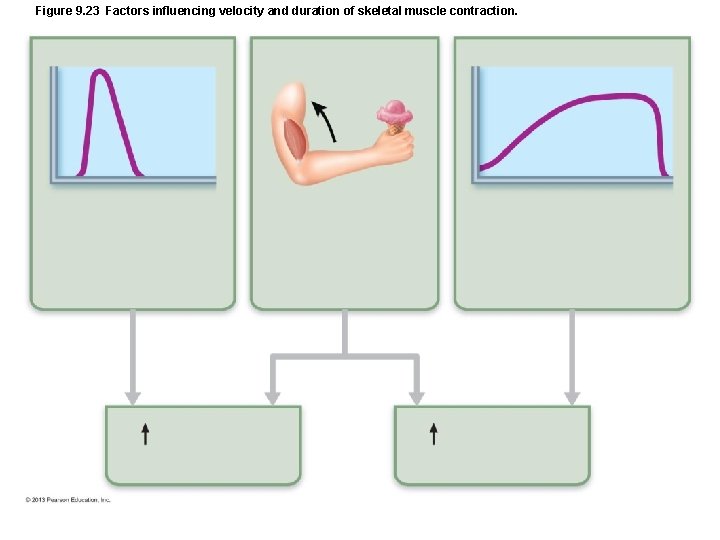
Figure 9. 23 Factors influencing velocity and duration of skeletal muscle contraction.
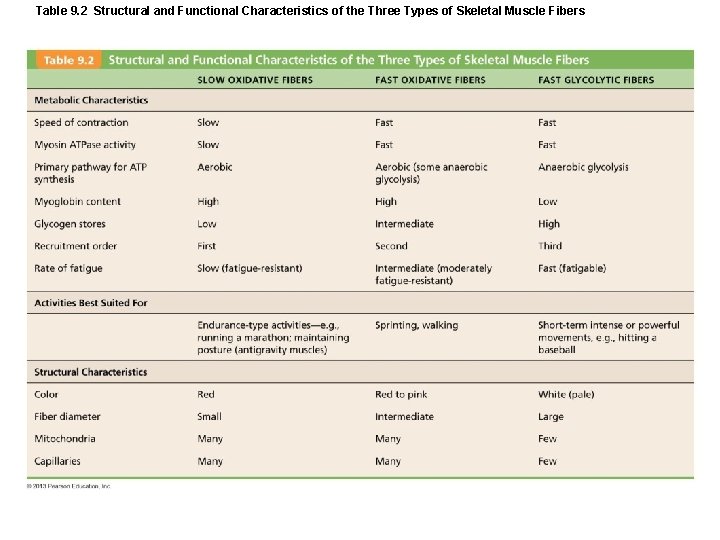
Table 9. 2 Structural and Functional Characteristics of the Three Types of Skeletal Muscle Fibers
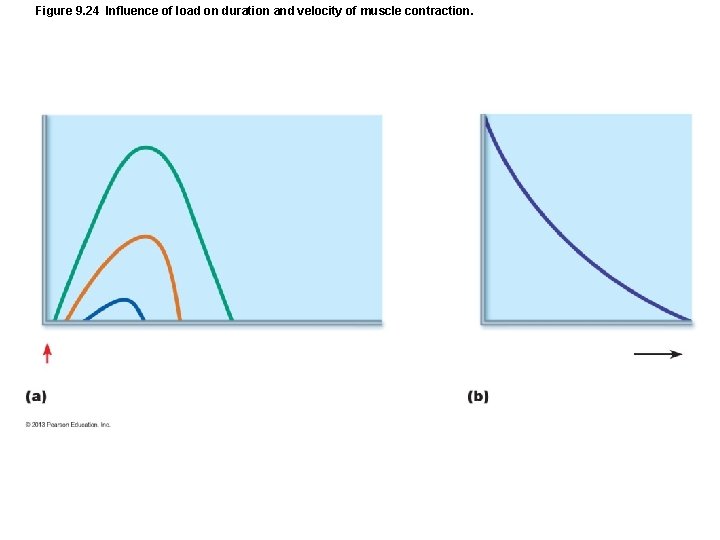
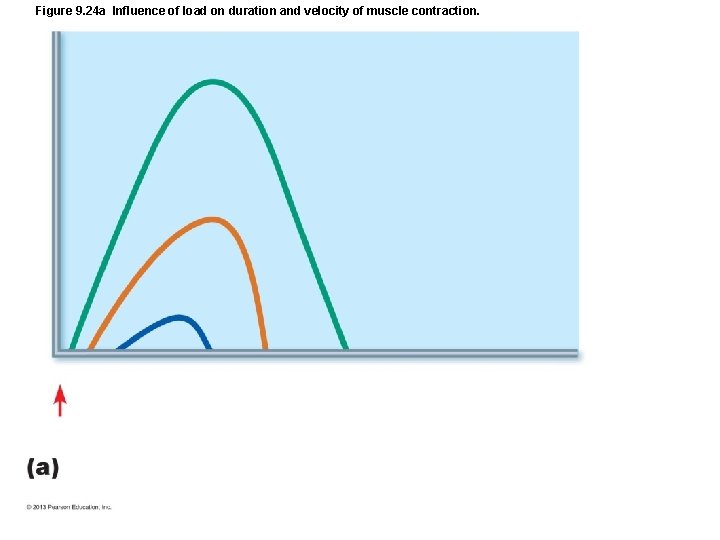
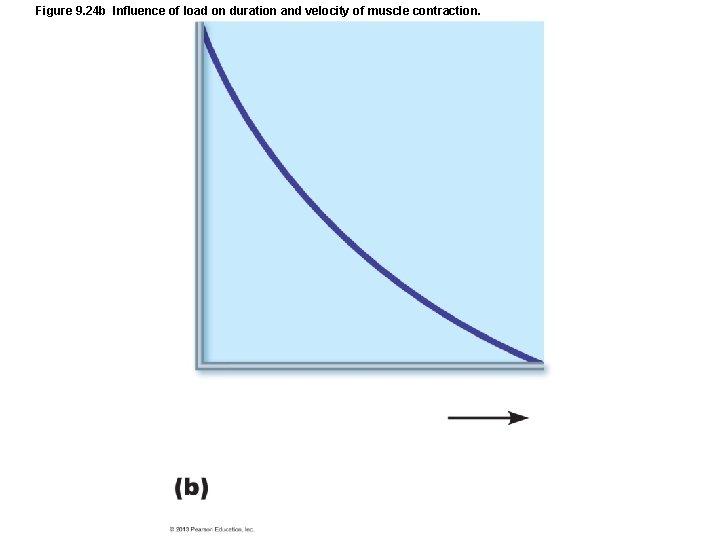
Figure 9. 24 Influence of load on duration and velocity of muscle contraction.
Figure 9. 24 a Influence of load on duration and velocity of muscle contraction.
Figure 9. 24 b Influence of load on duration and velocity of muscle contraction.
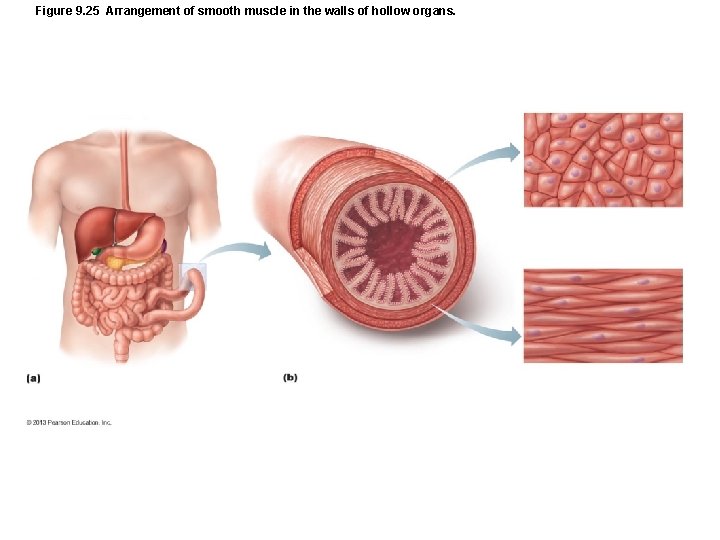
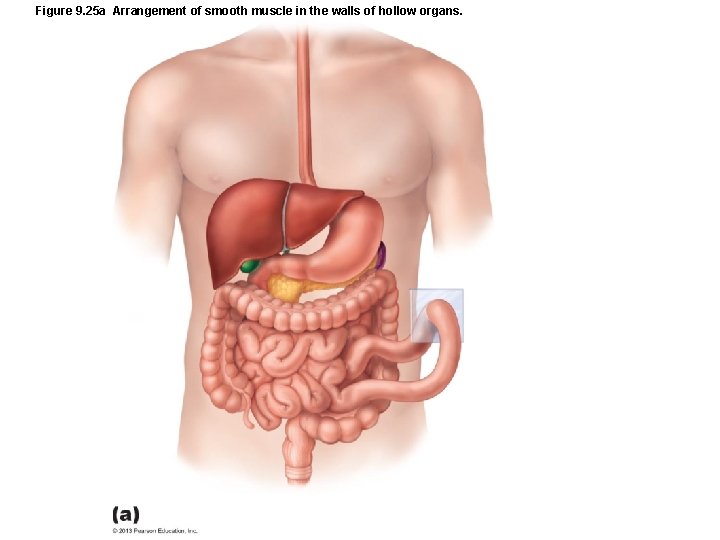
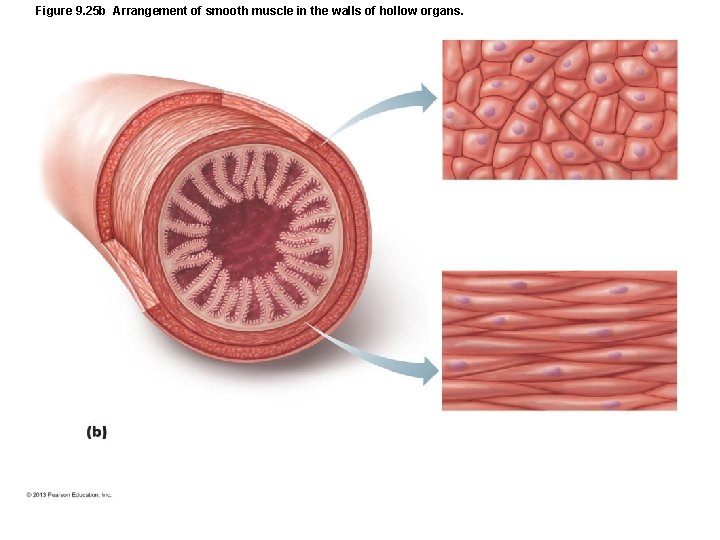
Figure 9. 25 Arrangement of smooth muscle in the walls of hollow organs.
Figure 9. 25 a Arrangement of smooth muscle in the walls of hollow organs.
Figure 9. 25 b Arrangement of smooth muscle in the walls of hollow organs.
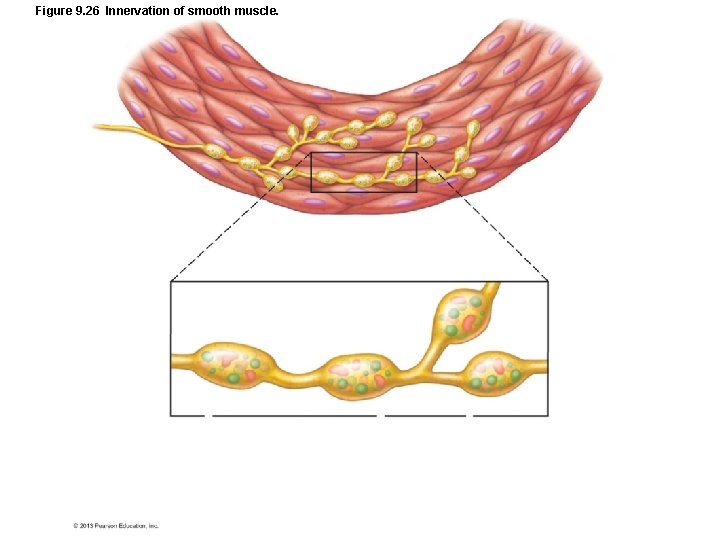
Figure 9. 26 Innervation of smooth muscle.
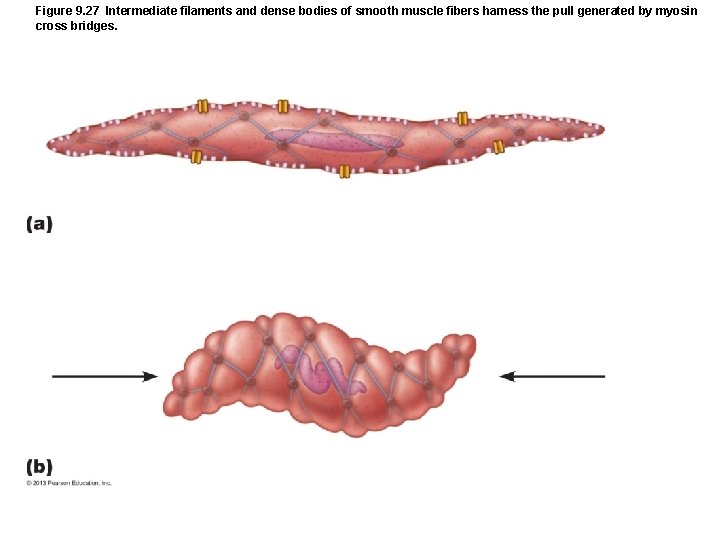
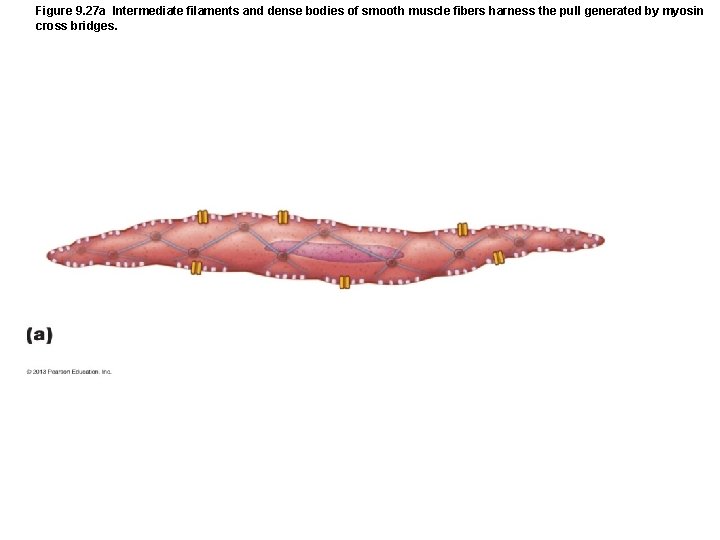
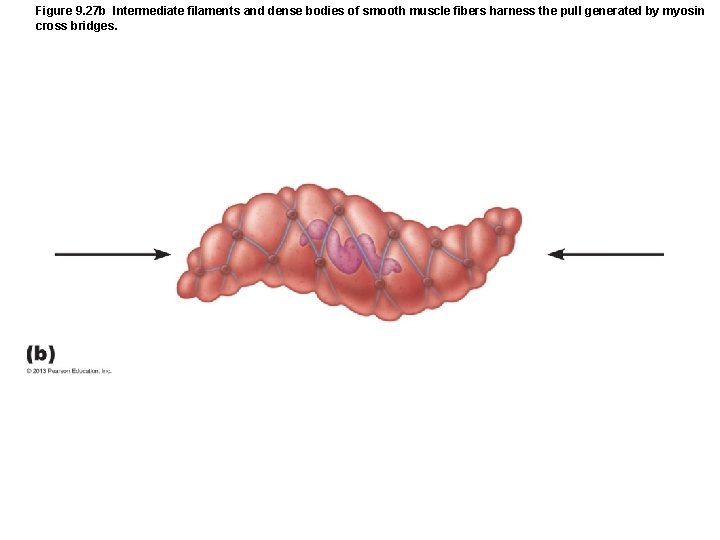
Figure 9. 27 Intermediate filaments and dense bodies of smooth muscle fibers harness the pull generated by myosin cross bridges.
Figure 9. 27 a Intermediate filaments and dense bodies of smooth muscle fibers harness the pull generated by myosin cross bridges.
Figure 9. 27 b Intermediate filaments and dense bodies of smooth muscle fibers harness the pull generated by myosin cross bridges.
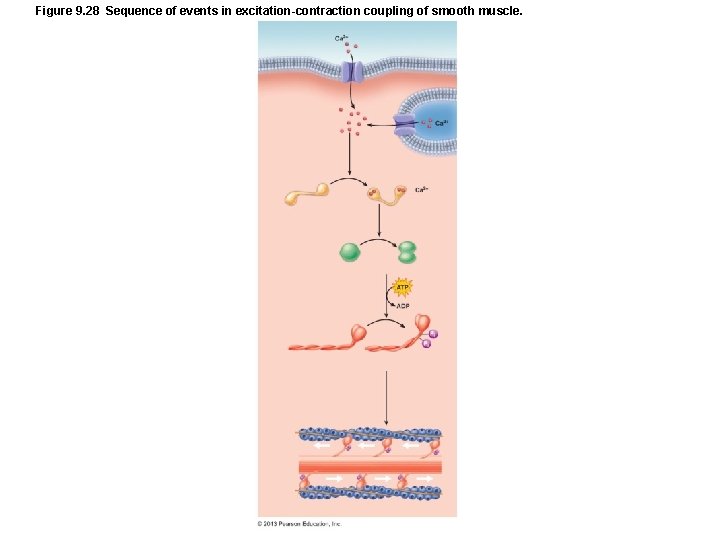
Figure 9. 28 Sequence of events in excitation-contraction coupling of smooth muscle.
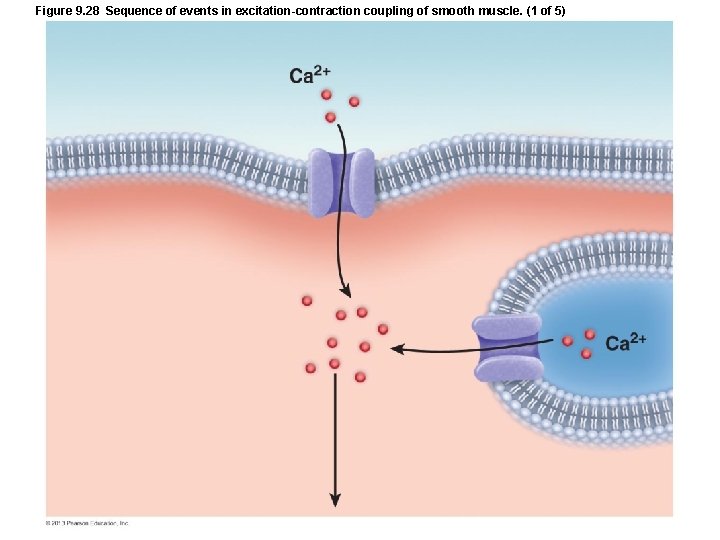
Figure 9. 28 Sequence of events in excitation-contraction coupling of smooth muscle. (1 of 5)
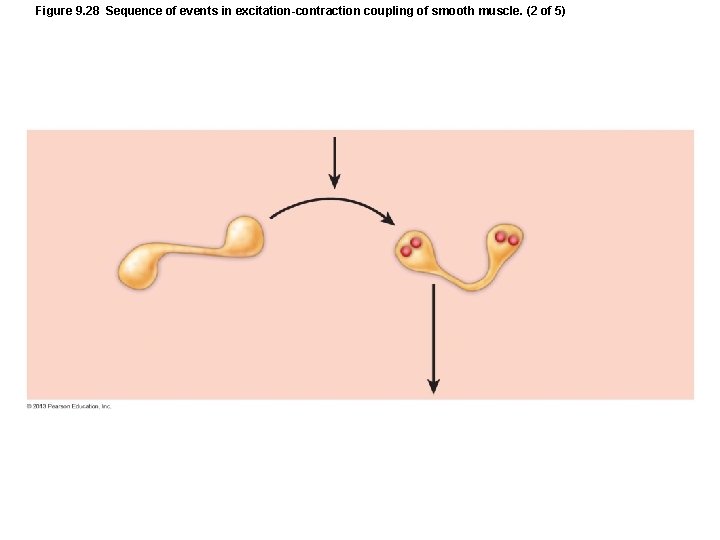
Figure 9. 28 Sequence of events in excitation-contraction coupling of smooth muscle. (2 of 5)
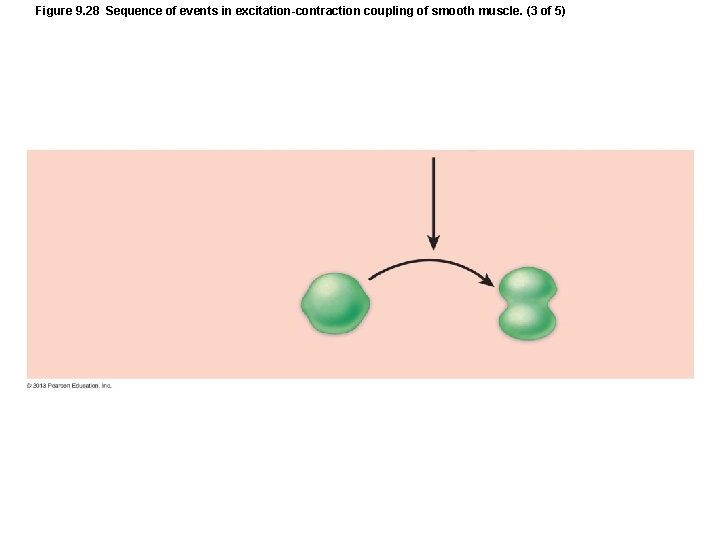
Figure 9. 28 Sequence of events in excitation-contraction coupling of smooth muscle. (3 of 5)
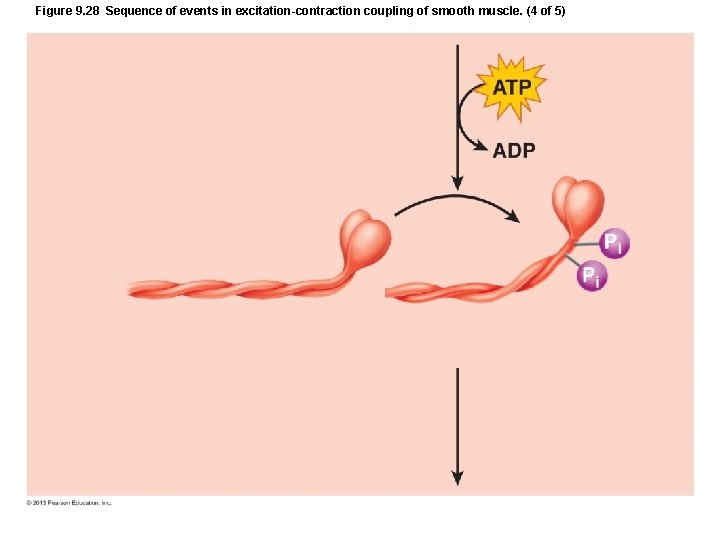
Figure 9. 28 Sequence of events in excitation-contraction coupling of smooth muscle. (4 of 5)
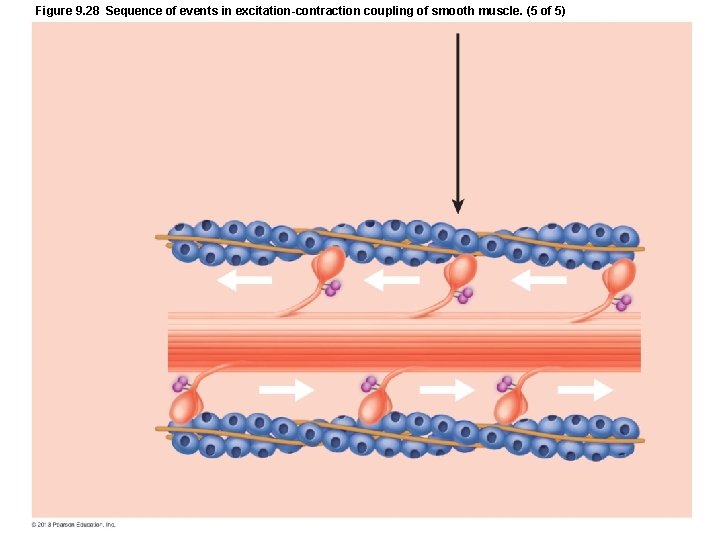
Figure 9. 28 Sequence of events in excitation-contraction coupling of smooth muscle. (5 of 5)
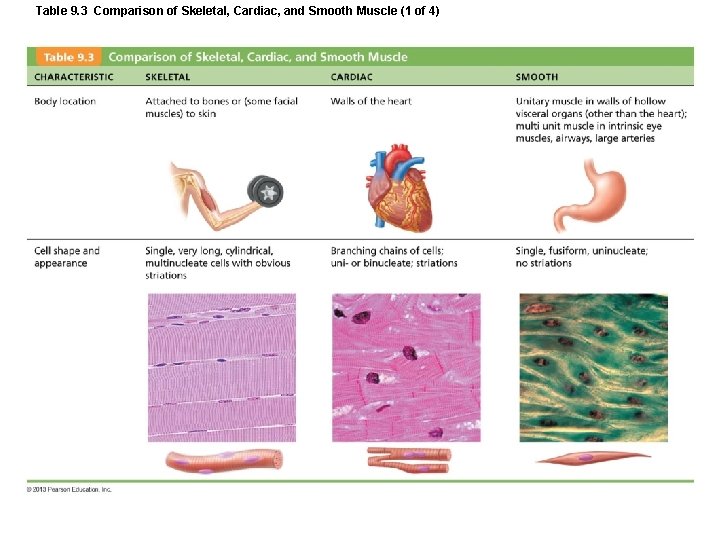
Table 9. 3 Comparison of Skeletal, Cardiac, and Smooth Muscle (1 of 4)
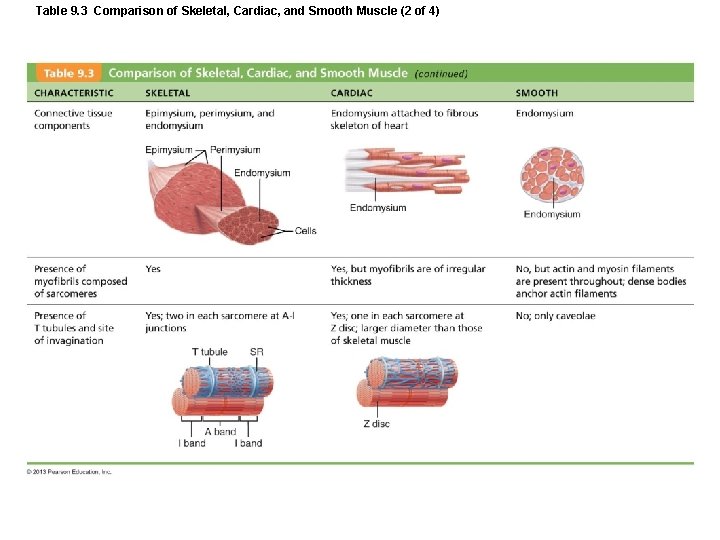
Table 9. 3 Comparison of Skeletal, Cardiac, and Smooth Muscle (2 of 4)
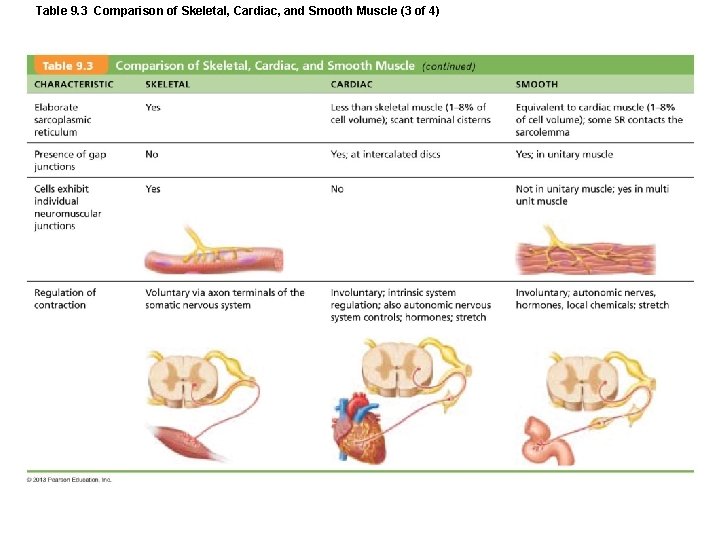
Table 9. 3 Comparison of Skeletal, Cardiac, and Smooth Muscle (3 of 4)
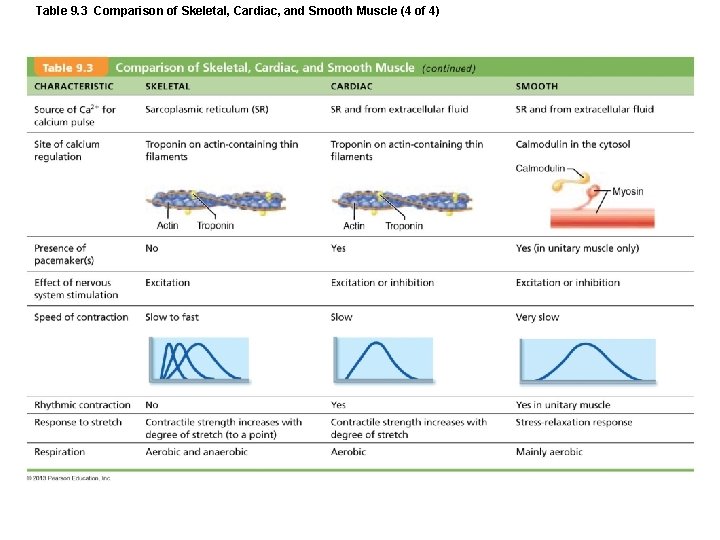
Table 9. 3 Comparison of Skeletal, Cardiac, and Smooth Muscle (4 of 4)
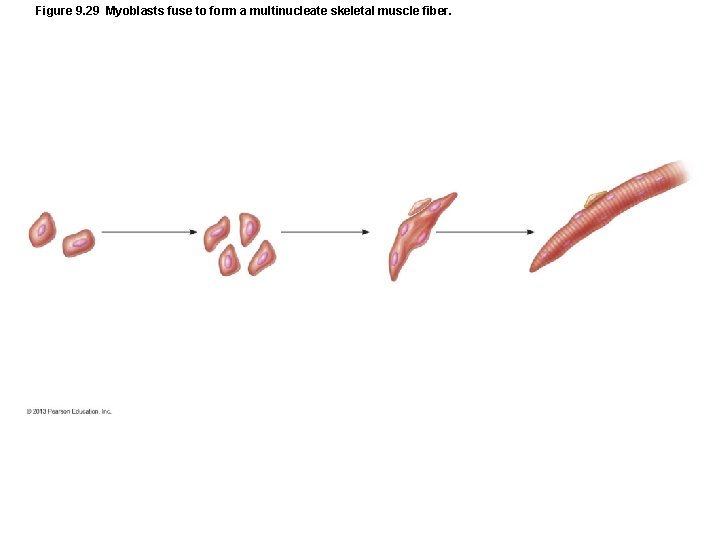
Figure 9. 29 Myoblasts fuse to form a multinucleate skeletal muscle fiber.
Closer Look 9. 1
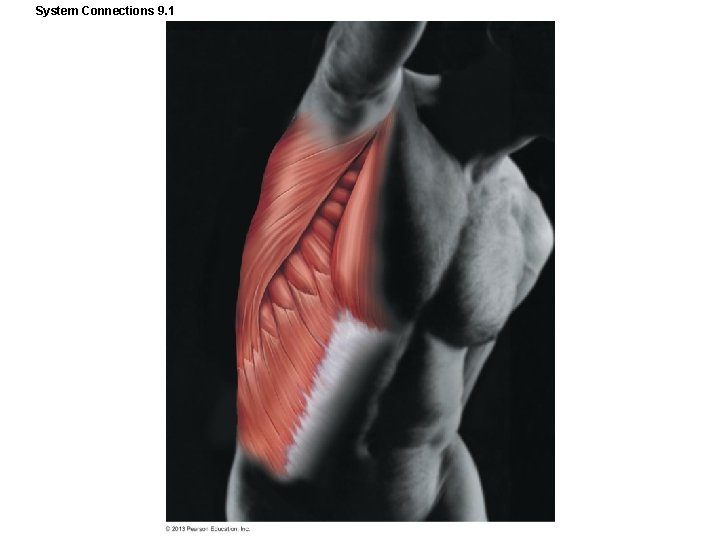
System Connections 9. 1