Facilitating Root Cause Analysis for Unified Improvement Planning

 Erin Loften")


. § Re-write today’s learning")


.")

. § Read this protocol.")


: § Academic")


 Tests, District Interim Assessments, Crossclassroom assessment, End of unit assessment")


 of different types of data helps us answer: 1. Do students’")
.")
.")


![TELL Reports § Tellcolorado. org § Three Reports/Views: § Summary Results for 2013 [Excel]](https://slidetodoc.com/presentation_image_h/8389c7c50f3ef9a81347b1680a9a0945/image-61.jpg "TELL Reports § Tellcolorado. org § Three Reports/Views: § Summary Results for 2013 [Excel]")


. §")


. § Brainstorming Rules: 1.")
 Diagram: § Start with “typical” categories")
. 1.")


 any explanation")


 Priority Performance Challenge: The % proficient/adv students in reading has")


")


.")


- Slides: 125
Facilitating Root Cause Analysis for Unified Improvement Planning
Introductions CDE: Improvement Planning Unit Center for Transforming Learning and Teaching (UCD) Erin Loften Lisa Medler Julie Oxenford O’Brian Mary Beth Romke
Session Purpose Prepare leaders to facilitate root cause analysis as part of working with local planning teams to develop/update their unified improvement plans.
Introductions Identify a burning question you have about root cause analysis and capture it on a sticky note. Share: § Name, Job Title, School/District/Organization. § Your role in Unified Improvement Planning. § Your question about root cause analysis.
Materials
The materials used during this session were developed in partnership with the Center for Transforming Learning and Teaching in the School of Education and Human Development at the University of Colorado Denver.
Norms The standards of behavior by which we agree to operate while we are engaged in learning together.
Ways to Talk § Table § Whip around § Round robin § Partner § Buzz
Session Outcomes § Define and explain the role of root cause Engage in handson learning activities and dialogue with colleagues. Access additional resources. Complete followup activities. analysis in Unified Improvement Planning (UIP). § Describe who should participate in root cause analysis, when and how. § Describe the critical steps of a root cause analysis as part of improvement planning. § Facilitate each step in a root cause analysis. § Identify where planning teams can “get off track” in root cause analysis and how to get them back on track. § Evaluate the effectiveness of facilitation strategies used for RCA. § Plan to facilitate a RCA.
Self-Assessment § Turn to Self-Assessment (Note catcher, p. 3 -4). § Re-write today’s learning objectives in language that has meaning for you. § Create a bar graph which describes where you currently believe you are in relationship to each learning target. § Leave the “reflections” column blank for now. Learning Target Define and explain the role of root cause analysis in Unified Improvement Planning In my words: I know when planning teams engage in root causes analysis as part of UIP and how it relates to the other processes that are part of UIP. . I don’t know what this Is I need more practice I’ve got It I can teach someone about it Reflections
Capturing Notes Facilitating Root Cause Analysis Note Catcher: § Self-Assessment § Background on Root Cause Analysis § Preparing for Root Cause Analysis § Planning to Facilitate Root Cause Analysis (put a sticky note here) § Building Background § Facilitating the Steps in Root Cause Analysis § Follow-Up to Capture Results of Root Cause Analysis
Agenda Root Cause Analysis Background Preparing for Root Cause Analysis Facilitate Root Cause Processes Steps in Root Cause Analysis
UIP: A framework for Performance Management & Continuous Improvement § Focus on the right things (Performance Indicators) § Evaluate performance (by gathering, analyzing and interpreting data about performance) § Plan (strategies for improvement) § Implement planned strategies § Evaluate (or monitor performance throughout the school year) § Make adjustments to Planned improvement strategies and Implement revised strategies as needed
Unified Improvement Planning Processes Preparing to Plan Gather and Organize Data Section III: Data Narrative Review Current Performance Section IV: Target Setting Describe Notable Trends Ongoing: Progress Monitoring Section IV: Action Planning Prioritize Performance Challenges Identify Root Causes Set Performance Targets Identify Major Improvement Strategies Identify Interim Measures Identify Implementation Benchmarks
UIP Template Section I Summary Information about the School/District Section III Section IV Progress Monitoring of Prior Year’s Targets School Target Setting Form Additional Priority Performance Information Challenges about the Data Worksheet Annual Performance Targets (2 School/ District Notable Trends years) Priority Performance Interim Measures Challenges Major Improvement Strategies Improvement Root Causes Plan Data Narrative Action Planning Form Information Description of Major Improvement Strategies Contact Information School/District and Process for Data Analysis Review Current Performance Trend Analysis Priority Performance Challenges Root Causes and Validation Associated Root Causes Accountability Provision Action Steps Timeline Key People Resources Implementation Benchmarks Status of Action Steps
The Role of Root Cause Analysis Action Plan Priority Performance Challenges
Root Cause Analysis in UIP § Turn to Root Cause Analysis (excerpted from the UIP Handbook) (Tools, p. 9). § As you read this description of Root Cause Analysis for improvement planning, consider the following questions: § Why is it important to identify root causes? § How will you know when you have identified a root cause? § When you have finished reading: buzz with a partner with your answers to these questions.
Root Causes are. . . § Statements describing the deepest underlying cause, or causes, of performance challenges. § Causes that, if dissolved, would result in elimination or substantial reduction of the performance challenge(s). § The “why” behind current patterns of performance. § Things that can change and need to change. § The focus of major improvement strategies. § About adult actions.
Non-examples of Root Causes § What is NOT a root cause? § Student attributes (poverty level) § Student motivation § Individual teachers (e. g. , Mr. Jones) § Do a whip around with your table group sharing explanations that might appear to be root causes but don’t qualify.
Background: Root Cause Analysis § Why identify root causes? § To get past “symptoms” to an explanation(s) that is worth taking action on. § Read: Root Cause Basics (Tools, p. 3). § Work with a partner to create a 1 sentence description of “Root Cause” that you believe will resonate with groups with which you work. § Share some examples with the full group.
Common understanding of datadriven collaborative inquiry § Grab your tools packet, Key Research Findings Related to Collaboration (Tools, p. 21). § Stand up and find a partner that you haven’t talked with yet today, number off 1, 2. § Partner number 1, read finding #1 and share what it means to you with your partner. § Partner number 2, read finding #2 and share what it means to you with your partner. § Find another partner and repeat for finding #3 and #4. § Find a third partner and repeat for finding #5 and #6.
Guiding Assumptions of Collaborative Inquiry § Colorado’s Unified Improvement Planning processes engage planning teams in “collaborative inquiry”. § Turn to Guiding Assumptions of Collaborative Inquiry (Tools, p. 25). § Work with a partner: § Read one row in the chart (individually and silently). § When each partner has completed a row, look up and “say something. ” Something might be a question, a brief summary, a key point, an interesting idea or personal connection to the text. § Continue until you complete all of the rows in the table. § Share out. . . How could these guiding assumptions be used to create context within which collaborative inquiry occurs?
Building Background on RCA: Tools and Strategies Tools Facilitation Strategies § UIP Process Diagram§ § UIP Handbook § excerpt § Root Cause Basics § (reading) § § Guiding Assumptions of § Collaborative § Inquiry Using text as a source of expertise Focusing questions to guide reading Partner Buzz Whip around Developing counter examples Developing/adapting definition from reading § Say Something Protocol
Building Background on Root Cause Analysis § Turn to the Planning to Facilitate Root Cause Analysis (Note Catcher, p. 7). § Make notes about how you will build background knowledge on root cause analysis. § What tools/resources will you use? § How will you facilitate this? § What preparation will be required? § Share out plans.
Agenda Root Cause Analysis Background Preparing for Root Cause Analysis Facilitate Root Cause Processes Steps in Root Cause Analysis
Creating and Effective Facilitation Context 1. Determine who will participate and how participation will be structured. 2. Clearly identify roles. 3. Establish commonly held Norms, or behavioral expectations. 4. Develop common understanding of the group’s locus of control/circle of influence. § Other?
Who should participate in Root Cause Analysis? § Root cause analysis is problem identification (why we have our performance challenges). § It leads to determining what will be done to solve the problem. § Who should participate? § Everyone who will be part of solving the problem. § How folks participate may vary to make it possible to engage large groups. § Buzz with a partner: Why?
Structuring Participation § What if the staff of the school is too large to engage them all in root cause analysis at the same time? What if timing (and contract agreements) make it impossible to get the whole staff together for this purpose? § How can you structure a group to engage in small group discussions, but identify a jointly owned root cause? § Talk with a partner – identify at least two options. § Form a quad – share your options. Did you add to your list? § Make notes in your note catcher (p. 6) about how to structure different groups for root cause analysis.
Clearly Defined Roles § Turn to Four Possible Meeting Roles (Tools, p. 35 -39). § Consider, within your context, who might play each of the identified roles? Can a facilitator and recorder be the same person? § Make notes about: § How you will explain different roles to the group with which you work. § How you might talk to a school/district leader with authority about their role.
Commonly held norms or behavioral expectations § What are norms? § The standards of behavior by which we agree to operate while we are engaged in learning together. § How can you establish norms for a group with which you will engage in root cause analysis?
Norms § Turn to Setting Norms Protocol (Tools, p. 29). § Read this protocol. § Try this out with your table group: 1. Each person writes (three) norms on sticky notes. 2. Work with your table group to divide into categories (procedural and interpersonal). 3. Group similar suggestions together. 4. Name the norms (summarize the grouped norms). 5. Reach consensus on which you will accept.
More on Norms § When does it make sense to have a group generate norms? § When does it make sense to provide norms for the group? § Turn to: § Norms from CTLT (Tools, p. 31). § The Seven Norms of Collaborative Work, from Adaptive Schools (Tools, p. 33). § Which of the ideas on these two documents might you adopt or use? § Capture notes on how you will establish norms for your group (note catcher, p. 6).
Locus of Control Circle of Influence § Root causes must address things within the group’s locus of control or at least their circle of influence. § Locus of Control = the things we can change without outside permission (e. g. , the instructional strategies we use). § Circle of Influence = the things we can influence that impact what happens within our school (e. g. , district curriculum). § Outside our Circle of Influence = the things we cannot influence (e. g. , the characteristics of our students).
Agenda Root Cause Analysis Background Preparing for Root Cause Analysis Facilitate Root Cause Processes Steps in Root Cause Analysis
Steps in Root Cause Analysis 1. Focus on a performance challenge (or closely related performance challenges). 3. Generate explanations (brainstorm). 4. Categorize/ classify explanations. 5. Narrow and prioritize explanations. 6. Deepen thinking to get to a “root” cause. 7. Validate with other data. 8. Incorporate external reviews. Iterative 2. Consider school/district context (process/perception data).
Steps in Root Cause Analysis 1. Focus on a performance challenge (or closely related performance challenges). 3. Generate explanations (brainstorm). 4. Categorize/ classify explanations. 5. Narrow and prioritize explanations. 6. Deepen thinking to get to a “root” cause. 7. Validate with other data. 8. Incorporate external reviews. Iterative 2. Consider school/district context (process/perception data).
Root Causes and Priority Performance Challenges § Root causes are always focused on at least one priority performance challenge. § They explain why we see the patterns of performance that we see. § So. . . priority performance challenges must be clearly identified first.
Priority Performance Challenges § Work with a partner. Turn to UIP Handbook Priority Performance Challenges Excerpt (Tools, p. 45). § Read lightly (not word for word) and discuss these questions: § On what should priority performance challenges focus? § What are examples of priority performance challenges? § What are non-examples? § How do you determine the appropriate level of a priority performance challenge? § Share questions that you have about priority performance challenges.
Scenario: Elementary School § School Performance (Plan Type Assignment: Turnaround year 3): § Academic Achievement: Does Not Meet § Academic Growth Gaps: Does Not meet § Priority Performance Challenges: § In the performance indicator areas of achievement, performance in all grade levels and in all content areas are below minimum state expectations and have been flat for the last three years. § The MGP for all grade levels and subgroups in all content areas is below the state expectation of 55 and has been flat (35 -32 -38) for the last three years. § Are these appropriate?
How groups “get off track” with their focus. § Table discussion: What do you do if. . . § Your group has not identified at least one priority performance challenge. § The priority performance challenge(s) that the group identified is not at an appropriate magnitude given the over-all performance for the school. § Your group has identified too many priority performance challenges. § Share out (good time to capture thinking in your note catcher. . . )
Planning to Facilitate Root Cause Analysis § Turn to the Planning to Facilitate Root Cause Analysis (note catcher, p. 7). § Make notes about how you will focus teams on appropriate priority performance challenges: § What tools/resources will you use? § How will you facilitate focusing your team on a priority performance challenge or more than one related priority performance challenge? § What will you need to do to prepare for this step in root cause analysis?
Steps in Root Cause Analysis 1. Focus on a performance challenge (or closely related performance challenges). 3. Generate explanations (brainstorm). 4. Categorize/ classify explanations. 5. Narrow and prioritize explanations. 6. Deepen thinking to get to a “root” cause. 7. Validate with other data. 8. Incorporate external reviews. Iterative 2. Consider school/district context (process/perception data).
If you’re only looking at Student Learning, you’re missing 65% of the data. – Victoria Bernhardt
Multiple measures must be considered and used to understand the multifaceted world of learning from the perspective of everyone involved. -Victoria Bernhardt
What types of data do we have? § Demographics § Perceptions § School Processes § Student Learning/ Performance
Demographi cs Enrollment, Attendance, Race/Ethnicity, Gender, Drop-Out Rate, Language Proficiency, Mobility Victoria Bernhardt
Perception s Perceptions of Learning Environment, Perceptions of Teacher Working Conditions, Values and Beliefs, Attitudes, Observations Victoria Bernhardt
Student Learning State-Administered (performance) Tests, District Interim Assessments, Crossclassroom assessment, End of unit assessment Victoria Bernhardt
School Processes Records of School Programs and Processes, Classroom Records, Classroom Observations Victoria Bernhardt
Demographi cs School Processes Provides information that allows for the identification of actions, processes, programs that best meet the needs of all students. Student Learning Perception s Victoria Bernhardt
What combination/ intersection(s) of different types of data helps us answer: 1. Do students’ experiences in school differ based on their characteristics? 2. Is participation in a reading intervention program associated with increased student performance? 3. Are teacher perceptions of their working environment associated with different levels of student performance? Victoria Bernhardt
Activity: Data Questions 1. Refer to the Data Intersection Questions worksheet (Tools, p. 51). 2. Consider the questions listed. For each, identify what different types of data would be needed. 3. Identify 2 additional questions at your table. As a group, identify what data would be needed.
Activity: Data Intersections § Refer to the Creating Intersections Activity (Tools, p. 53 -54). § How could you use this activity with your staff to get them thinking about what data might be available for root cause analysis work?
Unified Improvement Planning Review current performance and prior performance targets or goals Analyze data to identify notable trends Prioritize performance challenges Identify root causes of performance challenges Establish annual performance targets Types of data (intersections) needed Performance data (intersected with demographic data) Process and perception data (intersected with demographic data) Performance data (intersected with demographic data) and state and local expectations Performance data (intersected with demographic data) Identify measures and monitor the impact of action steps on student performance. Identify implementation benchmarks & Process and perception data monitor implementation of action steps. (intersected with demographic data)
Process and Perception Data for Root Cause Analysis § What process and perception data is available to help planning teams understand the context as they engage in root cause analysis? § EDT Reports § Curriculum Alignment Studies § TELL Survey Results § MTSS/RTI Implementation § Implementation Benchmarks § School Climate/Culture Surveys (students, parents) § Other? Review § External School Reviews
TELL Survey Results § TELL = Teaching, Empowering, Learners, and Learning. § On-line anonymous survey of public school educators about perceptions of current teaching and learning conditions. § Last administration – Spring 2013. § Next administration during the upcoming school year. § Because teaching conditions. . . § Matter for students § Matter for teacher retention § Are viewed differently by teachers and principals
What we have learned… § Overall, Colorado educators are very positive about school conditions. § Time is consistently the biggest challenge. § Sense of efficacy and support from leadership affects teacher attrition more than other factors (e. g. , salary). § Effective induction support and mentoring is not systematically available to novice educators. § The construct with the strongest relationship to student performance is community involvement and support.
TELL Survey Basics Work with a partner, and review the TELL Survey Basics handout (Tools, p. 59). Answer the following questions: § What is the purpose of the TELL Survey? How should it be used? What are ways it should not be used? § From whom is data collected? § What response rate is required for results to be reported? § Did your district/school have a high enough response rate for results to be reported? Have you accessed your district/school TELL survey results?
Accessing TELL Results § www. tellcolorado. org § All districts and schools with at least a 50% response rate (and a minimum of 5 responses). § Survey Results: § By District § By School
Survey Focus: TELL Constructs § Time § Facilities and Resources § Community Support and Involvement § Managing Student Conduct § Teacher Leadership § School Leadership § Professional Development § Instructional Practices and Support Consider the description of the TELL Survey Focus, discuss the following: • Why would it be important to find out about teachers’ responses related to each of the listed constructs? • How could knowing about teacher perception of these aspects of their working conditions help with root cause analysis?
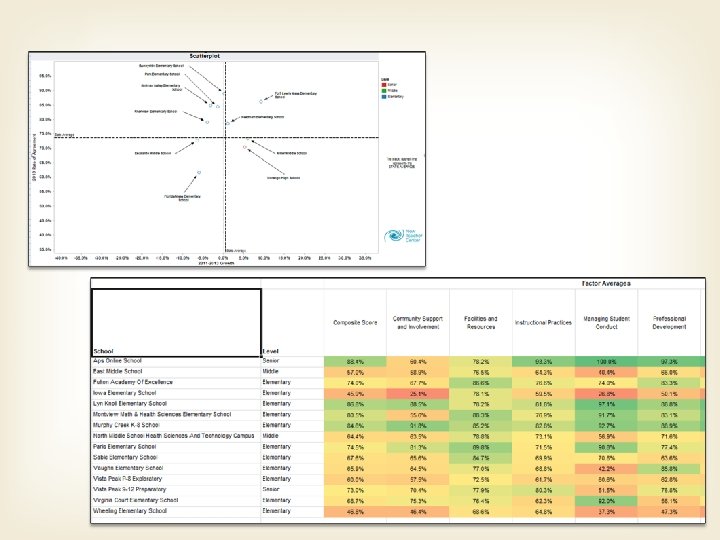
TELL Reports § Tellcolorado. org § Three Reports/Views: § Summary Results for 2013 [Excel] § Detailed Results for 2013 [PDF] § Summary Comparison Results 2011 to 2013 [Excel] § Additional reports for districts (not public): § Scatterplot § Growth Heat Map § 2013 Heat Map
Path Through the TELL Data Review Constructs Determine a Construct on which to Focus Examine Items Within the Construct Determine an Item of Focus Analyze Individual Items
Lots of data, where to start? § Use HEAT Maps: § For which constructs were our teachers’ responses significantly lower than other schools at the same level (elem, middle, high)? § Compared to what? § Consider state-level results: § The construct with the strongest relationship to student performance is community involvement and support. § Time is consistently the biggest challenge. § Sense of efficacy and support from leadership affects teacher attrition more than other factors (e. g. , salary).
Practice § Access ROCKY ES TELL Survey Results and Heat Maps (Scenario Packet). § Consider: § On which construct(s) would you focus first? § What would be your path through this school’s TELL data?
Reviewing Perception Data: Example § This school has TELL data available from the most recent school year. § Strategy: § Divide into eight different table groups (=number of TELL constructs) with each group focused on one construct. § Identify areas where the school’s results are red or close to red (this is where this school differs substantially from other elementary schools). § Groups capture list of contextual features that could impact performance in priority areas. § Group share out of areas of concern.
Consider Other Resources Available from CDE § Turn to Resources Available from CDE to Support Root Cause Analysis (Tools, p. 65). § Have you used any of these resources? § Do any of these tools address topics likely to be important in your context? § Discuss: How could you use these resources to collect data to support your root cause analysis?
Inventory of “other” data sources § Consider Inventory of Data Sources other than Student Performance Data (Toolkit, p. 67 -68). § What elements are included in this inventory? § Review the “legend” § Do you have any questions about the elements? § Identify at least 2 data sources that you would include in this inventory (complete 2 rows). § This inventory should be completed in advance of engaging in root cause analysis.
Matching Process & Perception Data to Priority Performance Challenges § Use a completed “Inventory of Data Other than Performance Data”. § For each priority performance challenge, identify what other data might be reviewed prior to and/or used as part of root cause analysis. § Organize these data and provide reports to your planning team.
How groups “get off track” considering context Off Track § § § Group members don’t know § how to “make meaning” of context data. Group spends too much time on context without focusing on how it could § impact student performance results. No “formal” context data/information is available. § Getting Back On Track Plan in advance how you will have teams interpret their context data. Break it into smaller chunks for interpretation (have sub-groups look at parts of it). Have team members identify theories about the relationship between the context data and student performance before they look at it (if it isn’t already part of the context data). Talk about the context in categories (consider using causal theories reading as a guide for categories).
Planning to Facilitate Root Cause Analysis § Turn to the Planning to Facilitate Root Cause Analysis (note catcher, p. 8). § Make notes about how you will consider context data as part of engaging in root cause analysis: § What tools/resources will you use? § What data will your team review prior to root cause analysis? How will you facilitate groups considering context data? § What will you need to do to prepare for this step in root cause analysis?
Steps in Root Cause Analysis 1. Focus on a performance challenge (or closely related performance challenges). 3. Generate explanations (brainstorm). 4. Categorize/classify explanations. 5. Narrow and prioritize explanations. 6. Deepen thinking to get to a “root” cause. 7. Validate with other data. 8. Incorporate external reviews. Iterative 2. Consider school/district context (process/perception data).
Causal Theories § Independently read Identifying Causal Theories” from Got Data? Now What? (Tools, p. 79). § With a partner, answer these questions: § What is a causal theory? § How does a causal theory relate to root causes?
Generate Explanations § Turn to Brainstorming Strategies (Tools, p. 69). § Brainstorming Rules: 1. There are no dumb ideas. 2. Don’t criticize other people’s ideas. 3. Build one idea upon another. 4. Reverse thought of “quality over quantity”. § Practice explaining these rules to a partner. What will you say? How could you use there rules (or others like them) with your group? Jones, M. (1998). “The Thinkers Toolkit: 14 Powerful Techniques for Problem Solving”. New York: Three Rivers Press.
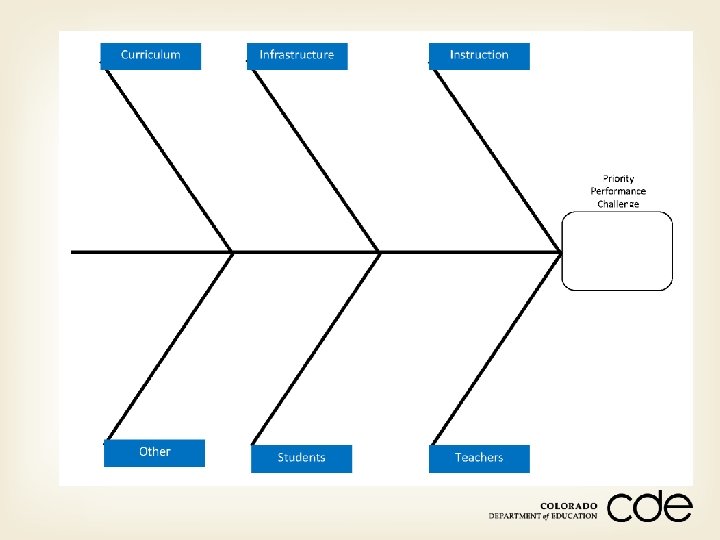
Brainstorming and Categorizing: Two Approaches § Tree (fish) Diagram: § Start with “typical” categories of root causes of performance challenges. § Brainstorm within these categories. § Circle Map: § Brainstorm causes of performance challenges. § Group like causes together to form categories.
Tree Diagram: Brainstorm Causes within Categories Review Tree Diagram Directions (Tools, p. 85). 1. Clarify the question that will focus the brainstorming. 2. Determine pre-defined root cause categories, consider: § Causal Categories (Wellman and Lipton) – Toolkit, p. 91 § Levels of Root Causes (Preuss) – Toolkit, p. 93 § Research-Based Factors (Marzano) – Toolkit, p. 95 3. Set up the “Tree Diagram” (Example; Tools, p. 83). 4. Brainstorm within categories (using sticky notes). 5. Summarize within each category.
What context data did we consider? All possible explanations of performance challenge go in the outer circle Possible Explanation Performance Challenge Possible Explanation School Process Data What process(es) did we use? Possible Explanation Perception Data Circle map used with permission from Thinking Maps, Inc. Specific training required before implementing Thinking Maps. For more information, visit www. thinkingmaps. com.
Circle Map, part 1: Brainstorm Causes of Performance Challenges Review Circle Map Directions (Tools, p. 89). 1. Clarify what will focus your brainstorming (priority performance challenge). 2. Set up the Circle Map (Example; Tools, p. 87). 3. Create the frame (identify what data you reviewed in preparation for engaging in root cause analysis). 4. Brainstorm about the possible causes of your priority performance challenge: § § Individuals capture one idea per sticky note. Place sticky notes on the circle map.
Circle Map, Part 2: Categorize your Causes 5. Sort ideas into natural themes by asking: what ideas are similar? § Work in silence with each person moving sticky notes around on the circle map. Keep moving notes until a consensus is reached. § Discuss the groupings. § If some ideas don’t fit into any theme, leave as a stand alone idea. § If some fit more than one, create a copy and put in both groups. 6. Create a short 3 -5 word description for each grouping.
Scenario: Priority Performance Challenges § In the performance indicator areas of achievement and growth, performance in all grade levels and in all content areas are below minimum state expectations and have been flat for the last three years. § The MGP for all grade levels and subgroups in all content areas is below the state expectation of 55 and has been flat (35 -3238) for the last three years.
Scenario: Context Information Group Identified Priorities: § All teachers indicated they have insufficient time for instruction. § 70% indicated they have insufficient access to instructional materials and resources. § 83% indicate teachers do not have an appropriate level of influence in the school, 60% indicated they don’t have effective processes for solving problems. § 65% indicate school leadership does not consistently enforce rules for student conduct. § 65 -70% indicate professional development is inadequate. § 65% indicate curriculum taught does not meet the need of students.
Practice Brainstorming, Categorizing, and Summarizing 1. With your table group, select an approach (Tree Diagram or Circle Map). 2. Recorders, draw a Tree Diagram or Circle Map on a flip chart page. 3. Use the directions for that approach (Tree Diagram Directions; Tools, p. 85 or Circle Map Directions; Tools p. 89). 4. Focused the Rocky ES “priority performance challenge”, brainstorm, categorize and summarize your explanations for why the school has that pattern of performance. Consider the context for Rocky ES as well. 5. Capture summary statements on the flip chart.
Learning from Colleagues § Gallery Walk. § With your table group, view each of the flip chart pages where other groups have captured their brainstorming, categorizing and summarizing of explanations of priority performance challenges. § Return to your table and consider: § What did we see in the work of the other groups? § Is there anything we would refine about our current explanations?
How groups “get off track” brainstorming and categorizing Off Track § Group members Getting Back On Track § § “shut down” or “evaluate” ideas during brainstorm. § § Some group members don’t participate. § § Some group members dominate § the conversation. Reinforce rules for brainstorming. Use sticky notes for individual brainstorming before sharing ideas with group. Use a whip around or round robin where everyone gets a turn to add something. Ask individuals who haven’t had a chance to contribute what they think or would add. Pull aside “dominant” group members and ask them to help elicit information from all group members.
Tools to Support Root Cause Analysis Step: Tools to use: Analysis 1. Focus on a performance challenge (or closely related performance challenges). 2. Consider school/district context (process/ perception data). 3. Generating explanations (brainstorm). Categorize/ classify explanations. 4. 1. UIP Handbook, Quality Criteria (Priority Performance Challenges). 2. Multiple Measures; Data Intersections; Equitable Distribution of Teachers; TELL Survey Basics; Resources available from CDE; Inventory. 3. Brainstorming Strategies; Identifying Causal Theories. 4. Tree Diagram (and directions); Circle Map (and directions); Causal Categories (Wellman); Levels of Root Causes (Preuss); Marzano Factors.
Planning to Facilitate Root Causes Analysis § Take out the Planning to Facilitate Root Cause Analysis (note catcher, p. 8). § Make notes about how you will categorize and summarize explanations for priority performance challenges: § What approach will you use? What materials/tools will you use? § How will you facilitate this? § What will you do to prepare?
Steps in Root Cause Analysis 1. Focus on a performance challenge (or closely related performance challenges). 3. Generate explanations (brainstorm). 4. Categorize/ classify explanations. 5. Narrow and prioritize explanations. 6. Deepen thinking to get to a “root” cause. 7. Validate with other data. 8. Incorporate external reviews. Iterative 2. Consider school/district context (process/perception data).
Narrowing the Explanations § An approach to identifying explanations that are within the group’s locus of control or at least their sphere of influence. § Read: Criteria for Narrowing Explanations (Tools, p. 97). § Key ideas: § Setting aside explanations outside of our control doesn’t mean not considering them as relevant. § This may result in refocusing an explanation from student characteristics to adult actions. § Powerful: Ask folks to “tell a story” for how the proposed explanation resulted in the pattern of performance for the school. § Clarifying the language matters.
Practice: Narrowing Explanations 1. Eliminate (take sticky notes off and set aside) any explanation which the school cannot influence or control (e. g. , student characteristics). 2. Eliminate additional explanations which fail to meet the following criteria: § It derives logically from the data. § It is an explanation, not just an opinion. § It is plausible, it could be verified or tested. 3. Prioritize your remaining explanations (getting down to at most two), and circle your priority explanations. 4. Clarify the language, if needed, for your priority explanations.
How groups “get off track” while narrowing explanations Off Track Getting Back On Track § § Provide a separate parking lot where folks can put those explanations. Go back to them to identify associated “adult actions” (e. g. , instead of our students don’t come with enough vocabulary, we don’t have a specific intervention to address vocabulary gaps our students come with). § Review explanations that groups have removed to ask the question – can we influence this? How? § § Group stays focused on explanations over which they have no control or influence (e. g. , student background knowledge). Group removes explanations that are core to their performance challenges and that they could possibly influence but do not control (e. g. , district curriculum). Other?
Steps in Root Cause Analysis 1. Focus on a performance challenge (or closely related performance challenges). 3. Generate explanations (brainstorm). 4. Categorize/ classify explanations. 5. Narrow and prioritize explanations. 6. Deepen thinking to get to a “root” cause. 7. Validate with other data. 8. Incorporate external reviews. Iterative 2. Consider school/district context (process/perception data).
How to deepen thinking. . . § Two tools to deepen team thinking about getting to root causes: § The Five Why’s (Root Cause Identification Form). § Multi-Flow Map (cause effect). § Both based on getting beyond symptoms to deeper causes of performance challenges.
Deepening to Root Causes: The Five Why’s § Turn to The Five Why’s - Root Cause Identification Form (Tools, p. 99). § Steps: 1. Write your priority performance challenge in the top margin of this form (as a reminder). 2. Write your current best explanation in the upper quarter of the form. 3. Ask “Why” about the explanation. Capture the collective “because”. 4. Repeat this process for each “because” until you have done this five times.
Getting to Root Cause Because Why? Priority Explanation Priority Performance Challenge Because Why? Priority Explanation Multi-flow map used with permission from Thinking Maps, Inc. Specific training required before implementing Thinking Maps. For more information, visit www. thinkingmaps. com. (Tools, p. 101)
Try out: Deepening to Root Cause § Choose someone to be the recorder and to write one priority explanation at the top of the worksheet. § Begin the process of asking “why” and identifying “because” for your explanation following the directions on the form. § Circle your “root cause” explanation(s).
How groups “get off track” while deepening to root causes Off Track Getting Back On Track § § Have the group go back up a level and ask why, because again. Put this restriction on their response: identify something they can control, shift the answer into something they can at least influence, stay at the level above. § Go back to the original explanation (or one step above in the why because process). Consider adding an “and” or using the later explanation to provide examples or details about the over-all explanation. § § The group gets to a “because” that is something the cannot control or influence (rabbit hole). The “because” is too narrow – results in a root cause that doesn’t reflect the magnitude of their priority performance challenge(s). Other?
Planning to Facilitate Root Cause Analysis § Turn to the Planning to Facilitate Root Cause Analysis (note catcher, p. 8). § Make notes about how you will narrow and prioritize explanations and deepen thinking to root causes: § What tools/resources will you use? § What data will your team review prior to root cause analysis? How will you facilitate groups considering context data? § What will you need to do to prepare for this step in root cause analysis?
Steps in Root Cause Analysis 1. Focus on a performance challenge (or closely related performance challenges). 3. Generate explanations (brainstorm). 4. Categorize/ classify explanations. 5. Narrow and prioritize explanations. 6. Deepen thinking to get to a “root” cause. 7. Validate with other data. 8. Incorporate external reviews. Iterative 2. Consider school/district context (process/perception data).
What additional information do we need to validate our “root cause” explanations?
Validate Root Causes (example) Priority Performance Challenge: The % proficient/adv students in reading has been substantially above state expectations in 3 rd grade but substantially below and stable (54%, 56%, 52%) in 4 th and 5 th for the past three years. Possible Root Causes Questions to Explore Data Sources Validation K-3 is using new teaching strategies, 4 -5 are not. What strategies are primary vs. intermediate teachers using ? Curriculum materials and Instructional plans for each grade. K-3 strategies are different from 4 -5. Less time is given to direct reading instruction in 4 -5. How much time is devoted to reading in primary vs. intermediate grades? Daily schedule in each grade level. No evidence that less time is devoted to reading in 4 -5. More ELL students in grades 4 & 5. Is there a difference between ELL and other students’ scores? NWEA results disaggregated by ELL status. ELL student performance in reading is higher.
Validating Root Causes § Typically will require time outside of the rest of the RCA. § Must be explicitly identified in the UIP Data Narrative. § Taps Process and Perception Data. § Could include the same data used in considering the school/district context. § Consider the Inventory of Data Other than Performance Data. § May require additional data collection (e. g. , identification of what instructional program is being used in different grade levels). § External Reviews can provide data for validation of root causes.
Practice: Validating Our Theories 1. Use the Validate Root Causes job aide to identify additional data needed to verify possible root causes (Tools, p. 103). 2. Identify at least two additional data sources that could help. 3. On a flip chart page, capture the priority performance challenge, possible root cause, questions it raises, and two additional sources of data that could be used to validate the identified root causes. 4. Share your example.
Data Wall Chart Priority Performance Challenge: Possible Root Cause: Questions to explore: Data sources:
Did we get to root causes? 1. Ask the key questions for identifying whether a cause is a root cause: § Would the problem have occurred if the cause had not been present? § Will the problem reoccur if the cause is corrected or dissolved? § Will correction of dissolution of the cause lead to similar events? 2. Make any final revisions to root cause explanation(s) as needed. Preuss, P. (2003). Root Cause Analysis: School Leaders Guide to Using Data to Dissolve Problems, Larchmont, NY: Eye on Education.
Tools to Support Root Cause Analysis Step: Tools to use: 1. Narrow and prioritize explanations. 1. Criteria for Narrowing 2. Deepen thinking to get to a “root” cause. 2. The Five Why’s: Root Cause 3. Validate with other data. Explanations. Identification Form; Getting to Root Cause. 3. Validate Root Causes; Inventory of Data other than Performance Data. 4. Did we get to root causes questions?
Planning to Facilitate Root Causes Analysis § Take out the Planning to Facilitate Root Cause Analysis (note catcher, p. 9). § Make notes about how you will validate root causes with other data: § What approach will you use ? What materials/tools will you use? § How will you facilitate this? How will you ensure teams “get back on track” if they “get off track”? § What will you do to prepare?
Steps in Root Cause Analysis 1. Focus on a performance challenge (or closely related performance challenges). 3. Generate explanations (brainstorm). 4. Categorize/classify explanations. 5. Narrow and prioritize explanations. 6. Deepen thinking to get to a “root” cause. 7. Validate with other data. 8. Incorporate external reviews. Iterative 2. Consider school/district context (process/perception data).
External School Reviews § An on-site review of school processes (and school staff perceptions) designed to identify causes of low school performance. § Reviewers include: former school leaders, other experts. § Final Reports are organized by topics/standards/focus areas derived from the “effective schools literature. ” § Usually includes: § Findings – Strengths and Weaknesses (areas for improvement). § Recommendations (which may or may not be prioritized). § Several different entities providing external reviews in Colorado schools (state contractors, districts, vendors).
External and Internal Add Value § The lens/perspective of staff within a school and the external reviewers about what is happening in the school are different. § Teachers: § Deeply understand their classroom. § May understand to some degree team mates’ classrooms. § May not understand what is happening across the school. § External Reviewers: § Have a perspective of what is happening across the school. § May only have a shallow understanding of each individual classroom. § Both add value to Root Cause Analysis.
Example: Rocky ES DRV Report § Share with a partner. Turn to the Diagnostic Review Report (Scenario, p. 15). § Consider: § How is the report organized? What categories structure the organization of findings? § Where are the findings? § Where are the recommendations? § Do you have questions about what is included in this report?
Including External Reviews in RCA § § § Before reviewing External Review Reports: 1. Determine on what priority performance challenge(s) to focus. 2. Consider school/district context (process/perception data). 3. Generate explanations (brainstorm). 4. Categorize/classify explanations. Review external report (with team): 1. Identify key findings that could help explain priority performance challenges. 2. Capture each on a sticky note (use a different color than brainstormed explanations). 3. Add to categorized explanations. Proceed with Narrowing Explanations
Example
Including External Reviews in RCA § Narrow and prioritize with additional explanations in the mix. § Determine if findings of External Reviews align with prioritized explanations. § Go back to External Review Results as a source of data for validating root causes.
Planning to Facilitate Root Causes Analysis § Take out the Planning to Facilitate Root Cause Analysis (note catcher, p. 10). § Make notes about how you will incorporate the findings from external reviews into your root cause analysis: § What materials/tools will you use? § How will your facilitate this? § What will you do to prepare?
Follow-Up: After Root Cause Analysis 1. With the full group, or a smaller sub-set (leadership team): § Validate root causes. § Identify additional data used in validation. § Evaluate the quality of the root causes identified against the UIP Quality Criteria. § Make revisions if necessary. 2. School leaders, or smaller sub-set of staff (leadership team): § Describe root cause(s) of each priority performance challenge in the UIP Data Narrative. § Describe the process by which root causes were identified.
Quality Criteria for Unified Improvement Planning § Review: UIP Quality Criteria, Section I, Data Narrative and Section III, Root Cause Analysis (Tools, p. 11). § Consider: § To what degree does the root cause meet the quality criteria? § How could the root cause be improved?
Capturing Root Causes in the Data Narrative § Turn to Data Narrative Outline (Tools, p. 15). § Root causes must be explicitly associated with priority performance challenges. § Identify what must be included in the Data Narrative about Root Causes. § Note: Root Causes are also listed in the: § Data Analysis Worksheet. § Action Plan (associated with major improvement strategies).
Planning to Facilitate Root Causes Analysis § Take out the Planning to Facilitate Root Cause Analysis (note catcher, p. 10). § Make notes about how to accomplish the follow-up that must occur after Root Cause Analysis is completed: § What materials/tools will you use? § How will your facilitate this? § What will you do to prepare?
Agenda Root Cause Analysis Background Preparing for Root Cause Analysis Facilitate Root Cause Processes Steps in Root Cause Analysis
Your Turn to Practice! § Groups of five people. § Each person in the group will facilitate one or two of the steps in the process: § Focus on a performance challenge (or closely related performance challenges). § § Consider school/district context (process/perception data). § § Narrow and prioritize explanations. Generate explanations (brainstorm). AND Categorize/classify explanations. Deepen thinking to get to a “root” cause.
Getting Ready § Form Groups of Five. § Determine facilitation responsibilities (see “sign-up sheets”). § When not facilitating, be an “Engaged Participant” – review that role. § We will create a “pace” for the groups to work through the different steps. § Take time to prepare for your facilitation component: § Use “Scenario Two: Mountain Elementary School”. § Use your notes of “Planning to Facilitate Root Cause Analysis” for that step. § Identify any additional questions you have that we can answer before your group gets started.
Steps in Root Cause Analysis 1. Focus on a performance challenge (or closely related performance challenges). 3. Generate explanations (brainstorm). 4. Categorize/ classify explanations. 5. Narrow and prioritize explanations. 6. Deepen thinking to get to a “root” cause. 7. Validate with other data. 8. Incorporate external reviews. Iterative 2. Consider school/district context (process/perception data).
Reflect on Experiences Facilitation Root Cause Analysis Steps § De-Brief with your “practice” group: § What was effective about your practice root cause analysis? § What could have be improved upon from your practice root cause analysis? § Do you have additional questions now? § Individually make any additional notes/revisions to Planning to Facilitate Root Cause Analysis (note catcher, p. 8 -12). § Share out additional questions.
Give us Feedback!! § Written: Use sticky notes §+ the aspects of this session that you liked or worked for you. § The things you will change in your practice or that you would change about this session. § ? Question that you still have or things we didn’t get to today. § Ideas, Ah-Has, Innovations. § Oral: Share out one Ah Ha!