KAIZEN Theme selection Prepared by Francisco M Chibunda

KAIZEN Theme selection Prepared by Francisco M. Chibunda QIT SECRETARY 1

Introduction § KAIZEN-Theme selection is the first step, among the seven steps of KAIZEN process of solving the problems that exist in a workplace which need to be taken by staffs who want/wish to improve their Quality of Services for clients. Prepared by Raymond Dibogo 2

Definition of different terms • Theme is Synonymous to subject, topic, idea, or subject matter. • It is usually a broad statement of the problem. • It’s usually encompassing statement. • Problem is the gape between ideal condition and current condition, knowing what should be but actually is not. 3

KAIZEN Process KAIZEN process has seven steps called “Quality Control story” which established in a sequential manner, named; Step 7: Standardization of effective countermeasures Step 6: Check effectiveness of the countermeasures Step 5: Implementation of identified countermeasures Step 4: Identification of countermeasure Step 3 Root cause analysis Step 2: Situation analysis Step 1: Selection of KAIZEN Theme

How to select KAIZEN theme • There are four main steps of KAIZEN them selection: üStaff discussion on difficulties that staffs &clients are facing at work place daily. üIdentifying some problems raised on the discussion based on data that shows the gravity/seriousness of the problem to both internal and external clients. . 5

üCollect the possible suggestion aroused in the discussion based on; - Claims from internal & internal clients. - Mistakes which are often happening. - Un availability of material resource that disturbing smooth practice of daily routine work. -Working process that takes time & hard to do or finish. üEvaluating feasibility of each KAIZEN theme suggested, based on given criteria's as follows. 6

Evaluation of feasibility of KAIZEN them • Criteria for suggested KAIZEN are, üImpact. Examine the degree of impact when problem reduced or solved. üUrgency. Examine if a theme has to be tackled immediate or not. üRealization. Examine if the suggested theme if is possible to be tackled with the available and existing resources or not. üBurden to service users. Examine if it is of less burden to service users. 7

• Key point need to be set and agreed upon, that the suggested KAIZEN theme/ idea with high points will be selected. Key O stand for 2 points, + stand for 1 point, X stand for 0 point. • Observe an example of matrix table for KAIZEN theme selected in certain ward. 8

KAIZEN theme selection matrix Possible theme Immediate effect Urgenc Realizatio y n Burden to service users Score ward space expanded + X 2 giving wrong medication to patients is reduced O O O + 77 sampling mistake of laboratory test is reduced + + O O 6 medicine wastage volume is reduced O + + + 5 9

Key points • KAIZEN-Theme selection need to be established on positive wishes of staffs-example we would like to do…. /to be…. • KAIZEN theme is not a permanent theme, should be implemented within a short period of time, (approx 6 months). • Should have grate impact. • Does not require many resources and possible to realized. • Presence of data's on all process done for selection of theme. • Availability of the explanation on why, and how KAIZEN theme chosen. 10

Did you select good KAIZEN theme? • Impact • What is the impact, when it is implemented? • Is it possible to get impact with little inputs? • Urgency • Do we have to do it immediately? • Possibility • Is it possible to complete whole KAIZEN process in 6 months? • Is it possible to carry out KAIZEN process within your department? • Are we not giving a burden to service users?

• Resources • Possible to implement with existing resources? • Require involvement of many sections? • Is data and information available for situation analysis? If not available, is it possible to collect? • Who and how many staff are going be involved?

KAIZEN Step 2: “Situation Analysis”

Objectives of the session At the end of the session, trainees are able to: 1) 2) 3) 4) Define what is situation analysis in KAIZEN process Describe process of situation analysis Describe how to develop and utilize Pareto chart properly Demonstrate the process of situation analysis 14

KAIZEN Process STEP 6 STEP 5 STEP 4 STEP 3 STEP 2 STEP 1 Standardization 7 Check effectiveness of countermeasure Implementation of countermeasure Identification of countermeasure Root Cause Analysis Situation Analysis Selection of KAIZEN theme 15

Steps of situation analysis in KAIZEN process 1 2 Identify contributi ng factors Identify measura ble data and informati on 3 Define methodol ogies for data collection 4 5 6 7 Conduct data collection Develop a calculatio n table Develop Pareto chart Set target 16
 1. Brainstorm to identify contributing factors of the problem")
Steps of situation analysis (1) 1. Brainstorm to identify contributing factors of the problem (KAIZEN theme) “Large problem” is composed of several contributing factors (composing elements). Contributing factor 1 Contributing factor 4 Contributing factor 2 Contributing factor 3 Large Problem 17
 2. Identify measurable data and information of each identified")
Steps for Situation analysis (2) 2. Identify measurable data and information of each identified contributing factor 3. Identify methodologies of the data collection; - Period of data collection (maximum 1 months) - Kinds and number of data source: retrospective data or prospective data - Collection method 18
 4. Conduct data or information collection according to the")
Steps for Situation analysis (3) 4. Conduct data or information collection according to the methodologies 5. Develop a calculation table of frequency and its accumulation ratio to compile the data 19

Example of calculation table KAIZEN Theme is “Giving wrong medication is reduced” Before KAIZEN SQ# Frequency Cumulative frequency Accumulation ratio 1 Number of giving wrong injectable medicines 25 25 46% 2 Number of giving wrong inhale medicines 16 41 76% 3 4 Giving wrong oral medicines Giving wrong volume of insulin Number of giving wrong ointment Total 6 5 47 52 87% 96% 2 54 100% 54 - - 5 Contributing factors Descending order Calculation formulas will be explained on the next slide 20

Points of development of calculation table • Contributing factors will be put in descending order of its frequency • Cumulative frequency = (its frequency) + (the previous cumulative frequency) • Accumulation ratio = (each cumulative frequency) ÷ (Grand total of frequency) × 100 Please see next slide!! 21
 6. Develop “Pareto chart” based on the data table,")
Steps for Situation analysis (4) 6. Develop “Pareto chart” based on the data table, to identify prior contributing factor(s) to be solved “Calculation table” “Pareto chart” 22

What is Pareto chart? o_chart 25 90. 0 70. 0 15 60. 0 50. 0 10 40. 0 30. 0 5 Accumulation ratio (%) 80. 0 20 Frequency • It is a type of chart that contains both bars and a line graph, where individual values are represented in descending order by bars, and the cumulative total is represented by the line • One of the seven basic tools of quality control http: //en. wikipedia. org/wiki/Paret Cut off line is 80% 100. 0 20. 0 10. 0 0 0. 0 1 2 3 4 Contributing factor Frequency 5 Accumulation ratio (%) Example of Pareto chart 23

Pareto principle • It is also called as “ 80: 20 rule” • It is a technique helps to identify the top 20% that needs to be addressed to resolve the 80% of the problems Vilfredo Federico Damaso Pareto, Italian economist, developed this concept 24

Necessity of Pareto chart in KAIZEN Process • To identify “large contributing factors” • If the large contributing factor(s) is solved, the situation with the problems will be improved effectively and easily Reduced by eliminated the contributing factor “ 1” Problem Contributing factors Situation with problems before KAIZEN (100% of the problem) Situation with problems after KAIZEN (reduced problem) 25
 Data table and Pareto Chart Maximum number of the axis shall match with")
(Example) Data table and Pareto Chart Maximum number of the axis shall match with the frequency of the first faactor Before KAIZEN 5 Number of giving wrong injectable medicines Number of giving wrong inhale medicines Giving wrong oral medicines Giving wrong volume of insulin Number of giving wrong ointment Total 1 2 3 4 • • • Accumulatio Frequency Cumulative frequency n ratio 25 25 25 20 46% 16 41 76% 6 47 87% 5 52 96% 2 54 100% 54 - - Period of data collection: 31 st January 2014 to 30 th February 2014 (30 days) Data source: medication and treatment chart Number of investigated patient (chart): 50 Cut off line is 80% 100. 0 90. 0 80. 0 70. 0 60. 0 50. 0 40. 0 30. 0 20. 0 10. 0 5 Accumulation ratio (%) Contributing factors Frequency SQ # 15 10 5 0 1 2 3 4 Contributing factor Frequency Accumulation ratio (%) Methodologies of data collection need to be described clearly. 26

Target setting • The last step of KAIZEN Step 2 is “target setting” • “Desire” and “target” is different We want to reduce 70% of the problem! This is our “target of KAIZEN” What is the reason of 70% reduction of the problem? ? ……… We just want… Is it just your desire? It is important to explain the reasons of your target setting. 27

Pareto rule can be useful for target. Ideally, setting 80% of the problem (vital few) is the target of the KAIZEN based on Pareto rule. But it is difficult…? ! In the example above, if your target is: • “ 46% reduction of KAIZEN theme” it means to solve all of the 1 st contributing factor • “ 87% reduction of KAIZEN theme” it means to solve all of the 1 st, 2 nd and 3 rd contributing factors) 28

Cont. Target setting Our target is to make “wrong medication” zero by April 2016. By when? By April 2016 What? Number of wrong medication How? 46% reduction * Do not forget: Need to consider “the problem is still remained even if you achieve your target 29

STEP 3: ROOT CAUSE ANALYSIS

KAIZEN Process STEP 6 STEP 5 STEP 4 STEP 3 STEP 2 STEP 1 Standardization 7 Check effectiveness of countermeasure Implementation of countermeasure Identification of countermeasure Root Cause Analysis Situation Analysis Selection of KAIZEN theme 31

KAIZEN Step 2 and Step 3 1 1 2 3 4 2 5 Identify the contributing factors Prioritize the contributing factor(s) to be solved KAIZEN Step 2 Find root causes of the contributing factor(s) KAIZEN Step 3 32
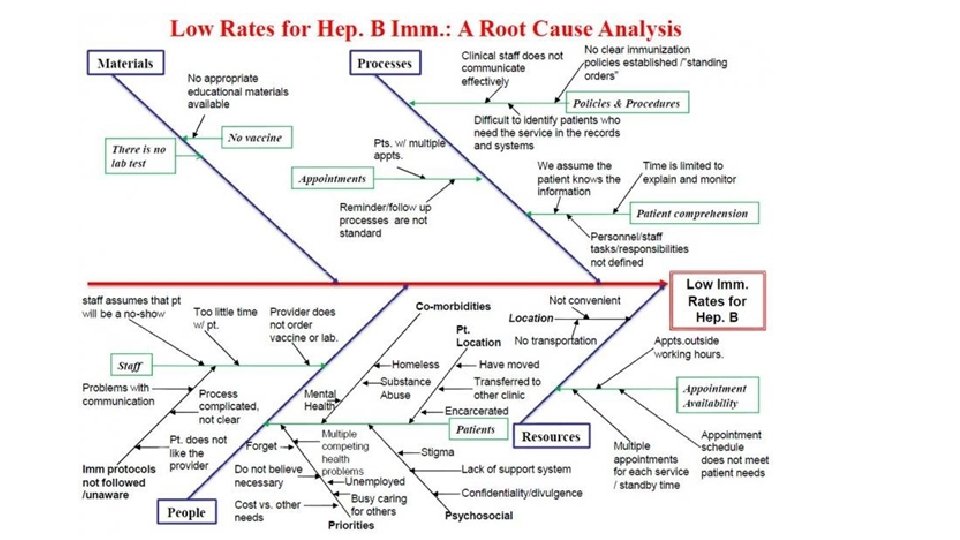
 Cause Effect Cause • It is developed by Prof. Kaoru")
Cause-Effect diagram (Fishbone diagram) Cause Effect Cause • It is developed by Prof. Kaoru Ishikawa • It connects “effect” and “cause(s)” systematically with line • Clarification of relations between effect and cause(s) 33
 • Put effect (= the major contributing factor)")
Steps of root cause analysis (1) • Put effect (= the major contributing factor) in the step 2 as ”head of fish”; “Why (the contributing factor) happened? ” • Draw heavy line from left to the effect on the center; ”Backbone of fish” Why (the contributing factor) happened? 35
 • Seek and list up all possible causes")
Steps of root cause analysis (2) • Seek and list up all possible causes for the effect (the primary cause) • Avoid to mention to things in terms of “recourse shortage”: No money, No human resources, No materials etc. List of the possible causes Why (the contributing factor) happened? Because …. 36

Grouping of causes • Human: knowledge, skills health conditions, physical conditions etc. • Soft: system, methodologies, mechanism etc. • Hard: material, equipment, furniture, tools etc. • Environment: facility environment (water supply, electricity, smell, humidity etc. ), working environment (work space, accessibility of materials, arrangement etc. ) 37
 • Narrow down cause(s) of each primary cause")
Steps of root cause analysis (4) • Narrow down cause(s) of each primary cause (the secondary cause) • Avoid to mention to things in terms of “resource shortage” Environment Human Why (the contributing factor) happened? Hard (machine/equipment) Soft (System and methodology) 38
 • Find out “root causes” by asking “Why")
Steps of root cause analysis (5) • Find out “root causes” by asking “Why it is happening? ” in enough time (recommended 5 times) for each possible causes listed on primary branch, and branch them into secondary, tertiary. Human One Two Make circle clearly on it! This is Root cause Four Five times!! Why (the contributing factor) happened? Three 39

Tips for developing Fishbone analysis • Effect = Major contributing factor, which was identified in Step 2 • Effect is not equals to “KAIZEN Theme” • If two contributing factors account for 80% (Pareto rule) in Step 2, you need to develop two fishbone diagrams 40

Cont. • Repeat “Why~? – Because~. ” in 5 times • Consider “your own work / work place” before searching a cause of others • Avoid blaming other sections; KAIZEN is for own • Do not deny the opinions from other group members 41

Cont. • Avoid mentioning “shortage of resources”; “No money”, “No human resource”, “No material” etc. • Your analysis is stopped • Avoid to guess and assume the causes • Use your experiences, knowledge and existing information in your working place 42
 are not identified properly, any countermeasures could not be come up…")
If root cause(s) are not identified properly, any countermeasures could not be come up… The problem will never be solved!! 43

KAIZEN Step 4: “Identification of countermeasure”

KAIZEN Process STEP 7 Standardization STEP 6 Check effectiveness of countermeasure STEP 5 STEP 4 Implementation of countermeasure Identification of countermeasure STEP 3 STEP 2 STEP 1 Root Cause Analysis Situation Analysis Selection of KAIZEN theme 45
")
KAIZEN Step 3 and Step 4 Find out root causes of the contributing factor(s) Find out countermeasur es to solve the root causes Identify realistic countermeasures in our working situation/condition QC tool: Tree diagram KAIZEN Step 3 QC tool: Matrix diagram KAIZEN Step 4 46

Outline of how to make Tree Diagram 1. Put all the identified root causes in Step 3 on left end 2. Brainstorm countermeasures with team members against identified each root cause • 1 st line countermeasure • Clarify ideal situation towards root cause • Connect the line with each route cause systematically • 2 nd line countermeasure • Discuss detailed activities to realize the 1 st line countermeasure(s) • If identified countermeasures are not clear, we can break them to 3 rd line countermeasures 47
 Primary countermeasures for")
Root causes Root cause 1 Primary countermeasures (1 st line countermeasures) Primary countermeasures for Root Cause 1 (a) Primary countermeasures for Route Cause 1 (b) Primary countermeasures for Root Cause 2 (a) More than one primary countermeasure can be come up with for one root cause Root cause 2 Primary countermeasures for Route Cause 2 (b) Root cause 3 Primary countermeasures for Root Cause 3 (a) 48
 countermeasures Primary countermeasures for Root")
Root causes Root cause 1 Primary (1 st line) countermeasures Primary countermeasures for Root cause 1 (a) Secondary (2 nd line) countermeasures Secondary countermeasure (a) for primary countermeasure(a) Secondary countermeasure (b) for primary countermeasure(a) Root cause 2 Primary countermeasures for Root cause 1 (b) Secondary countermeasure (a) for primary countermeasure(b) Primary countermeasures for Root cause 2(a) Secondary countermeasure (a) for primary countermeasure(a) Secondary countermeasure (b) for primary countermeasure(a) Primary countermeasures for Root cause 2 (b) Secondary countermeasure (c) for primary countermeasure(a) Secondary countermeasure (b) for primary countermeasure(a) 49
 countermeasures Primary countermeasures for Root")
Root causes Root cause 1 Primary (1 st line) countermeasures Primary countermeasures for Root cause 1 (a) Secondary (2 nd line) countermeasures Tertiary … Secondary countermeasure (a) for primary countermeasure(a) Secondary countermeasure (b) for primary countermeasure(a) Root cause 2 Primary countermeasures for Root cause 1 (b) Secondary countermeasure (a) for primary countermeasure(b) Primary countermeasures for Root cause 2(a) Secondary countermeasure (a) for primary countermeasure(a) Secondary countermeasure (b) for primary countermeasure(a) Primary countermeasures for Root cause 2 (b) Secondary countermeasure (c) for primary countermeasure(a) Secondary countermeasure (b) for primary countermeasure(a) 50

Matrix Diagram • Matrix diagram is useful to check feasibility of all the final-line countermeasures “Feasibility check” ……? Can we implement the countermeasures with our available resources? Impact by the interventions? 51

Items for feasibility check Scales for feasibility check Item What should be checked Scale 3 Importance How is the positive impact of solving the problem? No negative impact? Urgency How soon the problem need to be tackled? Difficulty Is it possible to implement the countermeasures technically easy or not? Time long does it take to consumptio How solve the problem? n Are resources (human, financial ) Resources materials, for availability available implementation of countermeasures? 2 1 Meanings High priority, Easy to do Moderate Low priority, Difficult to do 52

Importance Urgency Difficultly Time Consumption Resource availability Feasibility Example of Matrix Diagram Develop training material 3 3 1 1 1 9 Conduct TOT 3 3 3 2 2 3 3 1 3 2 2 3 1 2 2 2 2 2 9 12 13 11 11 13 Countermeasures Sort and Set Develop M&E tool Develop storage rules Weekly monitoring Weekly inventory Scale Meanings 3 High priority, Easy to do 2 Moderate 1 Low priority, Difficult to do • Make a circle on the score of identified feasible countermeasur es Countermeasures get “ 11 points and/above in total out of 15 (>70%)” are selected for implementation 53

It is necessary to clarify the scale and cut off point for feasibility check No clear hand over of medicine Un clear order sheet design Instruction from pharmacy Change system of handing over Redesign of order sheet Feasibility No instructing from pharmacy Develop regulation Resource availability No clear regulation of storage of injectable Conduct sort and set of store Time consumption No proper storage place Training on handling injectable difficulty Staff is not trained Primary Countermeasures Urgency Root cause Importance Cut off=70% Scale: 3= high priority, easy to implement 2= middle level priority 1= low priority, difficult to implement Teaching material development 3 3 1 1 1 9 Conduct training 3 2 1 9 Use labeling and color coding for setting of injectable store 3 2 2 12 Develop M&E tool 3 2 2 2 1 10 Develop regulation of injectable store 3 3 2 11 Sensitize the regulation 3 3 1 2 2 11 Coordinate with pharmacy and develop check sheet 3 3 3 2 2 13 Training and dissemination 3 3 2 2 2 12 Develop handing over note and checklist 3 3 3 2 2 1 1 9 Secondary Countermeasures Improve order sheet with other department 54

Tips for identification of countermeasures • Reflect all identified root causes in Step 3 to Tree Diagram • Check whether detailed countermeasures are identified or not; breakdown of countermeasures by the level of countermeasures 55

Cont. • Consider effective usage of available resources; • Avoid identifying countermeasures with “increase / put something resources” • Discuss countermeasures that can be implemented by your section itself • Check conflict of activities among identified countermeasures 56

KAIZEN Step 5: “Implementation of countermeasure”

KAIZEN Process STEP Standardization 7 STEP Check effectiveness of countermeasure 6 Implementation of countermeasure STEP 5 STEP 4 STEP 3 STEP 2 STEP 1 Identification of countermeasure Root Cause Analysis Situation Analysis Selection of KAIZEN theme 58

Process of Step 5: Countermeasures Implementation CM 1 ◎ ◎ ○ Total Step 5 Difficulty Urgent Importance Step4 Action plan development with 5 W 1 H Sharing action plan with section staff 13 Sharing action plan with QIT CM 2 ○ ▲ ▲ 9 CM 3 ○ ○ ◎ 11 Implement countermeasures Monitoring progress of intervention Check effectiveness Step 6 59

Cont. • Implement ALL the countermeasures identified as feasible measures in Step 4 • Develop an action plan and possible to complete the countermeasures within one to three months • Share the action plan with: • All section staff (Participatory implementation) • QIT (Seek technical inputs) • Monitor progress of implementation of the countermeasures 60

Time allocation for Step 5 • Remember “proper time allocation” for whole process of KAIZEN is maximum6 months • Implementation of countermeasure must be done within 2 -3 months KAIZEN Process Step 1 Step 2 KAIZEN Process Step 3 Step 4 2 months KAIZEN Process Step 5 2 - 3 months KAIZEN Process Step 6 Step 7 1 month 61

Benefit of development of action plan Developing a action plan with “ 5 W 1 H” will be of benefit to; • Define detailed actions to implement the countermeasures with “ 5 W 1 H” • Improve communication among section staff • Unify the sense of purpose of the staff in implementation of KAIZEN • Simplify a progress monitoring 62

Clarification of “ 5 W 1 H” Clarification Example Why? Why we need to take this countermeasure To strengthen stock management of medicines Who? Who is the responsible person of the countermeasure Ward in-charge and KAIEN team When? Timing or period (deadline) of the countermeasure By 27 th of October 2015 Where? Place where the countermeasure taken At the ward What? What is objective of the countermeasure Rules and regulation of storage of the medicines How? How do you do for the countermeasure (action, verb) Develop 63

Example of Action plan format Counter measure Who 1 Develop of storage rules with pharmacists Ward Incharge, ward pharmacist 2 Develop checklist and handing over note WIT, Ward In-charge 3 …… 4 …… What Where Storage rules and regulations At the ward Checklist and handing over note At the ward When Why How By Dec. 01 Strengthen stock management of the medicines Develop By Dec. 15 Reduce miscommunicat ion among shifts Develop 64

Monitoring a progress of the implementation • Develop a monitoring checklist by clarifying: • Date of monitoring • Responsible person(s) of the monitoring • Progress of monitoring • Utilize the checklist • Utilize the results of the monitoring • Proper implementation: continue • Delay of the implementation: re-plan and implement • Impossible to implement: clarify the reasons of why not implemented 65

1 ………… 2 ……………… 3 ………. 4 ……………. 5 ………… What Where When Why How Progress Who checked Counter measures Date of monitorin g Example of action plan with progress checklist / / / Keys for progress check G: According the plan D: Delay N: Not implemented 66

Tips for successful implementation • It needs to check again whether all countermeasures are possible to be carried out within the section or not • Remember “KAIZEN is participatory activities” • “WHO” in your plan is not only “in-charge” • Sharing the plan with all section staff 67

Cont. • Action plan must be displayed on the notice board for staff • To remind staff of implementation of KAIZEN • To promote participatory implementation of KAIZEN • Conduct periodical monitoring with progress checklist 68

KAIZEN Step 6 : “Check effectiveness of countermeasure”

KAIZEN Process STEP Check effectiveness of countermeasure STEP 6 STEP 5 STEP 4 STEP 3 STEP 2 STEP 1 Standardization 7 Implementation of countermeasure Identification of countermeasure Root Cause Analysis Situation Analysis Selection of KAIZEN theme 70

Outline of effectiveness check 1 Situation analysis 3 2 Effectiveness check - Reduction rate - Comparison Pareto chart Relation between countermeasures and effectiveness Not implemented・ Not effective Implemented・ Not effective Not implemented ・ But effective 4 Implemented・ Effective Go to Step 7: Standardization 71

How to check effectiveness of KAIZEN • Compare frequency and reduction rate of frequency between before and after KAIZEN • Check achievement to your target set in Step 2 (reduction rate) • Compare other information in terms of: • • • Cost Work labor cost effectiveness Quality Work process Human resource etc. 72
 • Review methods of situation analysis done in")
Data collection (Situation analysis after KAIZEN) • Review methods of situation analysis done in KAIZEN Step 2 • Conduct situation analysis in the same methods: • Same data • Same period of data collection • Same methodologies of data collection 73

Development of a comparison calculation table Before KAIZEN SQ # 1 2 3 4 5 Contributing factors Number of giving wrong injectable medicines Number of giving wrong inhale medicines Giving wrong oral medicines Giving wrong volume of insulin Number of giving wrong ointment Total After KAIZEN Reduction Cumulativ Accumulati Cumulative Accumulati of frequency rate (%) Frequency e Frequency on ratio (%) frequency 25 25 46. 3 7 7 46. 7 18 72. 0 16 41 75. 9 4 11 73. 3 12 75. 0 6 47 87. 0 3 14 93. 3 3 50. 0 5 52 96. 3 1 15 100 4 80. 0 2 54 100 0 15 100 2 100. 0 - - 15 - - 39 72. 2 54 Formula of reduction rate Data of before KAIZEN Data of after KAIZEN Reduction between before and after KAIZEN 74

Development of comparison Pareto chart Adjusting scale as same level of before KAIZEN 100. 0 After KAIZEN 25 100. 0 90. 0 80. 0 15 60. 0 50. 0 10 40. 0 30. 0 5 20. 0 70. 0 Frequency 70. 0 80. 0 20 Accumulation ratio (%) 20 Frequency 90. 0 15 60. 0 50. 0 10 40. 0 30. 0 5 20. 0 10. 0 0 0. 0 1 2 3 4 Contributing factor Frequency 5 Accumulation ratio (%) Accumulation ratio Before KAIZEN 25 0 0. 0 1 Frequency 2 3 4 Contributing factor 5 Accumulation ratio (%) Same order of “the contributing factors” between before and after KAIZEN even if the order of contributing factors is changed. 75
 Comparison results between before and after KAIZEN 4 5 25 46. 3")
(Example) Comparison results between before and after KAIZEN 4 5 25 46. 3 7 7 46. 7 18 72. 0 16 41 75. 9 4 11 73. 3 12 75. 0 6 47 87. 0 3 14 93. 3 3 50. 0 5 52 96. 3 1 15 100 4 80. 0 2 54 100 0 15 100 2 100. 0 - 1525 - - 39 100. 0 72. 2 90. 0 80. 0 70. 0 60. 0 50. 0 40. 0 30. 0 20. 0 100. 0 90. 0 80. 0 70. 0 60. 0 50. 0 40. 0 30. 0 20. 0 10. 0 54 20 15 10 5 0 1 15 10 5 1 Accumulation ratio (%) Frequency 2 3 4 Contributing factor Frequency 20 Accumulation ratio 3 25 Frequency 2 Number of giving wrong injectable medicines Number of giving wrong inhale medicines Giving wrong oral medicines Giving wrong volume of insulin Number of giving wrong ointment 25 Total Frequency 1 Contributing factors Before KAIZEN After KAIZEN Reduction Cumulativ Accumulati Cumulative Accumulati of frequency rate (%) Frequency e Frequency on ratio (%) frequency Accumulation ratio (%) SQ # 2 3 4 Contributing factor 5 Accumulation ratio (%) 76

Breaking down your effectiveness • Clarify whether each countermeasures were effective or not • Relation between countermeasures and effectiveness can be categorized into 4 groups Implementation Effectiveness Countermeasure implemented Countermeasure not implemented Effective Not effective ① ② It is effective and need to be standardized It is not effective and need to review measures ③ ④ Need to clarity why it is effective Implement some measures (DO something) 77

Cont. 1. Effectiveness should be measured by each countermeasure 2. The countermeasure that is not implemented but show good effects need to be investigated the reason 3. The countermeasure that is not implemented and cannot measure effectiveness need to be implemented 78

Cont. 3. It is necessary to review countermeasures if the countermeasures were not effective 4. The countermeasures that were implemented and judged as “effective” will be standardized in Step 7 5. The countermeasures may cause bad effects. If bad effects are greater than effectiveness, it is necessary to review the countermeasures 79

Identify effective countermeasures Which countermeasure was leading? ? Your target By doing the countermeasures Expected outcome Achieved Partially achieved Got worse Unexpected outcome Move to KAIZEN Step 7 Good effect Bad effect * Tangible effect, Intangible effect and Ripple effect will be also recognized while Step 6. Review KAIZEN Step 3, 4, 5, 6 Stop doing the countermeasure(s) 80

KAIZEN Step 7 : “Standardization”

KAIZEN Process STEP Check effectiveness of countermeasure 6 STEP 5 STEP 4 STEP 3 STEP 2 STEP 1 Standardization 7 Implementation of countermeasure Identification of countermeasure Root Cause Analysis Situation Analysis Selection of KAIZEN theme 82

KAIZEN Step 7: Standardization • Prevent recurrence of the problem • Sustain “improved situation” Situation after KAIZEN Situation before KAIZEN Standardize effective countermeasures Improvement By effective countermeasures KAIZEN Step 1 - 5 KAIZEN Step 6 KAIZEN Step 7 83

Standardization of effective countermeasures • It is a part of the final step of KAIZEN process • Two parts of standardization: • Development of a implementation plan and its checklist • Practice standardized activities sustainability • Standardization measures must be able to • Maintain the “good effects” by anyone in the workplace • Eliminate waste continuously in costs and workloads 84

Benefits of standardization • Reductions in variability • Easier training of new operators • Reductions in injuries and strain (ensuring safety for internal / external clients) • Baseline for improvement activities Reference: http: //www. lean. org/Workshops/Workshop. Description. cfm? Workshop. Id=20 85

“Recurrence prevention” and “Standardization” • “Prevention of recurrence” is not equals to “standardization” • Prevention of recurrence is to prevent fallback of the improved situation • “Standardization” is very important for proper recurrence prevention 86

Process of standardization 1. List-up all effective countermeasures identified in the previous step 6 2. Develop standardized procedure table by utilizing “ 5 W 1 H” 3. Develop “progress checklist” for standardized implementation plan 4. Share the plan and checklist with all the staff in the section 87

“ 5 W 1 H” for standardization 5 W 1 H Description Why? Necessity of the standardized activity Who? In-charge of the standardized activity When? Period / Frequency of implementation of the standardized activity Where? Place at where the standardized activity is taken place What? Objectives of the implementation (verbs) or tools used for the standardized activity How? Methodology to carry out the standardized activity (verbs) Note that the standardized procedure table is similar with implementation plan in KAIZEN Step 5, however, there are different 88

Standardized procedure table Standardized activities Why Who Check stock condition of all medicines in our section To ensure stock management of sampling container Check handing over between shifts To reduce miscommunicati on between All staff working staff on at the ward reduction wrong medication When In-charge of stock Daily management of the day Before taking over next shift Where What How Ward Inventory checklist Use properly Ward Handing over note and checklist Use properly 89

Progress checklist Standardized action Progress Sustained Check stock condition of all medicines in Not our section sustained Sustained Check handing over between shifts Not sustained Date of checking Checked by Remarks Following STD Not following STD 90

Example of KAIZEN Step 7 Standardized activities Check stock condition of all medicines in our section Why Who To ensure stock In-charge of management of stock sampling management container of the day When Where What How Progress check Sustained Daily Ward To reduce Before Check handing miscommunicatio All staff taking over between n between staff on working at the Ward over next shifts reduction wrong ward shift medication Inventory Use checklist properly Following STD Not following sustained STD Following Handing Sustained STD over note Use properly and checklist Not sustained Not following STD Date of Checked Remarks checking by 91

How to develop progress checklist • Establishing standardized methodology only does not make sense • It must be practiced by everyone in the workplace • The checklist is important and useful tool to monitor how staff are practicing, and the method is sustainable • Progress check must be done frequently • Period of monitoring must be agreed with the workplace and shared with everyone 92

Tips for successful standardization • Remember that KAIZEN should not be “individual issue”, it should be “section issue” • Try to avoided the situation of “only in-charge knows” • Clarify roles and responsibilities of all the section staff in the implementation plan • Emphasize benefits by the standardized work process 93

Cont. • Share the standardized procedures and its checklist with all the staff in the section • Consider and select effective ways for the sharing • Display the standardized procedures on common place in the section (eg. notice board) • Disseminate how to use the checklist • Put proper documents (ex. SOPs) in the place which the procedures are practiced • Remind the staff of the standardized procedure periodically (ex. while morning meeting) • Train the standardized procedures to newly employed staff and students 94

Thank you
- Slides: 95