
LUST Investigation Five Basic Questions 1 Is there
LUST Investigation – Five Basic Questions 1. Is there a problem that warrants action? 2. If so, what is the root cause? • Follow the 98/2 rule! 3. What actions will control the problem quickly and cost-effectively? 4. Are there secondary problems that require action? 5. What additional actions/controls will: üStabilize the situation üGet time working for us, not against us üSet the conditions for natural attenuation
Ten Things to Know and Why 1. Source in the vadose zone • Potential groundwater or vapor issues 2. Porosity of vadose zone • Control vapors and/or remove source? 3. Depth to water • Potential LNAPL?
Ten Things to Know and Why 4. Water table fluctuation • Smear zone 5. Permeability of smear zone • AS/SVE, Injection, Excavation 6. Direction of groundwater flow • Off-site migration • Potential receptors 7. Plume thickness and depth • How/where to treat, contain or intercept
Ten Things to Know and Why 8. Permeability lenses in saturated zone 9. Mass distribution • Transport zones? • Storage zones? • High-mass footprint? (Root cause – 98: 2) 10. Matrix distribution • What are my remediation options?
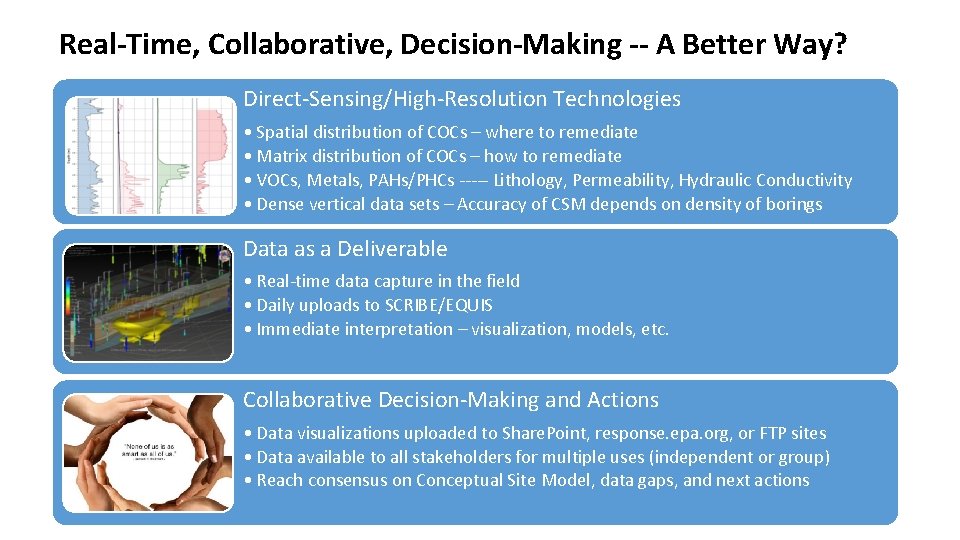
Real-Time, Collaborative, Decision-Making -- A Better Way? Direct-Sensing/High-Resolution Technologies • Spatial distribution of COCs – where to remediate • Matrix distribution of COCs – how to remediate • VOCs, Metals, PAHs/PHCs ----- Lithology, Permeability, Hydraulic Conductivity • Dense vertical data sets – Accuracy of CSM depends on density of borings Data as a Deliverable • Real-time data capture in the field • Daily uploads to SCRIBE/EQUIS • Immediate interpretation – visualization, models, etc. Collaborative Decision-Making and Actions • Data visualizations uploaded to Share. Point, response. epa. org, or FTP sites • Data available to all stakeholders for multiple uses (independent or group) • Reach consensus on Conceptual Site Model, data gaps, and next actions
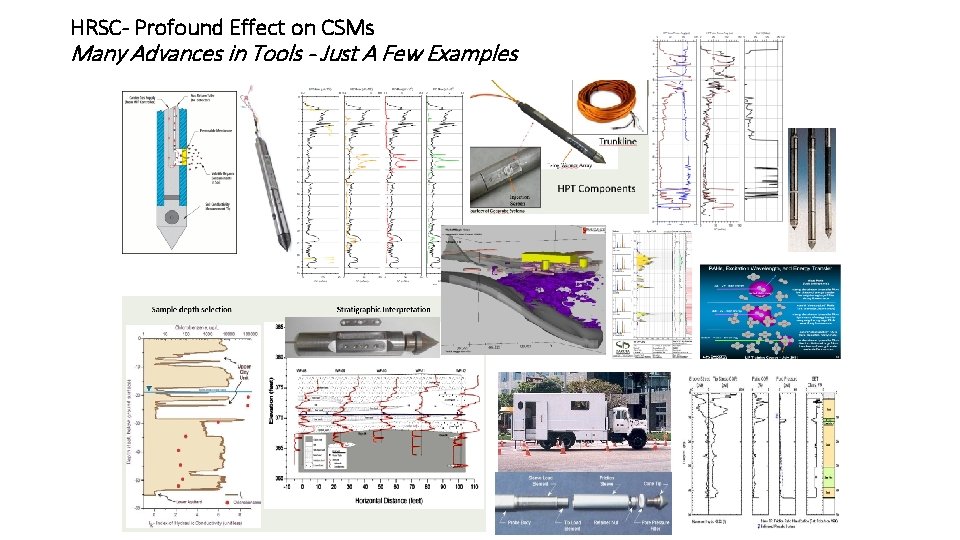
HRSC- Profound Effect on CSMs Many Advances in Tools - Just A Few Examples Profound Effect on CSMs Many Advances in Tools- Just A Few Examples HPT- Hydraulic Profiling Tool CPT- Cone Penetrometer 3 -6
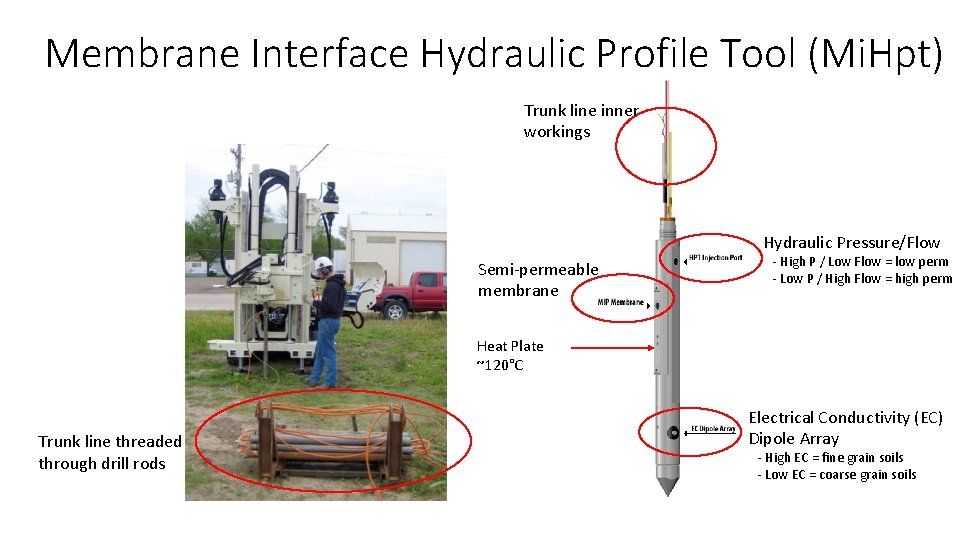
Membrane Interface Hydraulic Profile Tool (Mi. Hpt) Trunk line inner workings Hydraulic Pressure/Flow Semi-permeable membrane - High P / Low Flow = low perm - Low P / High Flow = high perm Heat Plate ~120°C Trunk line threaded through drill rods Electrical Conductivity (EC) Dipole Array - High EC = fine grain soils - Low EC = coarse grain soils
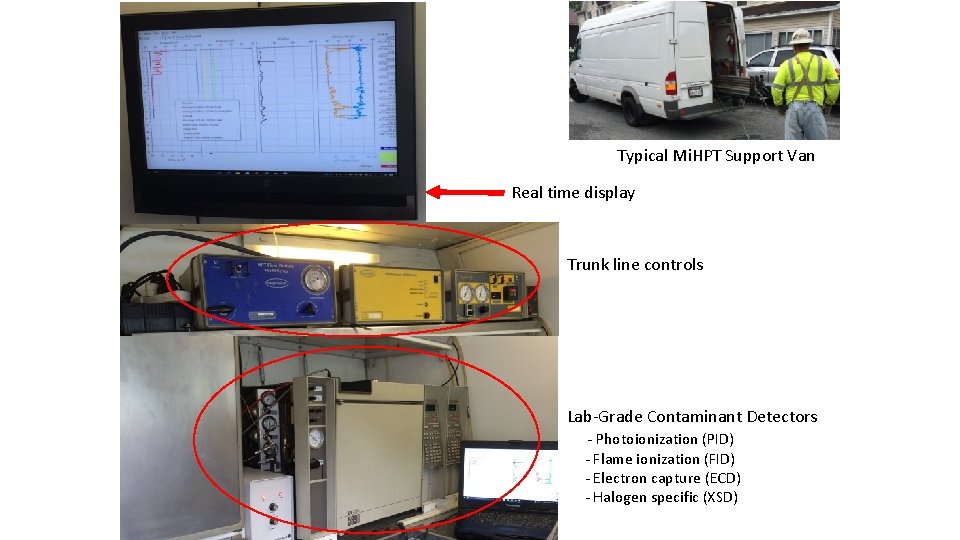
Typical Mi. HPT Support Van Real time display Trunk line controls Lab-Grade Contaminant Detectors - Photoionization (PID) - Flame ionization (FID) - Electron capture (ECD) - Halogen specific (XSD)
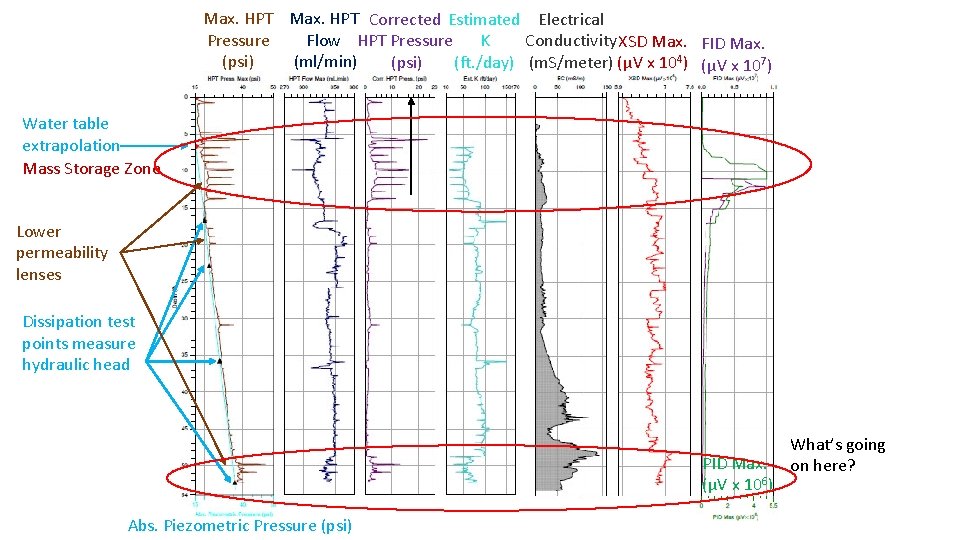
Max. HPT Corrected Estimated Electrical Pressure Flow HPT Pressure K Conductivity XSD Max. FID Max. (psi) (ml/min) (psi) (ft. /day) (m. S/meter) (µV x 104) (µV x 107) Water table extrapolation Mass Storage Zone Lower permeability lenses Dissipation test points measure hydraulic head PID Max. (µV x 106) Abs. Piezometric Pressure (psi) What’s going on here?
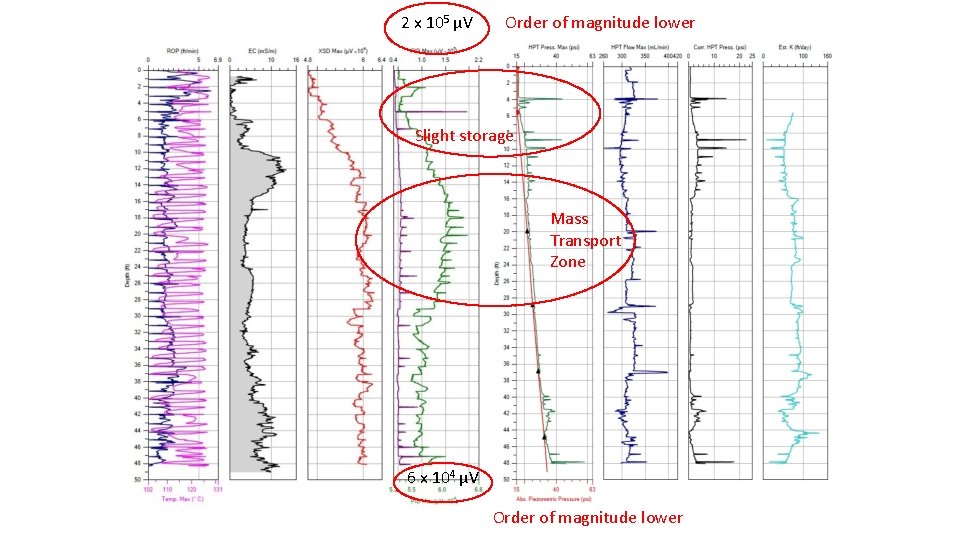
2 x 10⁵ µV Order of magnitude lower Slight storage Mass Transport Zone 6 x 10⁴ µV Order of magnitude lower
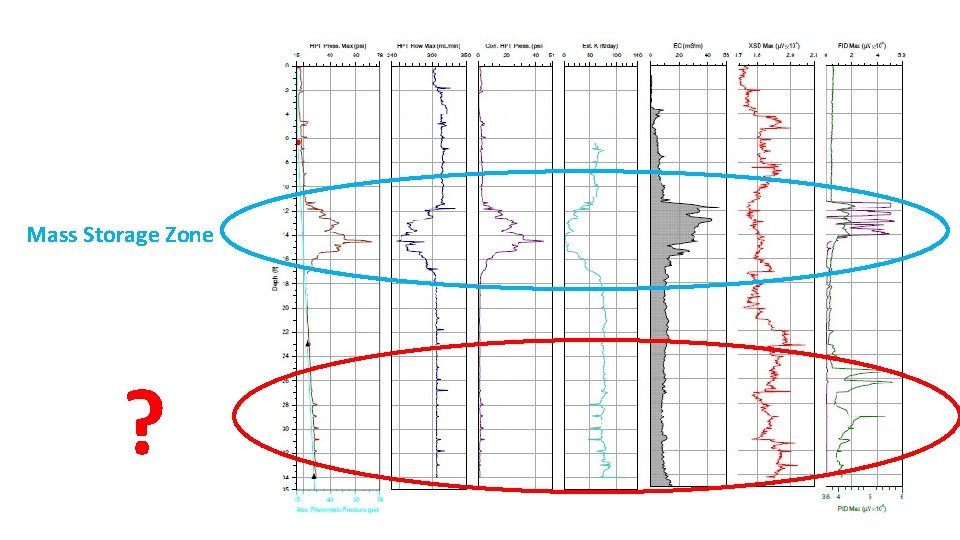
Mass Storage Zone ?
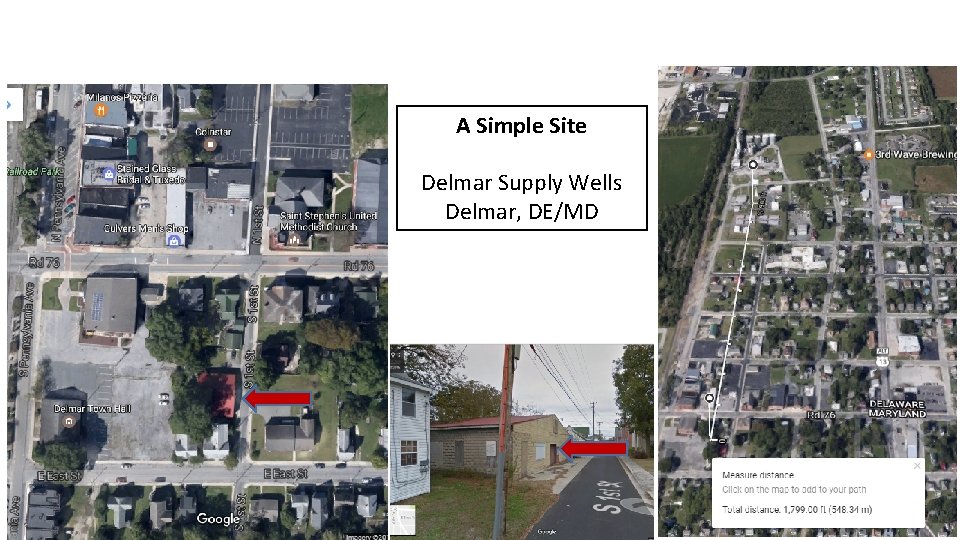
A Simple Site Delmar Supply Wells Delmar, DE/MD
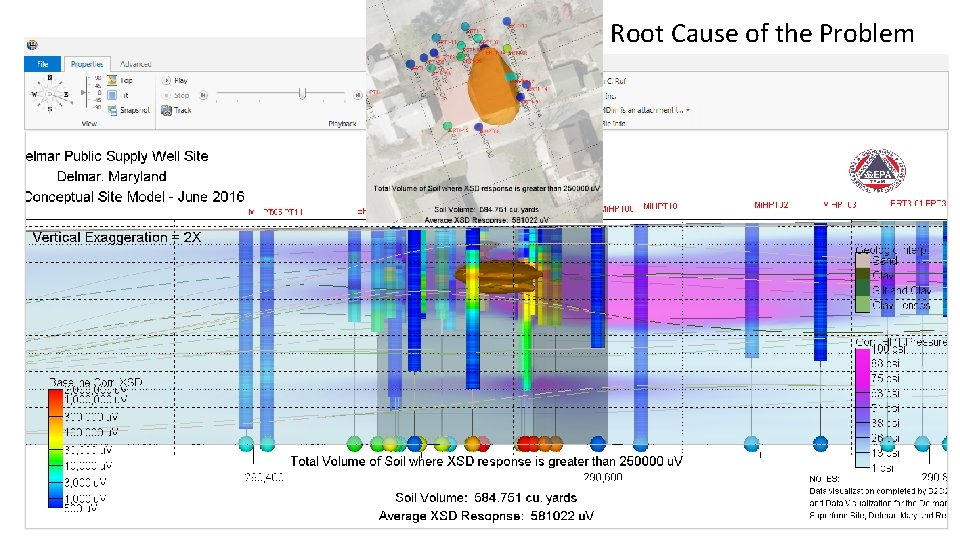
Root Cause of the Problem
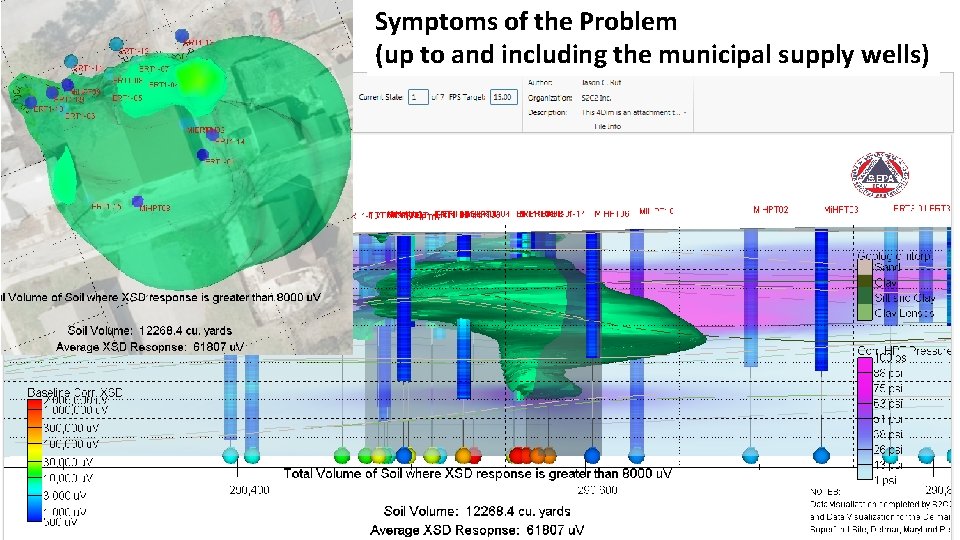
Symptoms of the Problem (up to and including the municipal supply wells)
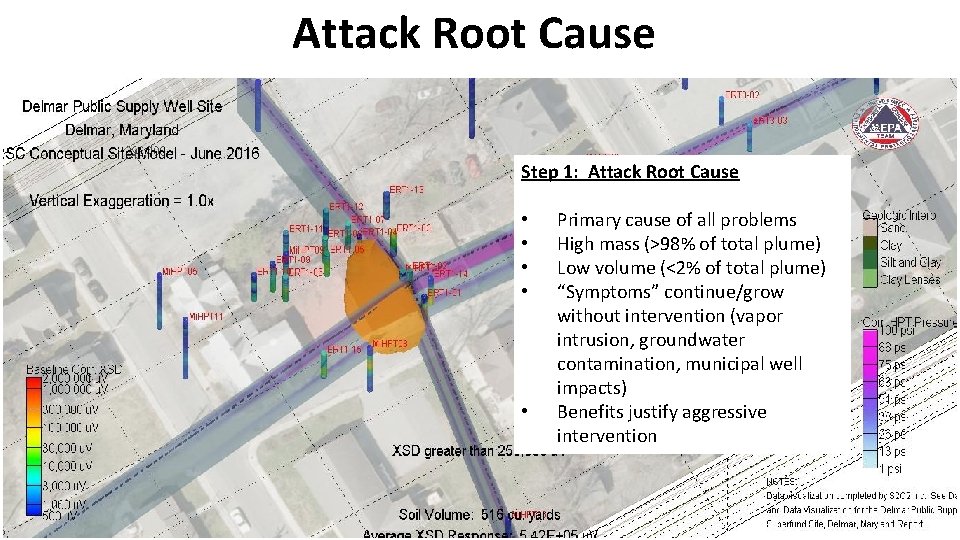
Attack Root Cause Step 1: Attack Root Cause • • • Primary cause of all problems High mass (>98% of total plume) Low volume (<2% of total plume) “Symptoms” continue/grow without intervention (vapor intrusion, groundwater contamination, municipal well impacts) Benefits justify aggressive intervention
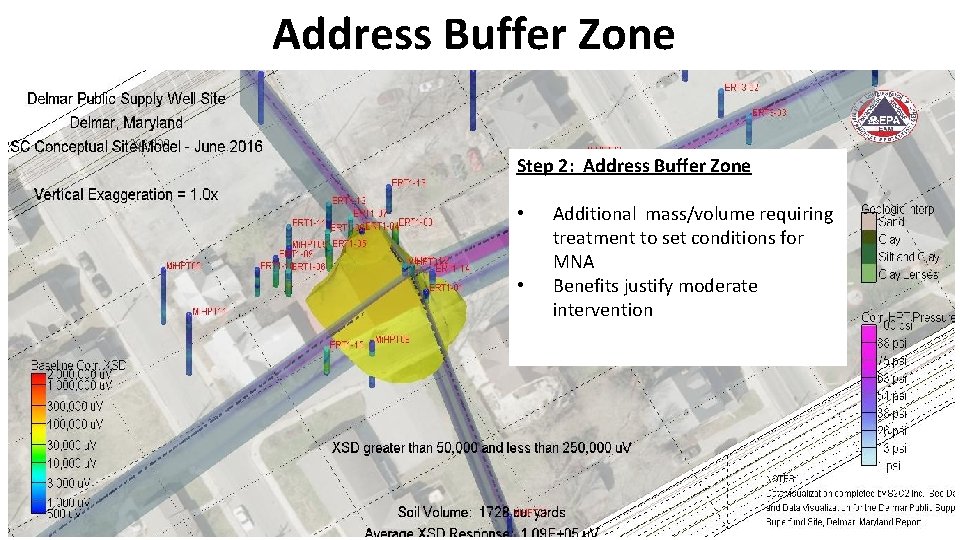
Address Buffer Zone Step 2: Address Buffer Zone • • Additional mass/volume requiring treatment to set conditions for MNA Benefits justify moderate intervention
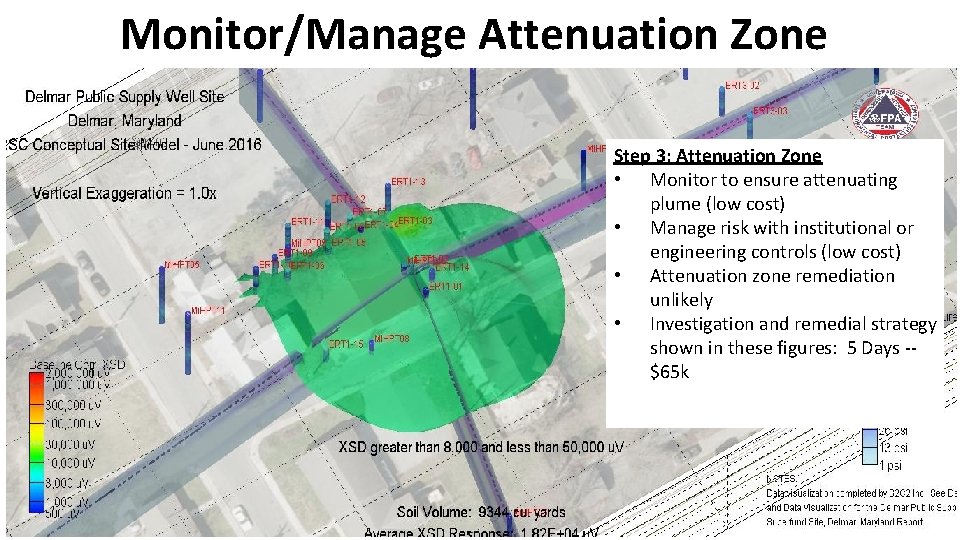
Monitor/Manage Attenuation Zone Step 3: Attenuation Zone • Monitor to ensure attenuating plume (low cost) • Manage risk with institutional or engineering controls (low cost) • Attenuation zone remediation unlikely • Investigation and remedial strategy shown in these figures: 5 Days -$65 k
Conventional Assessment Techniques Necessary? • Quantify and verify direct-sensing information • Fill specific data gaps • Focus on root causes and effective solutions – Water problem in soil? – Soil problem in water? • Optimally placed monitoring wells, soil borings, vapor points, etc.
Rules of Thumb • Production rates • Geo. Probe (MIHPT): 125 -150 feet per day • CPT (LIF, XRF, MIP): 250 -300 feet per day • Typical boring depths • Geo. Probe: 30 -50 feet • Cone Penetrometer: 50 -100 feet • Daily costs: $7500 • 3 -D Visualization -- $5000 to $25, 000 • 2 -D Visualization – Can do it yourself (download Geo. Probe’s DI viewer)
Limitations • Direct Push Technologies • Must be able to push to/through contaminant layer • Typical Detection Limits • • VOCs -- >100 ppb LIF – free product • MIP and LIF are not compound specific • Subsurface utilities must be known! • Need qualified subs (things break!) • Need qualified oversight professionals
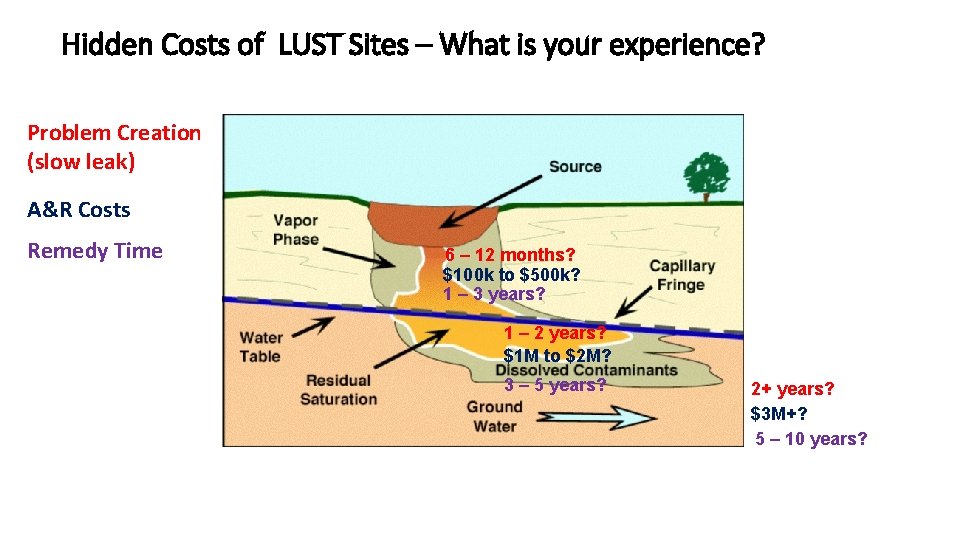
Hidden Costs of LUST Sites – What is your experience? Problem Creation (slow leak) A&R Costs Remedy Time 6 – 12 months? $100 k to $500 k? 1 – 3 years? 1 – 2 years? $1 M to $2 M? 3 – 5 years? 2+ years? $3 M+? 5 – 10 years?
What about HRSC at historic releases? • Source (root cause) often not adequately characterized • Remedy often focused on symptoms • Remedies consequently ineffective and costly • Investigations continue well beyond the remediation zone
Pragmatic Approaches • Begin with the end in mind • Develop conceptual site models via direct sensing techniques (less time / less $) • Attack root cause (mass, not molecules) • Set up conditions for natural attenuation (buffer zone treatment) • Move faster than the conventional regulatory process (collaborative decisions) • Use lab to document solutions, not problems
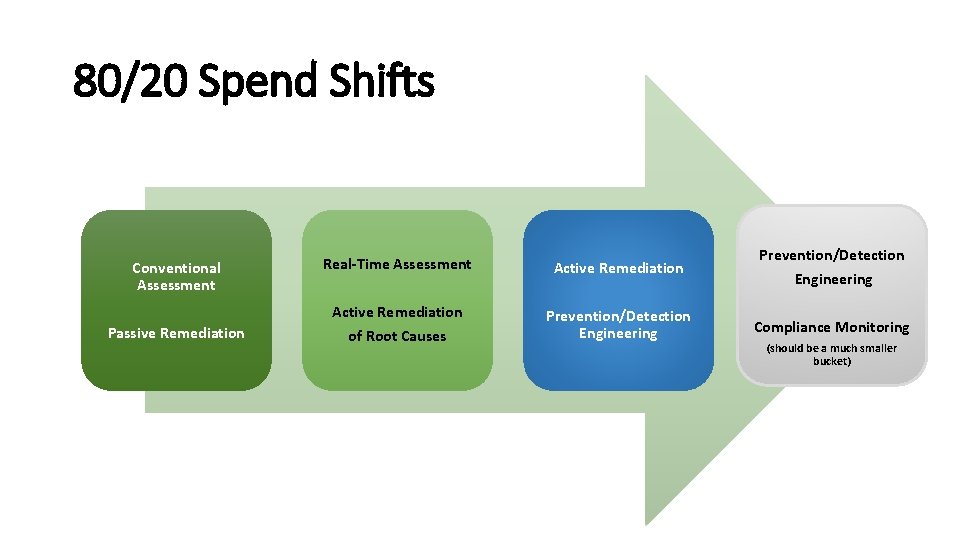
80/20 Spend Shifts Conventional Assessment Passive Remediation Real-Time Assessment Active Remediation Prevention/Detection Engineering Compliance Monitoring of Root Causes (should be a much smaller bucket)
- Slides: 24