Comprehensive Descriptive Method PROGRAM IN OPERATION The comprehensive



- Slides: 197

Comprehensive Descriptive Method • PROGRAM IN OPERATION • The comprehensive descriptive approach consists of having at each of the manufacturing facilities a well trained sensory panel that evaluates daily production samples. • All panels are trained similarly and provide comparable information for any given sample. • Each panel provides information on the intensity/level of the critical sensory variable attributes of the product. 1

• Table 1 shows the results of the evaluation of a production batch of potato chips labeled 825, using this method. • The results shown are the average value of the panel scores for each attribute (e. g. , 7. 5 for hardness) and are interpreted as any other analytical/instrumental information would be. • They indicate the level at which each of the product's attributes is perceived. • These data, provided to QC management, are used to make decisions regarding the disposition of the evaluated production batch. 2

Table. 1. Average panel results for batch 825 of variable potato chips attributes 3

• These decisions are based on the comparison made between the panel results and the specifications set for each of the product attributes. • The column on the right hand side of Table 2 shows the sensory specifications. • The sensory specifications for each variable attribute were added to this table for the purpose of this discussion. • However, it should be clear that those specifications are never included in the panelists' evaluation forms (ballots) and should not be information provided to panelists. 4

Table. 2. Comparison of panel results with sensory specifications 5

• This information is known only by management, to compare the panel results to the product's specifications. • A product is considered unacceptable if it falls outside the specifications ("out of spec"). • For example, Table 2 shows that the production sample 825 would be considered unacceptable or out of specifications. • The intensities of evenness of color (4. 8) and cardboard (5. 0) fall outside the tolerable intensity ranges set (specifications: 6. 0 to 12. 0 for evenness of color and 0. 0 to 1. 5 for cardboard). 6

• The analysis of these data help management in their decision making process. • If an SPC program is being used, the data are plotted on control charts and determination of "in control" production is made. • The trend toward an out of spec cardboard intensity, for example, may have been identified on the control chart before product had to be discarded (see Fig. 1). 7

Fig. 1. Control chart of cardboard flavor intensity of potato chips 8

IMPLEMENTATION OF THE PROGRAM • A company that selects the comprehensive descriptive method for a QC/sensory program has the following objective and has collected the following information in preliminary stages. • 1. Overall objective: To establish a program for evaluating the quality of finished products (and/or complex raw materials) that uses a highly trained panel to measure the perceived intensity/level of selected product attributes. • These results are compared to a set of specifications for each attribute. 9

Ø 2. Preliminary information and special considerations: Ø a. Production samples have consistently exhibited perceivable differences (i. e. , variability) over time. Ø b. The differences have been identified in terms of the sensory attributes and the variability (intensity) ranges of those attributes. Ø c. Products representative of these production variations can be easily obtained in any product survey, or produced otherwise for training purposes. Ø d. The resources to implement this type of program are available at both the production and research facilities. 10

The four steps in implementing this type of program are: • 1. Establish sensory specifications; • 2. Train and operate of the plant panel(s); • 3. Establish a data collection, analysis, and report system; and • 4. Operate the ongoing program. 11

1. Establishment of Sensory Specifications • As shown in Table 2, the sensory specifications for the comprehensive approach are represented by the range of intensities accepted or tolerated for each "critical" attribute—that is, "in spec. “ production falls within the intensity limits set by the sensory specifications. • Conversely, products falling outside the specifications are considered unacceptable. 12

• For example, the sensory specification set for crispness/crunchiness in potato chips (Table 2) indicates that production samples with crispness intensities lower than 10. 0 are to be considered unacceptable or out of specification, with an ensuing rework or rejection decision. • There are two ways by which sensory specifications for the comprehensive program are established. • a. The preferred approach is for the specifications to be set through consumer and management input. • b. Alternatively, specifications can be set based on management's criteria alone. A description of both procedures follows. 13

Specifications Set Through the Input of Consumers and Management • Consumer acceptance is driven by certain, but not all, product characteristics. • These characteristics vary from product type to product type and sometimes from brand to brand. • Companies often lack such consumer data. • More typically, the information available is the opinion of upper management or the brand group as to what factors are critical to a product's acceptance. 14

• This information can deviate from the actual consumer's response to a product. • Product testing with consumers is required to obtain direct information on the attributes that drive a product's acceptance and on the consumers' tolerance to variability of such attributes. • This research involves selecting and testing a series of production samples that represent the extreme and intermediate points of the attributes' ranges. • These data are used to establish more realistic sensory specifications. 15

• A product test for establishing sensory specifications involves the following seven steps • 1. Assessment of needs and planning phase; • 2. Collection and initial screening of a broad array of production samples; • 3. Descriptive evaluation to characterize the samples; • 4. Selection of samples to be tested by consumers; • 5. Planning and execution of consumer research test; • 6. Data analysis to establish the relationship between the consumer and descriptive data sets; and • 7. Establishment of the final specifications based on test results and management's input. 16

Assessment of Needs and Planning Phases for the Consumer Research Study • Resources • The approach presented in this section and requires the following resources: Ø A sensory coordinator responsible for the planning, administration, and completion of all steps; Ø A sensory professional (R&D or consultant) to assist the sensory coordinator in the implementation stage; Ø Professional support from R&D and the plant to provide support in consumer testing, data analysis, and so forth; Ø A descriptive panel; Ø Computer resources; and Ø The funds to plan, administer, and execute the whole project. 17

• Product Amount and Storage • The number and type of sensory tests determine the total amount of product needed. • Although this is important in all sensory test designs, it is critical in a quality control consumer research situation because of the large amount of product handled and the amount of product storage needed until all testing is completed. • The large volume of product is a function of all the tests to be conducted (product inspection for screening, descriptive, and consumer tests) and all the products that are initially collected and surveyed. 18

• Table 3 shows an example of the amount of product needed to establish specifications for the potato chip example. • Part I of the table corresponds to the common calculation usually followed when planning sensory tests. • Part II shows the unique characteristics of the calculation of product needed for quality control purposes. • For a comprehensive descriptive program, all the amount in Part I of Table 3 must be multiplied by the total number of production samples collected. 19

• If 100 to 150 product samples are collected over one to four weeks of production, then the total amount of product to be collected and stored is 100 to 150 times the amount calculated in Part I of Table 3. • For the potato chip example, the total amount of product with 100 production samples is 8, 500 bags of chips. • The large storage space is needed for a short time only. • Once the final sample selection for the consumer tests has been made, up to 70% of all the product can be either placed back in the distribution cycle or disposed. 20

• Test Scheduling • The most important factor to consider when scheduling all tests (e. g. , product screening based on variability, consumer, and descriptive tests) is the shelf life of the product being studied. • When shelf life is not a limitation, all tests can be planned and conducted leisurely. • However, food and beverage products are extreme cases of this category—a careful scheduling of activities is required, due to the product's short shelf life. 21

Table 3. Calculation of product needed for setting specifications of Potato Chips 22

• The schedule has to assure that the products to be tested undergo minimal, if any, changes from the time they are produced or distributed until they are evaluated. • This problem is alleviated in those few cases where pilot plant produced samples are similar to production samples. • Then, pilot plant samples can be specifically produced for the consumer test, without any scheduling problems. • For products with relatively short shelf lives (e. g. , up to six weeks) and no pilot plant substitutes, the scheduling of all evaluation tests is difficult, if not impossible. 23

• In this case, all the product evaluation tests are to be conducted in two phases. • Specifically, the first phase includes only Ø the sample collection, Ø screening, and Ø documentation of variability. Ø The second phase consists of Ø screening samples and Ø the consumer and descriptive tests. 24

Sample Collection and Initial Screening • The type of sample collection needed depends on the history of the QC/sensory program, specifically the amount of surveys completed in the past. • If no survey and identification of variability have been completed, a broad sampling needs to be planned and administered. • On the other hand, if other surveys have been completed, the sampling needed is less involved and is geared to find the samples that span the entire range of production variability. 25

• Complete Survey • The following survey is scheduled for the potato chip example. Product is collected from: • Three manufacturing sites; • Nine production days; • Two shifts; and • Two pickups within a shift. • This survey leads to a total of 108 production samples (pickups) to be screened. 26

• Through the screening process, a subset of these 108 samples is selected for further testing. • Samples that do not show extreme variability are eliminated. • Samples that show variability from what is known be "typical, " or from the control, or from the majority of the production samples being evaluated are chosen. • In general, no more than 50% of the total number of products is selected through this initial screening. • For the potato chip example, a total of 25 products are selected. 27

• Smaller Scale Survey • In those cases where the product variability has been identified through previous surveys, a smaller scale survey is completed. • The objective of this survey is to collect enough samples that display the variability of all sensory characteristics. • In the small scale survey, fewer pickups are needed. • For example, instead of 108 pickups for the potato chip project, only 60 or 80 pickups are necessary. 28

• In addition, based on previous information, additional pickups from specific plants or shifts can be included, if they are known to show large variability in previous surveys. • As in the complete survey, 25 products that represent the extremes and span the entire range of production variability are selected for the potato chip example. 29

Descriptive Analysis • The descriptive analysis is completed to obtain a detailed characterization of the selected subset of products. This information shows each sensory characteristic of the product and the intensity/level at which it is perceived. The descriptive information is used for three purposes: 1. The selection of the final set of products to be consumer tested; 2. The establishment of specifications; and 3. The selection of replacement product references in later stages of the program operation. 30

• The descriptive information is obtained from a trained panel. • This test can be completed through the R&D sensory panel, if there is one in the company. Otherwise, a contract research panel can conduct these evaluations. • An experienced sensory professional designs and administers the descriptive test. • Consideration should be given to the experimental design, sample preparation and evaluation procedures, and test controls. 31

• A complete characterization of each sample includes the evaluation of a total of 20 to 40 attributes per sample. • Table 4 shows the list of all attributes evaluated for potato chips and the results for one of the batches evaluated. • (The scale is a 0 15 intensity scale where 0 = none and 15 = extreme). • Upon completing this test, a similar descriptive characterization is obtained for each of the 25 potato chip samples screened. • With this test, more precise information on the product variability is obtained. 32

Table 4. Descriptive characterization of potato chip sample 613 33

• Table 5 shows the summary statistics and its variability ranges for each attribute obtained through the evaluation of 25 samples. • An inspection of these results gives an indication of which attributes present small, medium, and large variability. • For example, some of the attributes showing the largest variability are evenness of color, evenness of size and shape, saltiness, and crispness. • The descriptive characterization is used for the final sample selection described below and for the data analysis set for setting specifications, described later on. 34

• The same procedures and principles that document production variability, as described for the potato chip example, would apply to this or other food and nonfood consumer product. • For example, Figure 2 shows the production variability ranges. • The line scales are 15 cm scales, where the distance between the left end marked "0" and the first slash mark on the line represents the lower range intensity value. • For this product, the attributes that show high variability (e. g. , opacity, spread) can be identified from these results. 35

Fig. 2. Production variability of sensory attributes of nail enamels 36

Sample Selection • Starting with a collection of samples that span the range of typical product variability, it may not be clear as to which attributes best summarize the variability, nor which subset of samples most economically span the variability in all of its meaningful dimensions. • It turns out that the two issues are intrinsically linked. • Identifying attributes that exhibit meaningful variability and selecting representative samples occurs simultaneously. • There is no fixed analytical procedure to accomplish the task of identifying variable attributes and representative samples. 37

Table 5. Sensory statistics of the sensory attributes of 25 samples of potato chips 38

• The approach is instead an exploratory process in which samples possessing unique combinations of attribute ratings are identified while simultaneously tracking the varying and co varying of the attribute ratings themselves. • Sophisticated data analysis procedures are available to apply to the problem. • However, only the minimum level of computational complexity necessary to accomplish the task should be used. • Blind reliance on sophisticated techniques can yield misleading results. • Simple graphical techniques play a central role in the approach and may be all that are required. 39

• The basic data analysis tools used for sample selection are Ø data plots (histograms, scatterplots, etc. ), Ø summary statistics (means, standard deviations, correlation, etc. ), and, if necessary, Ø principal components analysis. • The approach is illustrated using the descriptive data on the 25 samples of potato chips that have been evaluated on 36 attributes by a trained descriptive panel (see Table 5). • What follows is a step by step sequence of analyses used to identify variable attributes and to select representative samples for further study. 40

• STEP 1: Screen the Attributes for Overall Variability • The analysis begins by determining which attributes exhibit meaningfully large variability. • The range of responses that occurs in each attribute is obtained by examining the summary statistics for the samples, such as in Table 5. • Attributes that exhibit trivially small amounts of variability should be dropped from further analyses. • What constitutes "trivially small" must be decided on a case by case basis. • This is especially true for off notes, which are likely to have substantial effects on acceptability when present at even very low levels. 41

• In the example, a total range of values of 0. 5 units or less has been deemed to be too small to be worried about. • Of the original 36 attributes, 18 show little or no variability. • The attributes remaining after the initial screen are presented in Figure 3. • The absence of statistically significant differences among the samples should not be used to decide what constitutes a trivially small range of responses. 42

Fig. 3. Production variability of sensory attributes of potato chips 43

• Failure to find significant differences does not mean that the samples are the same. • Rather large differences (e. g. , 1 or 2 units on a 15 unit scale) may fail to be declared significant for a variety of reasons, including small panel size or confusion about the attribute scale. • Familiarity with the product category and good sensory judgment should be used with the statistical results to make this decision. 44

• STEP 2: Screen the Samples for Extreme Ratings. • Using only the attributes that remain after step 1, attention now focuses on the samples. • Histograms of the attribute ratings, such as those in Figure 4, are used to identify samples at the extremes of the distributions. • The graphical approach will also reveal more about the general distribution of the ratings than is obtained from the summary statistics tabulated in step 1. • For example, Figure 4 a shows a regular, bell shaped distribution of ratings for even shape. • No sample stands out as odd in the plot. • Similarly, in Figure 4 b, no sample is outstanding for even size. 45

Fig. 4. Histograms of the distribution of the intensity rating of 25 samples of potato chips for selected attributes 46

• However, the even size histogram reveals a uniform (i. e. , flat) distribution of ratings. • Even though even shape has a slightly larger range of variability (see Table 5), sample to sample variability in even size is more apparent because of the greater likelihood that an individual sample will fall at the extremes of the range. • Figures 4 c and 4 d illustrate two important situations involving "extreme" samples. • In Figure 4 c, sample 4 has a very high saltiness rating and sample 7 has a very low saltiness rating, relative to the rest of the samples. 47

• The remaining samples exhibit a regular pattern, similar to Figure 4 a. • Figure 4 d shows another important case, where, for the attribute painty, sample 12 exhibits a moderate response (3. 8), while the remaining samples in the group all have ratings of 0. • The tabular summary of the data done in step 1 indicates a meaningfully large range of values for painty, but all of the apparent variability is due to a single sample. • Based on Figures 4 c and 4 d, samples 4, 7, and 12 will be included in the consumer test, to determine the effects of their extreme behavior. 48

• Results of parametric analyses, such as correlations and principal components, must be interpreted in light of any peculiar patterns that are known to exist. • Further, the information can be used directly in the final selection of samples for the consumer test. • Examining the histograms of the remaining attributes reveals that raw potato flavor and cardboard exhibit the same behavior as painty, with all but one of the samples (either 4, 7, or 12) having the same, or nearly the same ratings. • Since samples 4, 7, and 12 are already selected for consumer testing, and there is no additional meaningful variability in these three attributes, they can be eliminated from further consideration in the sample selection process. 49

• STEP 3: Identify Samples that Depart from Interrelationships Among the Attributes • Eliminating extreme samples and non varying attributes from the analysis permits a more sensitive study of the interrelationships among the remaining attributes. • Such an analysis is important because samples that do not fall at the extremes of any attribute ratings may still be unique in the sense that they fail to follow the pattern exhibited by the majority of the samples when two or more attributes are considered simultaneously. • Such samples may be perceived as having an "unbalanced" or "unblended" flavor and, as a result, be less acceptable to consumers. 50

• Scatter plots are good starting points for identifying relationships among the attributes and for singling out unique samples. • Samples that do not follow the systematic pattern of the remaining samples should be set aside for further study. • The 153 scatter plots of the possible pairs of 18 attributes in the potato chip example are too numerous to present here, but that number of plots can be reviewed in a matter of minutes, to reveal the strength and nature of the pair wise relationships among the attributes and to determine if any samples depart substantially from the general trends. • In the example, samples 3 and 20 departed from otherwise linear relationships between saltiness and potato complex (see Fig. 5). • Samples 3 and 20 are selected for consumer testing because of their unique behavior. 51

Fig. 5. Scatterplots of the attribute ratings of 20 potato chip samples for saltiness vs. potato complex intensity where 18 of 20 samples exhibit a strong linear trend between the two attributes 52

• To summarize, after the first three steps of the example selection analysis: • 1. Samples 4, 7, and 12 have been selected for consumer testing, based on extreme ratings in certain attributes. • 2. Samples 3 and 20 have been selected for consumer testing because of unique patterns in their saltiness versus potato complex ratings. • 3. Raw potato flavor, cardboard, and painty have been dropped from the list of 18 attributes that remained after step 1 (see Fig. 3), due to the lack of a variability that exists after one or more of the extreme samples (4, 7, and 12) were excluded. 53

• STEP 4: Select Final Set of Samples for Consumer Testing • In situations where only a small number of attributes are being considered, it is possible to make the final selection of samples for consumer testing directly from plots and tables of the descriptive attribute ratings. • Samples should be selected to represent the low, middle, and high ranges of variability in each attribute. • When the number of attributes is too large for direct selection of samples, principal components analysis (PCA) can be applied, to reduce the number of dimensions of product variability that need to be considered. 54

• PCA applied to the 15 attributes that remain in the analysis after steps 1, 2, and 3 reveals that only two principal components (PCs) are required to explain 88 percent of the variability in the 20 remaining samples. • The leveling out of the screen plot in Figure 6 shows that no significant gain in explained variability occurs by including additional components. • The PC loadings of each attribute, in Table 10, are interpreted in the same way as correlation coefficients. • The loadings can be studied to reveal the groupings of the attributes within each PC. 55

Table 6. Principal component loadings of 15 sensory attributes for 20 samples of potato chips 56

Fig. 6. A screen plot from the PCA based on the descriptive attribute data from the potato chip example 57

• More important to our current purpose, the PC scores are computed for each sample using, for example, PROC SCORE (SAS 1989). • The two PC scores per sample are much easier to examine than the original 15 attributes. • Samples representing the low, middle, and high ranges of product variability can then be selected from this smaller number of dimensions. • The samples tentatively selected for consumer testing are indicated in the plot of the two PC scores in Figure 7. 58

Fig. 7. A scatterplot of the principal component scores of 20 samples of potato chips. The highlighted samples were selected for consumer testing 59

• The last step before finalizing the sample selections is to examine the distribution of the tentatively selected set, along with those extreme and unique samples identified in steps 2 and 3, earlier, on their original attribute scales. • Establish that the range of variability in each attribute is adequately spanned by the selected samples. • If necessary, drop or add samples to achieve a uniform coverage of the observed ranges. • For instance, in the example, none of the samples selected thus far had an extremely high rating in even color. 60

• Therefore, sample 8 is added to the set of selected samples for no other reason than because sample 8 had the highest rating in even color. • Step 4 results in the selection of samples 1, 6, 8, 10, 15, 17, 19, 22, 23, and 25 for consumer testing. • Add to these the extreme samples 4, 7, and 12 and the unique samples 3 and 20, to form the complete set of 15 samples to be evaluated by consumers. 61

• Planning and Execution of the Consumer Research Study • The consumer responses to the product's variability are collected by conducting a consumer research study. • The methodology and the protocols followed in this study should be designed by an experienced sensory professional. • This support is usually provided by the R&D sensory or product evaluation department. • Alternatively, an outside consulting group can be used. • With this support, the test design will include sound sensory procedures for the collection of valid and reliable consumer information. 62

• Planning, administering, and executing consumer tests for QC purposes requires the involvement and assistance of many departments within a company. • Among them are Operations/Manufacturing, Quality Control, Product Development, and Marketing/Market Research. • The most important issues to consider when designing the consumer study are Ø test location(s), Ø consumer recruitment, Ø test design, Ø consumer questionnaire design, Ø test execution, and Ø validation. 63

• Test Location(s) • The team of professionals working on the QC/sensory project needs to decide on the location or locations of the consumer test. • The product's distribution areas and the company philosophy on regional versus national consistency play a role in this decision. • Only one test location is needed when both the production and the product distribution areas are confined to one region. • Several regions must be tested when there are manufacturing facilities in various locations, and the regional products differ due to either formula and/or processing differences. 64

• The results from multiple locations can be used differently. • Companies may treat data and programs regionally (establishing different specifications and QC/sensory programs in each region), or companies may try to standardize regional production differences prior to establishing specifications and the QC/sensory program. 65

• Consumer Recruitment • Medium or heavy users of the product should be selected. • Interaction with the company's Market Research department is required at the planning phase, to select the screening criteria needed for the study. • Experimental and Test Design • The consumer research needed in a QC/sensory project involves the evaluation of many samples. • The sample selection process described above is geared toward reducing the total number of samples. 66

• However, a considerably large number of products is still tested. For example, for the potato chip example, a total of 15 products is to be consumer tested. • The sensory professional in charge of the study selects the most appropriate design, based on the characteristics of the products and the total number of samples to be evaluated. • Unless the products require an in home placement, a central location test (CLT) design is recommended. • A CLT provides a better setup for evaluating a large number of samples. • Situations that require an in home placement are more expensive and time consuming than CLTs and, in some instances, may require that a less than optimal test design be used, in order to complete the study. 67

• In selecting the most appropriate experimental design, the researcher has to decide on the use of a complete versus an incomplete block design. • Typically, because of the large number of samples involved, an incomplete block design is used. • In an incomplete block design, each respondent evaluates only a small number of the test samples. • In a complete block design, each respondent evaluates all of the test samples. • Choosing a complete block design involves either long evaluation sessions (e. g. , two four hour sessions) and/or multiple sessions conducted over several days, to be able to test all samples. • These designs have advantages and disadvantages that should be considered when planning the study. 68

• In the potato chip example, 15 samples were selected for consumer testing. • To avoid respondent sensory fatigue and boredom, an incomplete block design was selected. • In this design, each consumer evaluates only 3 of the 15 samples. • Table 7 shows the characteristics of the design, including the total number of consumers needed to obtain the desired minimum of 70 replicate evaluations per sample. 69

Table. 7. Balanced incomplete block design used for consumer study of potato chips- 15 samples evaluated in groups of 3 70

• Consumer Questionnaire Design • The consumer questionnaire used in this study is designed to assure the collection of the type of data needed to relate the consumer information to the descriptive panel (intensity) data. • Figure 15 shows an example of the type of questionnaire used in the potato chip study. • Other versions of this questionnaire could be used. • The questionnaire designed for this study should have two parts: Ø acceptance and Ø attribute questions. 71

Fig. 8. Questionnaire used for consumer research study of potato chips 72

73

• Figure 8 shows that, for the potato chip example, overall acceptance, appearance, flavor, and texture acceptance, and acceptance of specific attributes (potato flavor, crispness) are included. • In addition, intensity questions for the same attributes are asked (e. g. , potato flavor intensity, freshness intensity). • Other tests, such as descriptive and consumer qualitative tests (e. g. , focus groups), are very useful when designing consumer questionnaires. • The descriptive information is used to select the attributes to be included in the questionnaire. • These attributes are those found to be the most variable in the product. 74

• For example, the potato chip questionnaire includes the attributes color, evenness of color, potato flavor, saltiness, firmness, and crispness, because those are the most variable characteristics (Fig. 3). • Focus groups, a qualitative consumer test, are useful in selecting the appropriate consumer terms to be included on the questionnaire. • For example, "freshness" was selected with the information obtained in groups conducted for the potato chip project. • Consumer responses to samples with a "cardboard" note (descriptive term) were "not fresh, " "stale, " and "old. " • The consumer term "freshness" was included, to capture the consumer responses to samples with a cardboard note. 75

• Test Execution and Validation • The sensory professional oversees the execution of the test, to ensure adherence to the test protocols and controls. • As in other consumer tests, the actual execution of the test is a straightforward process, provided that the study has been carefully designed. • It is recommended that a validation of completed consumer responses be done. • This practice involves contacting a subset of respondents by telephone, to confirm their participation in the test. 76

Data Analysis/Data Relationships • The relationship between the consumer responses and the descriptive panel intensity data are examined, to aid in establishing the QC specifications for each sensory attribute. • The statistical methods applied to determine the nature of the relationships should be kept as simple as possible. Graphical methods may be all that are required. • While the relationship of the descriptive attributes to overall acceptability is most important, it is always informative to examine the relationship between the descriptive attributes and the acceptability ratings for specific attributes. 77

• In addition, an analysis of the relationship between the descriptive attributes and the consumers' intensity ratings of various product characteristics can be used to gain a clearer understanding of consumers' responses, their use of vocabulary, and so forth. • The first step in the analysis is to plot the overall acceptability and attribute acceptability responses versus the descriptive attribute ratings. • A correlation analysis, run simultaneously, provides useful supporting information. • Some descriptive attributes that fail to exhibit systematic relationships with overall acceptance may have a strong relationship with one or more of the attribute acceptance responses. 78

• The attribute acceptance relationships should not be ignored in setting QC specification for sensory responses. • The plots should be examined first to identify the attributes that exhibit no systematic relationship with either overall acceptance or any of the attribute acceptance responses (that is, plots that exhibit a completely random pattern, accompanied by a correlation coefficient near zero). • The samples sent to the consumer test were selected to span the typical range of product variability; any attribute exhibiting a random pattern has no meaningful impact on acceptability (see Fig. 9 a). 79

• Next, interest should focus on those attributes that exhibit strong linear trends, either positive or negative, in overall and/or attribute acceptability versus descriptive ratings. • These trends are readily apparent in plots and are accompanied by large (positive or negative) correlation coefficients. • A simple linear regression of the form • Acceptance = b 0 + b 1 (Attr) • where (Attr) is the descriptive attribute rating, can be used to obtain predictive equations that relate the value of a descriptive attribute to the consumer acceptability rating (see Fig. 9 b). (In practice, an eyeball fit may be sufficient. ) 80

• Lastly, the plots of the descriptive ratings that exhibit curvilinear relationships with acceptability (both overall and for attributes) should be examined. • For well behaved data an eyeball fit may be sufficient to develop a predictive relationship between the descriptive and acceptability responses, but, typically, a quadratic regression equation of the form • Acceptance = b 0 + b 1 (Attr) + b 2 (Attr)2 • is used (that is, both the descriptive rating and the squared value of the descriptive rating are used to predict the acceptability value (see Fig. 9 c)). 81

• The 18 descriptive attributes in the potato chip example are plotted versus the overall acceptability and the various attribute acceptability responses, using the 15 samples that were evaluated by both the descriptive panel and consumers. • The following relationships are obtained: • 1. Translucency, even shape, folds, potato complex, raw potato flavor, burn, oily surface and toothpack exhibit no systematic relationship with any of the consumer acceptability responses neither overall nor any of the attributes (i. e. , all plots resemble Fig. 9 a). • 2. Even size, fried potato flavor, and crisp/crunch exhibited positive linear relationships with overall acceptance. 82

• Cardboard and painty exhibit negative linear relationships with overall acceptance (as in Figure 9 b). • Denseness exhibits no systematic relationship with overall acceptance, but has a negative linear relationship with the consumer's airiness acceptability response (i. e. , as in Figure 10). • 3. Color intensity, even color, and saltiness do not exhibit a systematic pattern with overall acceptability. • However, color intensity and even color exhibit a curvilinear relationship with the consumer's color acceptability response resembling the pattern presented in Fig. 9 c. 83

Fig. 9. Scatterplots of common relationships between acceptance responses and descriptive attribute ratings 84

Fig. 10. Scatterplots of overall acceptance versus denseness intensity and airness acceptance versus denseness intensity for the 15 potato chips samples 85

• In addition saltiness exhibits a similar curvilinear relationship with the consumers’ saltiness acceptability response. • Only hardness exhibits a curvilinear relationship with overall acceptability. • In order for the relationships revealed in the analysis just discussed to be used to set QC specifications, management must select minimum product performance criteria for the overall acceptability response and, • if necessary, for each of the attribute acceptability responses considered. 86

• No meaningful specifications can be set without this information because the descriptive attributes by themselves do not directly reflect acceptability. • This issue is discussed in detail in the next section. In preparing for a management review meeting, the relationships between the descriptive and acceptability responses should be summarized using plots similar to those presented in Figure 9. • Only those plots that clarify the relationship between the descriptive and consumer data should be presented. 87

Establishment of Final Specifications • A management meeting is scheduled to review the findings of the data analysis. • It is important that upper management and all managers from each company's function (e. g. , R&D, operations, QC/QA) attend. • The purpose of the meeting is to establish the final sensory specifications for each attribute, by assessing the changes in the hedonic consumer's response to the product variability. The results are presented in two groups: • Those variable attributes which did not show an effect on consumer acceptance (Fig. 9 a); and 88

• Those variable attributes which did show an effect on consumer acceptance (Fig. 9 b and 9 c). • The discussion and the decisions made are completed by examining one attribute at a time. For each attribute, the following is reviewed: • The definition; • The demonstration of the variability by actual production samples (the lowest, the highest, and one or two intermediate intensities are shown); and • The plots displaying the data relationships between consumer responses and panel attribute results. 89

• Attributes showing a relationship depicted in Figure 9 a (e. g. , translucency, folds) did not show an effect on consumer acceptance. • For those attributes, no specification needs to be set, since consumer's acceptance is not affected by its variability. • Therefore, these are attributes that need not be measured by the panel. • Despite this, some companies may decide to have the panel measure one or two attributes from this category. • This is done either for documentation purposes or for tracking attributes that are of particular interest to the company. 90

• Attributes with relationships as those shown in Figure 9 b (e. g. , crispness) and Figure 9 c (e. g. , saltiness) affected consumer acceptance and are used to set specifications. • The final specifications represent the limits of the variability range tolerated for each attribute, expressed in terms of descriptive intensities. • In order to set the QC specifications on the attribute ratings, minimum product performance criteria must be established for the overall acceptability response and each of the critical attribute acceptability responses. • No meaningful specifications can be set without this information because the descriptive attributes by themselves do not directly reflect acceptability. 91

• Management of the potato chip company has established an overall acceptability of 6. 5 (on a liking scale from 1 9) to be the minimum product performance criterion. This cutoff point is used to set specifications. • Figure 11 illustrates this process. With a cutoff point of 6. 5 in overall acceptance, the specification set is 5. 8 10. 0. • Products with an attribute intensity lower than 5. 8 or higher than 10. 0 yield a consumer acceptance score lower than the minimum established (6. 5) and are therefore to be considered unacceptable (out of specification). 92

• Other factors beside the consumer input are taken into consideration when setting specifications, such as Ø production limitations, Ø costs, and Ø management quality expectations. • This means that very rarely are the specifications set based on the straightforward inspection of the relationships, as discussed earlier. • In reality, the final specifications might be set with either a narrower or a wider intensity range than that determined by the acceptance cutoff point. 93

• Narrower ranges are set by companies that want stricter criteria than the consumers themselves. • Wider ranges than those called for by consumers may be set by companies for which the cost to maintain the narrower specifications is too high, compared to the benefits gained. • For example, very few companies would incur the high cost of upgrading all their processing equipment, to make sure that 100 percent of the production falls within a tight specification range. These concepts are also illustrated in Figure 18. 94

• The manufacturer of potato chips set a consumer acceptance cutoff point of 6. 5 or higher. • Based on this criterion, the specification for the attribute displayed in Figure 18 was set at 5. 8 to 10. 0. • However, it is impossible to have more than 80% of their production fall within the range determined and achieve the cutoff point of 6. 5 in acceptance with the current processing conditions. • In that case, instead of setting the specifications for that attribute as 5. 8 to 10. 0, it is set at 5. 0 to 11. 0 (Fig. 11). • Table 8 shows the final specifications set for the attributes measured for potato chips. 95

Table 8. Final sensory specifications for potato chips 96

Fig. 11. Establishment of specifications based on consumer responses or management input 97

Specifications Set Based on Management Criteria Only • The involved process required in collecting consumer responses to the product's variability forces some companies to choose the more simple method for setting specifications. • Although the authors prefer the more sound procedure (using consumer input) and consider that to be the more appropriate process of the two, a brief review of the alternative is discussed. • When specifications are set based on management's criteria only, the completion of a product survey and the summary of the results are needed. 98

• This means completing only two or three of the seven steps otherwise required when a consumer research study is undertaken. • The specifications without the consumer input are also set in a management meeting. In this meeting, the following aspects are presented: • The results of the product survey completed for the identification of variability; • A subset of production samples that demonstrate the range of the most variable attributes. 99

• The results of the product survey can be summarized as in Table 5 and Figure 3. This figure shows the type of variability determined by the survey. • Attention is focused on the attributes with the largest variability (asterisks in Fig. 12) and on off notes (or other attributes where the variability range might be small but important). • The subset of production samples shown to management are the products that represent the extremes of the variable attributes and some intermediate points. 100

• The 3 to 4 samples shown to management for each variable attribute are marked with circles in Figure 12. • The inspection of samples is essential in this decision making process, since management has to understand both product attributes and their intensities. • The sensory specification for each variable attribute is set by management, after the inspection of the samples shown to demonstrate each variable attribute. 101

Fig. 12. Production variability of potato chips used for setting specifications through management criteria 102

• Based on their criteria only, management decides how wide or narrow each specification (tolerable variability range) should be. • For example, in setting specifications for cardboard and denseness, management reviewed the corresponding samples (Fig. 12) and set the following specifications: Ø Attribute Range of Variability Observed Specification Ø Cardboard 0 5. 0 0. 0 3. 5 Ø Denseness 6. 0 10. 0 6. 0 10. 0 • These specifications are used in the program as described later on. 103

Training and Operation of Plant Panel(s) • A well trained panel needs to be established at the plant(s) where the sensory characteristics of daily production will be measured and controlled. • The panel can be formed either with the participation of company employees or of local residents. • There advantages and disadvantages in these two approaches. • The advantages of having local residents as panelists include the unrestricted time availability for panel sessions, the reliability of panel attendance, and the reduced overhead costs; 104

• disadvantages include the additional time required to train nontechnical personnel or people with little or no experience • with the company's products, and the problems involved in handling legal and/or confidential issues when using nonemployees. • The advantages of having company employees as panelists include their proximity to the evaluation location and the use of their technical expertise and/or product experience in the program. • However, the main advantage in using employees in the QC/sensory program is that the product quality message is disseminated throughout the plant. 105

• The disadvantages of using employees on the panel include the Ø logistical problems of adjusting production schedules to allow for the release of line workers, Ø the lack of motivation and support encountered in the long run by plant supervisors, and Ø the resulting lower motivation from the panelists themselves. 106

• Training Steps • The panel is established through three phases: prescreening, and training. • The description of these three phases given below corresponds to the process followed in the establishment of a Spectrum panel. • A. Prescreening • In the prescreening stage, potential panelists are contacted via a prescreening questionnaire to determine their interest and availability for participation. 107

• If employees are being screened, an indication of management support and interest in the program (e. g. , a letter from the plant manager) is helpful in obtaining cooperation at this stage. • Optimally 100 to 120 people are initially contacted at the prescreening phase, in order to select 50 to 60 people for the screening phase. • However, for small manufacturing facilities, the number of panelists initially screened may be lower. 108

• In order to be selected for this phase, potential panelists must meet the following criteria: Ø no allergies, Ø availability, Ø limited traveling, Ø interest, Ø ability to describe simple sensory characteristics, and Ø the ability to use a scaling system. • B. Screening • Participants who are potential candidates, as indicated by the prescreening results, are scheduled to participate in a series of acuity tests and an interview (50 to 60 people). 109

• The standard tests and procedures used to screen QC/sensory panelists are modifications of the procedures used to develop an R&D descriptive panel. • These modifications include Ø 1) the use of a smaller set of samples/products for the descriptive tests (e. g. , odorants to describe aromatics) and Ø 2) the use of actual production samples that show product differences in the detection tests. • The purpose of these tests is to select the panelists who Ø have normal acuity, 110

Ø are able to detect differences in production samples, and Ø show some ability to describe sensory characteristics and to learn a scaling system. • C. Training • Optimally, a total of 20 to 30 participants are selected to participate in the training program. • This large pool is recommended to assure a sufficient number of panelists per evaluation (e. g. , 10 panelists). 111

• Plants that operate multiple shifts may conduct at least two training sessions to include the personnel from all shifts. • A smaller number of panelists is selected in small plants, due to fewer staff members working at the production facility. • In that case, a more involved training program is required to obtain a low within panel variability, which is achieved through additional training and practice time. • Depending on the product category and the number of attributes, the training program requires two to five 6 hour training sessions, for a total of 12 to 30 hours. Additional sessions are scheduled thereafter for practice. 112

• Prior to the initiation of the training program, a plant sensory coordinator must be identified. • The plant sensory coordinator gets involved in all the steps of the training, practice sessions, and panel maintenance. • This participation and his or her interaction with the R&D sensory professional or consultant are required to assure the coordinator's independent work in later stages of the program. 113

• During training, it is important that the sensory coordinator participates as a panelist trainee, not as a technician. • The coordinator needs to have at least the same panelist skills as the panel itself, so the sensory coordinator can Ø monitor the panel performance, Ø understand panelists' and product problems, Ø maintain the panel, and Ø operate the program. 114

• The most important component of the training is the product training phase, where the panel learns to evaluate the variable product characteristics for which sensory specifications were set. • For the potato chip example, the plant panel is to be trained to evaluate the following characteristics, which were found to have an impact on consumer acceptance: • Color intensity • Panty • Evenness of color • Salty • Evenness of size • Hardness • Fried potato • Crispness/crunchiness • Cardboard • Denseness • The details of the training program will follow. 115

Sample Selection for Training • For products with a short shelf life, a second survey is conducted to obtain the training samples. • Samples selected in previous surveys and used to complete prior tests may have changed by the time the training is scheduled. • At this point of the program, enough information and product experience has been gained to be able to conduct a smaller yet effective survey. 116

• Knowing the attributes and attribute intensities that need to be represented by products, the survey becomes simpler. • The process then consists of finding the production samples that represent the various attributes and intensities needed for training. • For products with a long shelf life, the samples needed for training may be available from previous surveys, if enough product has been stored. • Optimally, at least three intensity references per attribute are selected and shown to panelists during training. 117

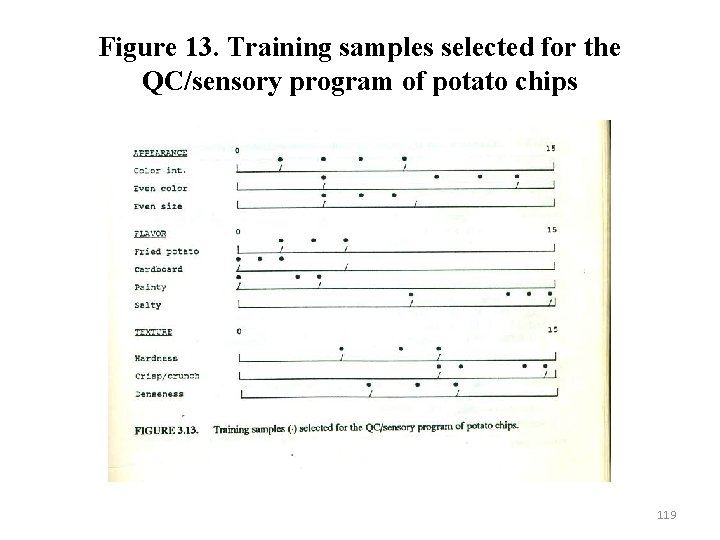
• Figure 13 shows the training samples identified for the potato chip program marked with circles. • The most important samples for training purposes are those that display the highest and lowest attribute intensities. • It should be noted that certain extreme intensities (low or high) found in previous surveys and even tested in the consumer study might not be found in the survey that is completed prior to the training. • Figure 13 shows this for evenness of size and cardboard. • This might pose some difficulties in the panel training. 118

Figure 13. Training samples selected for the QC/sensory program of potato chips 119

• The panel could accurately rate higher or lower intensities than those demonstrated in the training, because of the use of both internal references and external references. • However, it is recom mended that further production sample screening be done to find those products for the panel, even shortly after the panel has been trained. • Alternatively, accelerated shelf life or other product stress procedures or R&D created samples might be considered to provide those products needed for training. • This might be required to obtain the high intensity of cardboard (5. 0) found in previous surveys (Fig. 13), but not in the one completed for training. 120

Training Program • The panel training program should be conducted by an experienced sensory professional. • The two main components of this training are the basic sensory phase and the product training phase. • The objective of the basic sensory program is to Ø familiarize panelists with the applications of sensory evaluation, Ø its importance within the company and in the measurement of quality, and Ø the basic concepts of physiology that play a role in the evaluation of the company's product characteristics (e. g. , appearance, flavor, skinfeel). 121

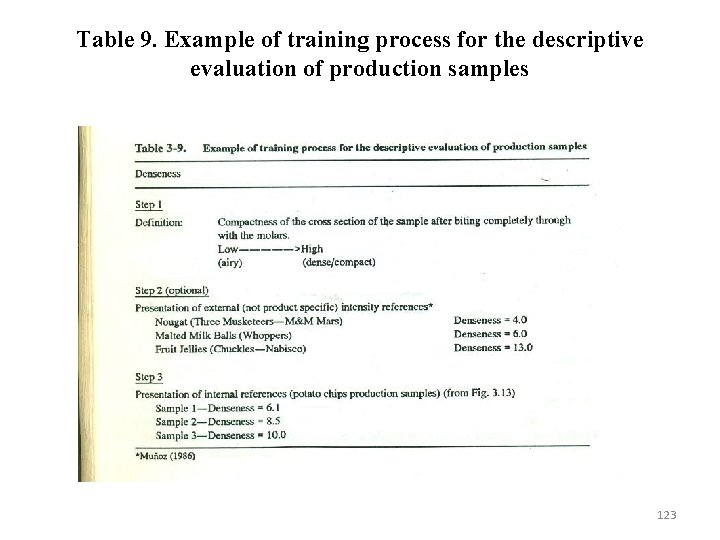
• In the product training phase, each of the attributes, for which sensory specifications have been set, is discussed one at a time. • The production samples, representing ranges for each attribute that were previously identified, are presented to the panelists. • The definition, evaluation procedures, and scoring of each attribute are covered, using external and internal (production samples) references. • Table 9 shows the process for the training of denseness for potato chips. • The same procedure is followed for all attributes. 122

Table 9. Example of training process for the descriptive evaluation of production samples 123

• After this review, test production samples are presented for evaluation. • These test samples are only coded with three digit codes and panelists are asked to rate the intensity of the attribute they just learned. • Initially, the samples representing the largest difference in an attribute are presented as test samples. • For example, for the saltiness exercise for potato chips, the most different samples available, representing the lowest (8. 0) and highest (14. 5) intensity in saltiness are chosen for the first panel exercise. • Panelists rate these two samples for saltiness, and the results are compared to the documented saltiness intensities of those two samples (8. 0 and 14. 5). 124

• In the two to five training sessions, all variable attributes are reviewed and the product evaluation exercises are completed. • Thereafter, practice sessions are conducted to reinforce the concepts learned and give the panelists additional practice in the product evaluation. • In each practice session, each panelist is asked to evaluate selected production samples, presented as unknowns, on a daily basis. • Records of the evaluations are kept and used for panel feedback. 125

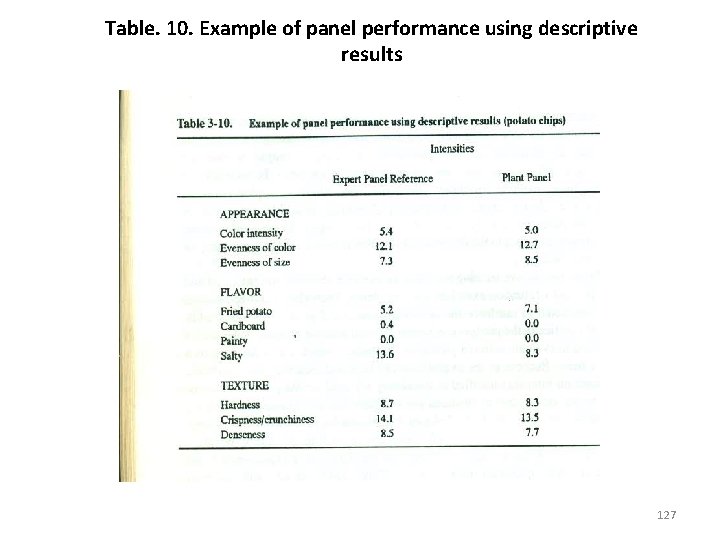
• Production samples identified in the survey are used for the practice sessions. • Therefore, descriptive evaluations are available and are necessary for judging panel performance. • Table 10 shows the process for the potato chip training. • The information listed under "reference" corresponds to the descriptive characterization of the production sample by the trained and experienced panel (like an R&D or contract research panel). • This information was collected prior to the start up of the training. 126

Table. 10. Example of panel performance using descriptive results 127

• The information listed under "plant panel" is the average rating of the plant panel (n=10) of the same production sample. • Simple inspection of these data, and similar information collected across all practice days for a variety of products, indicates the performance of the panel. • In addition, the individual observations are assessed to conclude on each panelist's performance. • Table 10 shows that the panel rated the saltiness intensity lower and the intensity of fried potato higher than it should have. 128

• If this behavior is observed consistently over the practice sessions, these two attributes should be reviewed with the panel. • Product references and other training material are used for this review. • Once the practice period is completed and problem areas have been reviewed and resolved with the panel, the ongoing operation of the program can be started. • This would mean that the panel is qualified to accurately evaluate actual production samples in terms of their variable sensory attributes. • Furthermore, the panel's data can then be handled with other QC data for product decisions. 129

Panel Maintenance • As with any other sensory program, a panel maintenance program needs to be established. • This maintenance program should address both the psychological and physiological factors of the panel. 130

Psychological Factors • The psychological factors are, in the long run, the most important factors that affect panel performance. • A QC/sensory panel that frequently participates in routine evaluation of production samples experiences boredom and lack of motivation after a period of continuous panel participation. • This problem might be further aggravated by other factors, such as Ø lack of support from immediate supervisors, Ø lack of support for relief from the line, Ø plant layoffs, 131

Ø cancellation of panel sessions because of plant crises or production schedules, union problems, Ø boredom in the evaluation process because products are too consistent, and so on. • The plant sensory coordinator should administer a program to maintain the panel's interest, motivation, and, consequently, adequate performance. • Some possible activities are: • Recognizing and appreciating the panel participation by Ø the sensory coordinator, 132

Ø the QC manager, Ø the panelists' supervisors, and, most importantly, Ø the plant manager. • The panelists need to be reminded on a regular basis of the importance of their participation in the program. • Acknowledging the panel participation in solving plant problems and/or the panel support in special plant programs or efforts. This point is related to overall recognition. • Tangible results of critical panel contribution to the plant's operation should be shared not only with the panel, but also with the personnel of the whole plant. 133

• Planning special group activities outside the working place. These group activities foster interaction and friendship among panel members. • Giving small rewards to the panel on an occasional basis. Every company differs in what kind of small rewards are given to the panel for their participation. • Some include trinkets, T shirts, company products, other products, tokens, gift certificates, lunches, dinners and so forth. • Scheduling panel review sessions with the whole panel (or at least groups of ten people) to review the technical aspects of the program (e. g. , attributes, references). 134

• The panel then realizes that the program is important in the company and deserves attention and maintenance. Providing panel performance feedback. • The sensory coordinator informs the panel on a regular basis of the individual and whole panel performance. • This is possible by the use of blind controls presented in regular evaluations. Both the adequate performance and problem areas are shared with the panel. • Recognizing individual panelist's participation. Notable contributions of panelists (attendance, correct identification of blind controls or off notes, ) should receive recognition by the sensory coordinator and the QC manager. 135

• There are many unique ways by which a company can acknowledge the panel participation. • The philosophy and operation of each company determines the most effective activities and aspects of this program. • One factor to consider for in plant programs is the restrictions that plant unions can pose on these activities. • In extreme cases, no tangible rewards can be given to any of the panelists. • In such companies, the sensory coordinator has to rely more heavily on the psychological rewards to the panel for maintaining their interest and motivation. 136

Physiological Factors • As with the psychological maintenance program, there are numerous activities that can be administered by the sensory coordinator to maintain the panel's technical performance. Among the most common and recommended ones are: • Reviewing intensity references on a regular basis. Although this should also be done in the panel review sessions, the review of intensity references should be an ongoing procedure. • Once a week or every other week, the sensory coordinator prepares a product reference (internal reference) and gives it to the panel with a "completed" score sheet that lists the intensity values for all attributes. 137

• These intensities are obtained either from a more experienced panel (such as an R&D panel) or are the average intensities of the plant panel from the evaluation conducted one or two days before. • This serves as a review of attributes evaluated and, more importantly, of the attribute intensities. • Monitoring panel performance through the evaluation of blind references. Blind controls or references should be given to the panel in the regular evaluation sessions on a routine basis. • The descriptive characterization of these references should be available for data comparison. 138

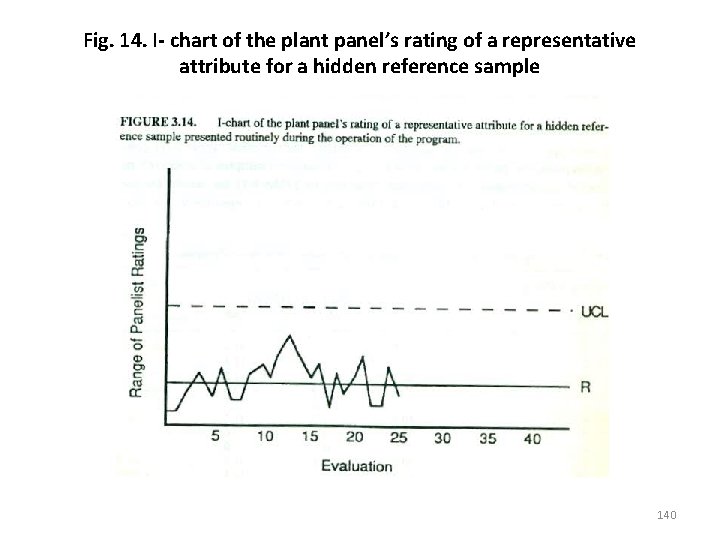
• This characterization is obtained from an R&D panel or from the long term average results of the plant panel itself. • Panel performance is monitored by following the same procedures used in the practice period at the end of training (Table 10). • Comparing the reference results and the average plant panel data allows the sensory coordinator to discover problem areas in the evaluation of product attributes. • In addition, the difference between the plant panel's average result and the reference value for each attribute can be plotted on an I chart, as in Figure 14, to track the consistency of the plant panels ratings over time. 139

Fig. 14. I- chart of the plant panel’s rating of a representative attribute for a hidden reference sample 140

• Monitoring individual panelist performance. The performance of each panelist should be monitored in terms of the following: Ø Individual measurement compared to the panel mean; Ø Individual measurement compared to the results of the blind control; and Ø Individual performance per attribute over sessions. • Calculations of the within and between panel variability per attribute are useful to monitor panelist to panelist and session to session variability, respectively. 141

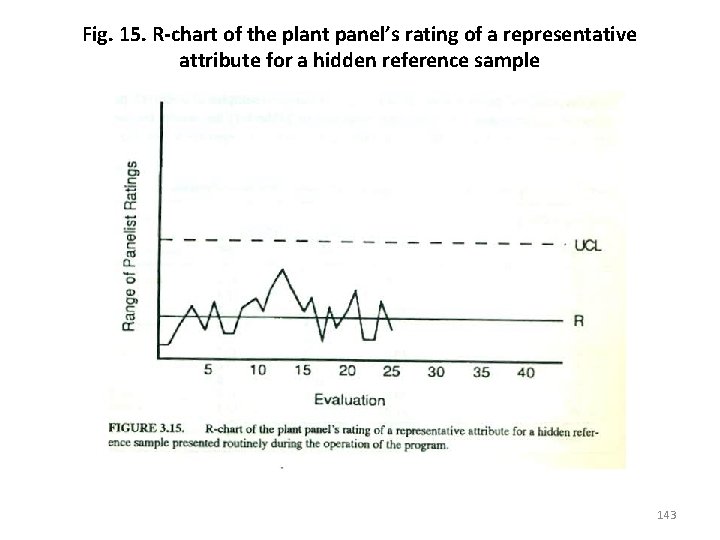
• In addition, I and R charts can be generated for panel performance. • For example, the range of the individual panelists' ratings can be plotted on an R chart (Fig. 15) to assess panelist to panelist consistency. • I charts similar to Figure 14 can be generated for each panelist by plotting the difference between the individual's rating and the panel mean and/or the reference value each time the hidden reference sample is evaluated. • Panelists with consistent positive or negative biases or erratic, highly variable ratings are clearly evident. 142

Fig. 15. R-chart of the plant panel’s rating of a representative attribute for a hidden reference sample 143

• Training on the evaluation of other products • In an established QC/sensory program of a company manufacturing a variety of products, the training on other products is completed on a continuous basis. • Training the panel on other products implies broadening the panel skills or improving the existing ones. • With the introduction of new products to the program, the panel reviews and improves on the attributes already learned and learns new attributes. 144

Establishment of a Data Collection, Analysis, and Report System • Data Collection • Samples to be evaluated by the plant panel are collected at the same time as the samples that will undergo other QC testing. • The frequency of sampling is determined using the same QC criteria that apply to all other tests. • For the potato chip example, each lot of finished product is sampled three times—early, middle, and late in the production run—just prior to packaging. 145

• The number of samples submitted to the panel per session affects the sample presentation design used by the sensory coordinator. • If the number of samples per session is small, a complete block presentation design is used. • If, however, the number of samples per session exceeds that which can be evaluated before sensory fatigue sets in, then a balanced incomplete block presentation design is used. • A complete block presentation is used for the potato chip samples. 146

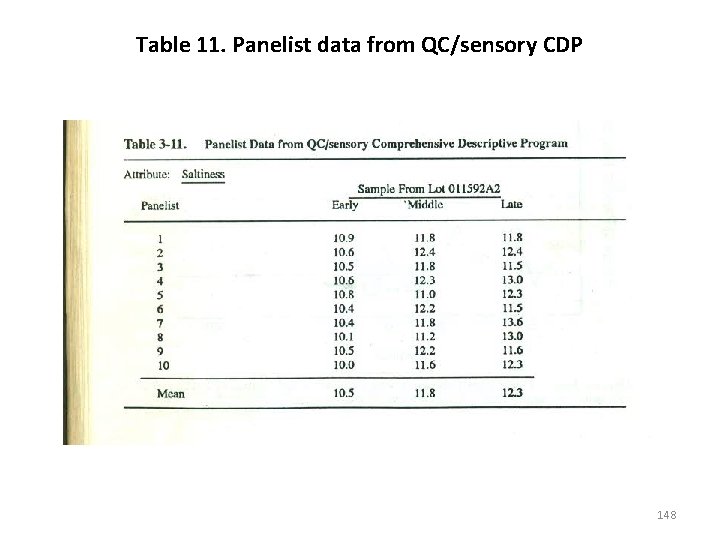
• Data Analysis • For each attribute, the individual panelist's ratings are recorded. • Table 11 contains the panelists' perceived saltiness ratings for the three samples of potato chips collected during routine QC sampling. • Note that in Table 11 the scores for the three samples (early, middle, and late) are recorded separately, so that within lot variability can be tracked. • The panel's average attribute ratings for each of the samples, which appear in the last row of Table 11, are the raw QC/sensory data associated with each lot of product. 147

Table 11. Panelist data from QC/sensory CDP 148

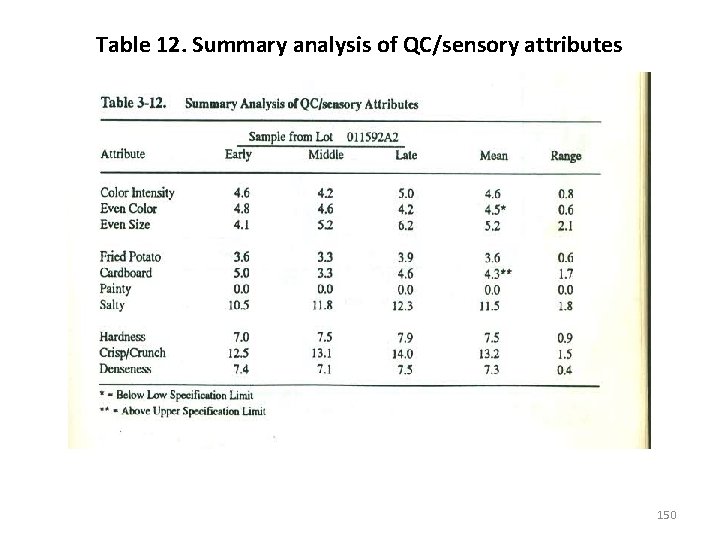
• For complete block presentation designs, arithmetic means are used. • For incomplete block presentation designs, adjusted (or least square) means must be. • If multiple samples per lot are collected, as is done in the potato chip example, the lot average and range (i. e. , the average and range of the panel means) are computed and recorded (see Table 12). • If only a single sample per lot is collected, the panel mean is the mean rating for the entire lot; no measure of within lot variability is available. • Note in Table 12 that lot # 011592 A 2 is out of specification by being too low in "even color" and too high in "cardboard. " 149

Table 12. Summary analysis of QC/sensory attributes 150

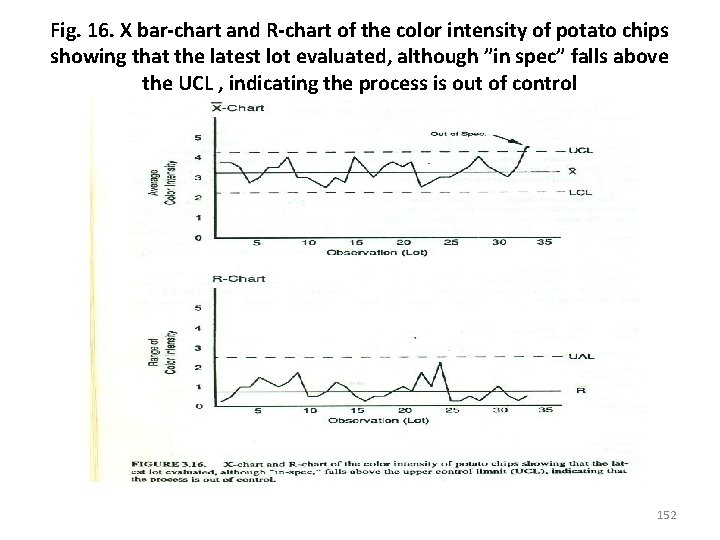
• The potato chip manufacturer has an SPC program in place, so the sensory coordinator maintains the control charts of the sensory attributes that are measured on the finished products. • If multiple samples per lot are collected, as is done for the potato chips, X Charts and R charts are used to track production. If only a single sample is collected per lot, I charts are used in place of X charts. • No analogue for R charts is available when only one sample per lot is collected. • Figure 16 presents the X chart and R chart for the "color intensity" attribute for potato chips. Included in the X chart are the process average (X and 3 σ control limits (UCL and LCL) ). 151

Fig. 16. X bar-chart and R-chart of the color intensity of potato chips showing that the latest lot evaluated, although ”in spec” falls above the UCL , indicating the process is out of control 152

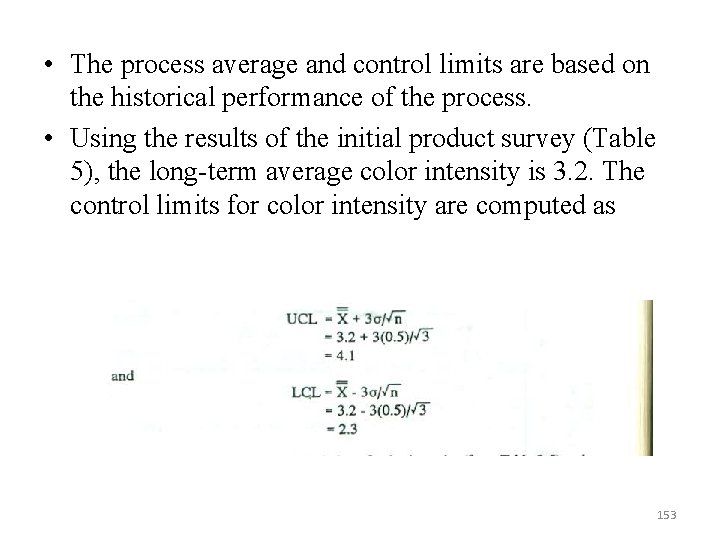
• The process average and control limits are based on the historical performance of the process. • Using the results of the initial product survey (Table 5), the long term average color intensity is 3. 2. The control limits for color intensity are computed as 153

• Where ∂ is the long term standard deviation of color intensity from Table 5 and n is the number of samples collected per lot during routine QC sampling (i. e. , n=3; early, middle and late in the lot). • The X chart shows that, although color intensity is in spec (Table 8), the value for the latest lot (#011592 A 2) lies above the upper control limit. • Over and above the out of spec conditions previously noted, this further indicates that the process is out of control and that corrective actions need to be taken. • The control limits for the R chart are established by multiplying the average range of intensities of the three QC samples (e. g. , R = 0. 85 for color intensity, based on historical data) by the entries corresponding to n = 3 in Table A 10 at the end of the book. 154

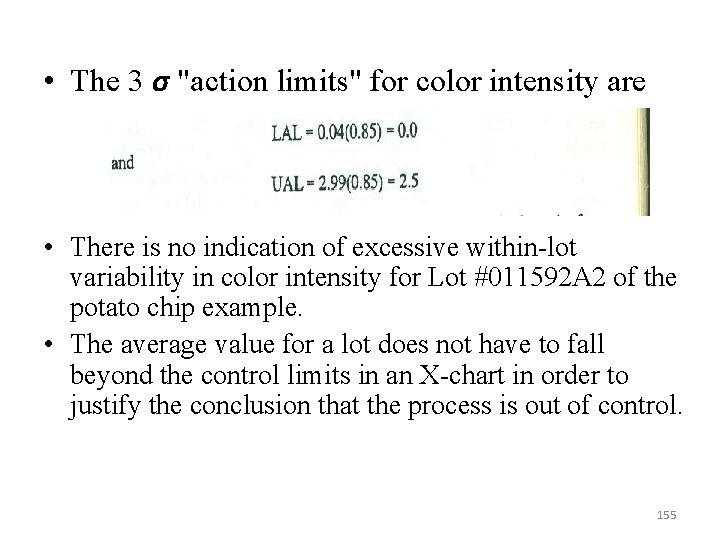
• The 3 σ "action limits" for color intensity are • There is no indication of excessive within lot variability in color intensity for Lot #011592 A 2 of the potato chip example. • The average value for a lot does not have to fall beyond the control limits in an X chart in order to justify the conclusion that the process is out of control. 155

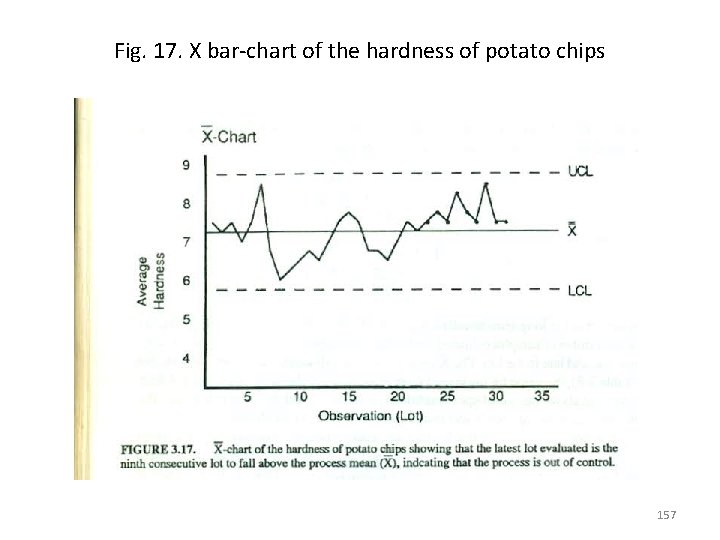
• Figure 17 shows the X bar chart for the hardness attribute of the potato chips. • The most recently observed lot, with an average value of 7. 5, is the ninth consecutive lot with a hardness rating above the long term average of 7. 3 (Table 5). • Based on Nelson's (1984) criteria, this occurrence is another signal that the process is out of control, even though the most recently observed lot has a hardness rating very close to the long term average. 156

Fig. 17. X bar-chart of the hardness of potato chips 157

• Report System • The sensory coordinator should highlight any samples that fall out of specification, using the company's standard procedures for such occurrences as presented, for example, in Table 12. • Additionally, if an SPC program is in effect, the control charts for each of the attributes should be updated each time a new lot of product is evaluated as in Figures 16 and 17. • The updated charts should then be forwarded to appropriate personnel. 158

• The key factor to bear in mind is that the QC/sensory data should be treated in exactly the same manner as any other analytical measurements being collected for QC. • All standard company formats, reporting procedures, and action standards apply. • Once in operation, a successful QC/sensory function should be a fully integrated component of the overall QC program. 159

Characteristics of the ongoing program • After completing all the steps described in this chapter, the routine program can be established and operated on an ongoing basis. • All QC/sensory programs consist of daily/routine and long term activities. • Routine Activities • Scheduling of Panel Sessions • At the start up of the program, the sensory coordinator spends a considerable amount of time scheduling and conducting the panel sessions for a given week. 160

• At this time, many program components have yet to be established, such as Ø the sampling schedule (product collection), Ø panelist's individual schedules, and Ø procedures for relieving line workers. • Once all the program parameters have been delineated, routine evaluations can start. • The routine schedule of panel sessions is another factor unique to each company. 161

• Some companies might decide to schedule only one session per day to evaluate production samples from the previous or same day. • Others might decide to schedule more than one session per day, since many more products are to be evaluated. • This decision has to be made in the preliminary and planning phase of the QC/sensory program because of its impact on other characteristics of the program. 162

• Based on the product sampling plan chosen, the product characteristics, and the maximum time a panelist can spend in panel session, • the following are determined: • The number of panel sessions scheduled in a day; • The times (schedule) of the those sessions; and • The logistical requirements for the completion of the evaluations, besides personnel (i. e. , the product pickup, product delivery to sensory area, materials needed, use of evaluation room, etc. ). 163

• These aspects should be established and then become a routine in the operation of a QC/sensory program. • Scheduling of Panelists' Participation • Careful assessment of the program's needs and resources at the planning phase of the program assures Ø the use of a sufficiently large pool of panelists per evaluation (e. g. , ten panelists) and Ø avoids the continued routine participation of panelists without a recess. 164

• From experience, scheduling panelists in daily evaluations in one week, every other week, is an adequate schedule for good panel performance. • Participation can possibly be increased to weekly evaluations (with three to four days per week) if several product types are evaluated. • This is possible, since the product diversity introduces some variety to the routine evaluation sessions of a QC/sensory program. • However, as more products get integrated into the QC/sensory program, consideration should be given to training new panelists, rather than using the same panelists to participate in daily evaluation sessions. 165

• The busiest evaluation schedule a panelist should be given should be two sessions per day on a routine basis. • Even then, this situation is only effective when a variety of product types are evaluated throughout the daily sessions. • Considering the above factors, each panelist's schedule should be prepared at the start up of the program and communicated to both the panelist and his supervisor. • Ideally, this schedule can be maintained for at least a month. 166

• Realistically, however, due to panelists' sickness, unexpected unavailability, and so on, a new schedule may have to be prepared on a weekly basis by the sensory coordinator. • In scheduling each panelist's series of evaluations, it is important that the following be observed: • The schedule and/or its modifications must be communicated to both the panelist and his supervisor. • Early notification assures the panelists' availability (especially in the case of line workers). • Each panelist's schedule has to conform with the maximum number of sessions allotted per panelist in a week and the maximum time allowed per session. 167

• Administration of Test • In administering each test, the sensory coordinator must give attention to: • Adherence to adequate experimental and test designs; • Administration of product pickups; • Sample preparation and presentation; • Preparation of references; • Preparation of score sheets or data collection system; • Use of adequate evaluation procedures; • Maintenance of test controls; and • Complete and adequate data collection. 168

• The time spent in the administration of the evaluation sessions by the sensory coordinator depends on Ø the type of product evaluated, Ø the evaluation procedures, and Ø the data collection system of the program. • The most involved programs are those requiring very controlled and complex product preparation procedures. • Among these include certain food products requiring cooking or heating. • In such cases, the program requires not only the complete supervision of the sensory coordinator, but the help of one or more QC/sensory technicians. • When complex sample preparation is required, a more structured scheduling of sessions and panelists is necessary to ensure the integrity of the samples evaluated. 169

• Conversely, other programs require minimal supervision. • An example is a program for the evaluation of hard candy or paper products. • As long as the facility offers the required environmental controls, panelists can complete their evaluation at the most convenient times for them. • Products can be prepared in advance and left in the evaluation room for each panelist. • The sensory coordinator requires minimal technician assistance and he or she is only needed to answer special questions or solve problems. 170

Data Analysis, Report, and Integration with Other QC Data • The QC/sensoty data should be reported in the same manner as any other QC data. • Timing and format are established based on current company QC practices. • Scheduling of Special Sessions • From time to time, special sessions are scheduled at the request of the plant or quality control managers to collect sensory information on production batches identified with problems or special characteristics. 171

• These sessions usually take priority over all other activities of the sensory program, since they are critical for the plant's operation and also for the growth of the sensory program within the plant. • The extent to which an established sensory program can assist in solving production problems will determine the degree to which the sensory program is recognized and supported. • The sensory coordinator should welcome those situations and provide full support. • Furthermore, the sensory coordinator should be involved in all problem solving situations for the benefit of the program. 172

Panel Maintenance • The panel monitoring and maintenance should be an ongoing and important activity of the sensory program. • Several procedures have been discussed earlier. In addition, any other procedure used for panel monitoring and found in the sensory literature should be considered in QC/sensory programs. 173

Long-Term Activities • The long term activities involve the growth and extension of the QC/sensory program and include activities related to program, panelists, and the sensory coordinator. • Program Issues • The established sensory program can grow through the introduction of other products to the program, the extension of the program to other production phases, and the involvement in plant based research projects. 174

• Additional Products • The support, growth, and success of a QC/sensory program is evident by the degree and frequency with which additional products are incorporated into the program. • As this occurs, the sensory program further develops in several ways: Ø New panels are trained, Ø panelists' skills improve, Ø the sensory staff expands, Ø the sensory facility might be remodeled or expanded, and Ø the program becomes an essential component of the plant's QC program and operation. 175

• Evaluation of New Production Phases • As the QC/sensory program grows, other points of evaluation in the process are incorporated into the program. • Those programs dealing exclusively with finished products are expanded to include the evaluation of raw or in process materials. • Conversely, those programs established for the evaluation of raw ingredients expand into the assessment of finished products. 176

• The ultimate goal of an in plant program is to cover all critical production facets of all the important product categories. • Since all production facets for a variety of products cannot be covered by a program, the resources should be allotted to those areas yielding the maximum benefits and savings for the plant. • This is the situation of a program whose efforts and resources focus on the evaluation of raw materials, with occasional evaluation of in process and finished products as final controls. 177

• Research Projects • A variety of research projects need to be undertaken by the sensory coordinator for the program's growth. • These projects are generally completed in collaboration with the R&D sensory and other departments. • There are many areas of research within a QC/sensory program. • The priority placed in these projects is company dependent. 178

• Realistically, there are many companies that will never undertake a research project, since their budgets and resources are limited to the routine administration of the in plant program. • For others, such research may be an essential component of the program. • There are two main research areas of importance for the QC/sensory program's growth: • The assessment of sensory instrumental relationships; and • The evaluation of consumer response to product changes and variability. 179

• Both areas are geared to reduce the routine tasks and work load of the sensory program. • This in turn allows the use of those resources in other areas of production and/or other products. • Ultimately, a sensory program should only be evaluating product attributes that Ø 1) cannot be instrumentally measured and Ø 2) are critical to consumer acceptance. • These modifications can only be made through the design and execution of research projects. 180

• Sensory Coordinator's Development • The sensory coordinator's development should be in several areas: Ø his or her own sensory knowledge, Ø his or her sensory skills as a panelist, and Ø his or her interaction with R&D groups and all the groups in the plant. • It is important that the sensory coordinator expands his or her knowledge in all areas of sensory evaluation. • Many times, the coordinator's managers do not support this growth, since an in plant program is considered a routine program requiring little improvements once it is in operation. 181

• However, a sensory coordinator needs to expand his or her knowledge in panel training and leadership, data analysis, and other sensory areas related to the • type of evaluation and research being conducted. • For that, there a variety of short courses offered through universities, professional associations, and consulting firms that should be considered. • In addition, attending professional meetings and interacting with the R&D sensory department keeps the sensory coordinator informed of the new developments in the field. • The sensory coordinator's skills as a panelist have to be expanded as well. 182

• The interaction with various R&D groups and all groups in the plant are also part of the coordinator's development. • Maintaining an interaction with R&D fosters the coordinator's involvement in research projects that benefit the plant and the company. • In addition, it allows the coordinator to get involved in R&D sensory projects and programs, such as product training and audit programs, technical projects, and so forth. 183

• Part of the sensory professional's development is his or her interaction with all plant personnel, which allows the sensory coordinator to Ø discuss and resolve panelists' attendance problems, Ø gives visibility to the sensory program and its purposes, Ø helps recruit new panelists, and Ø fosters the interaction among supervisors, plant workers, and other plant staff. 184

• Panelists' Development • The panelists' development should focus on product evaluation skills and their knowledge in sensory evaluation. • The importance of improving the panelists' skills was discussed under panelists' motivation. • Improving their product evaluation skills through training in other products not only serves as a motivational factor, but improves their technical expertise as panelists for products evaluated already, new products, and special sensory problems that may develop at the plant. 185

• In addition, the sensory coordinator should develop a program geared to expand the panelists' sensory knowledge. • This may be done by Ø organizing presentations of basic sensory topics and of R&D sensory projects, and Ø by circulating basic sensory technical literature. 186

OTHER VERSIONS • The earlier given data has presented the characteristics and the steps to implement the most complete version of the comprehensive descriptive method. • This version requires: • Committing to all the resources needed in this approach; • Using it mainly for finished products with about 10 to 15 attributes evaluated; and • Introducing one product at a time into the program. • There are, however, abbreviated versions of the comprehensive descriptive method. 187

• These are: Ø A shorter, less comprehensive approach used by itself; Ø A shorter version across several similar products; and Ø A shorter version used in combination with other methods. 188

Shorter Version Used By Itself • A shorter version of the comprehensive method involves the evaluation of only a few attributes (one to five), which are the most critical attributes in the product. • This approach works particularly well when assessing raw ingredients or very simple products (e. g. , hard candy, powdered drinks). • The few attributes are either chosen by management or through a research project geared to assess the importance of the attributes based on consumer acceptance (in the case of finished products) or the final product quality (in the case of raw ingredients). • The process for selecting attributes is the same as that described for the complete version in previous sections. 189

• The philosophy and the evaluation procedures in this version are the same as for the complete approach. • However, only the most variable and critical product attributes are chosen. • The panel is trained to evaluate the intensity of only the selected attributes, using an abbreviated ballot (see Fig. I 8 A and 18 B). • This version, because of its simplicity, requires considerably less time and resources to implement • Typically, companies that use this modified version implement it to evaluate many raw ingredients or simple products. 190

FIGURE 3. 18. Evaluation form used for a modified comprehensive description method (shorter version). 191

• It should be noted that a complete comprehensive descriptive approach, like the potato chip program described earlier, could develop into this shorter version long term. • This situation is desirable and likely to occur when research has been conducted to substitute the sensory measurements by the more simple, less expensive, and less cumbersome instrumental evaluation shown to correlate with the sensory responses. 192

Shorter Version Across Several Similar Products • A company that produces a variety of products within the same category (e. g. , a variety of salad dressings) might consider implementing this modified version. • In this version, all or many of the products in the group are introduced simultaneously into the program because of their similar sensory characteristics. • Only a few attributes in each product type are evaluated, and there might be one or two attributes common to all products. • With all products having similar characteristics and differing only in two or three sensory attributes, it is beneficial and effective to simultaneously train a panel to evaluate all products. 193

FIGURE 3. 19. Evaluation form used for a modified comprehensive descriptive method (shorter version across similar products). 194

• The training first covers the common attributes and then focuses on the few attributes unique to each product. • The program is effective, regardless of the company's production schedule—that is, varieties may be produced simultaneously or in a staggered manner. • The panel, however, can operate on a routine basis, evaluating whatever product variety is currently being produced. • Figure 3. 19 shows the evaluation forms of three different mouthwashes. Most of the sensory characteristics are common to all varieties, except for the flavor type and color. 195

Shorter Version Combined with Other Methods • A shorter version of the comprehensive descriptive approach can be used in combination with other methods described in this book. • This modified version would be implemented when a company is interested in obtaining some attribute information in addition to other sensory measurements. Some examples are: • Descriptive attribute evaluation after an overall quality product rating; 196

• Descriptive attribute evaluation after an "in/out" of spec assessment; and • Descriptive attribute evaluation after an overall difference from control measurement. • These modifications will be discussed in more detail in Chapters 4 ("Quality Rating"), 5 (" 'In/Out' of Spec") and 6 ("Difference from Control"), in sections discussing other versions of these methods. 197