Canadian Minerals and Metals Zora Toor Tarlochan Chane
 • Mel Chua")


 • Very sensitive to fluctuations in exchange rates and commodity prices")
 • Environmental consideration: • Noise pollution • Acid mine drainage •")

")
")


 Military • 2) Civilian •")
 • Major Stages in Production of Nuclear Fuel: • 1) Uranium")


 • Canada is among the top producers of uranium in")

 • China is expected to lead the world in the")


")

")
")


 • Conducting electricity and heat • Communications • Transporting water and")


")


 • Antamina")
 • Red Dog (100%) •")


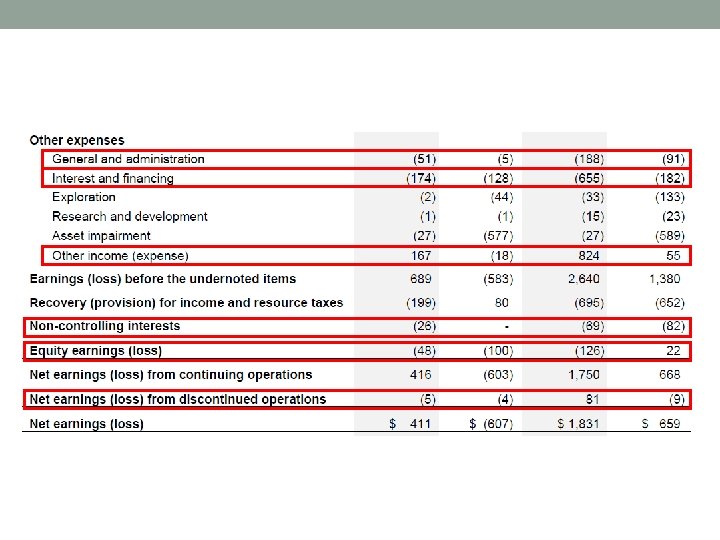
 2009 2008 Operating profit before depreciation Net earnings")


 §")
 §President and CEO of")

 Dec. 31, 2008 Dec. 31, 2009 March")


")


 Port")


 • End")


")


 - President and CEO of Goldcorp from 2005 until its")


- Slides: 172
Canadian Minerals and Metals • Zora Toor • Tarlochan Chane (TC) • Mel Chua • Zhilicka Sehgal
INDUSTRY OVERVIEW Canadian Minerals and Metals
Minerals and Metals Industry • Comprised of mineral exploration, mining and quarry industries, primary metals, fabricated metal products and nonmetallic mineral products industries • Includes Metal, nonmetal and coal mines, stone quarries, sand gravel pits, oil sands operations and manufacturing capacity (nonferrous metal smelters, refineries and steel mills)
Industry Characteristics • Extremely Capital Intensive • Exploration cost • Operation cost • Equipment cost • Recovery cost • • Sensitive to changes in business cycle Large, medium and small size companies
Industry Characteristics (2) • Very sensitive to fluctuations in exchange rates and commodity prices • Hedge: • Less speculative • Reduced exposure and uncertainty • Smooth cash flows • No Hedge: • Volatile cash flow • Tax • Self-correction in long run
Industry Characteristics (3) • Environmental consideration: • Noise pollution • Acid mine drainage • Changes in local water balance • Soil erosion • Disruption of animal life • Stringent environmental regulations
The Canadian Mining Industry • A Key Feature of Canada’s Economic Landscape • Canada is a leading producer and exporter of minerals and mineralbased products. • Canada is one of the largest mining nations in the world, producing more than 60 minerals and metals. • The industry employs some 388, 000 Canadians • Contributed $40 billion to Canada’s GDP in 2008 (Statistics Canada, 2009)
Capped Diversified Metals and Mining Index vs TSE Market Index (1 yr)
Capped Diversified Metals and Mining Index vs TSE Market Index (5 yr)
URANIUM
Uranium • About Uranium • Process • World Production • Uranium Mining in Canada • Price • Supply and Demand
About Uranium • Two uses for Uranium: • 1) Military • 2) Civilian • Nuclear power is a clean source of electricity, and generation capacity is growing.
About Uranium (2) • Major Stages in Production of Nuclear Fuel: • 1) Uranium Exploration • 2) Mining and Milling • 3) Refining and Conversion • 4) Enrichment and Fuel Fabrication
Uranium Enrichment and Processing
World Production Source: Cameco, 2009
Uranium in Canada • Canada has three operating uranium mines and mill sites, one mine site, and one new uranium mine site under construction (all in Northern Saskatchewan). • Nuclear power provides approximately 14. 7% of Canada’s electricity. • Over 80% of the uranium shipped from Saskatchewan mines goes to non-Canadian markets for the generation of electricity.
Uranium in Canada (2) • Canada is among the top producers of uranium in the world. • The uranium mining and milling industry is the only mining industry in Canada licensed and regulated by the federal government. • The Canadian Nuclear Safety Commission (CNSC) is the federal regulator for the uranium industry.
Future Uranium Demand
Future Uranium Demand (2) • China is expected to lead the world in the construction of nuclear power plants as electricity demand continues its rapid growth. • China is currently operating 11 reactors, building 20 and planning more. We expect it to have a net increase of 42 reactors by 2019. • India is also planning more reactors.
Uranium Prices
ZINC
Zinc • About Zinc • World Zinc Production • Industrial Consumption
About Zinc • Zinc is most commonly used for galvanizing steel. • Other applications include: • Construction • Transport • Consumer goods and electrical appliances • General engineering
About Zinc (2)
Zinc World Production Volume Open Pit Mining Underground Mining Combination Source: International Zinc Association
Zinc Spot Price (1 yr)
Zinc Spot Price (5 yr)
COPPER
Copper Overview • About Copper • Copper Supply and Demand • World Copper Usage • Refined Copper Usage by Region • Prospects and Price
About Copper - Efficient conductor of electricity and heat - Flexible, strong, durable and resistant to corrosion
About Copper (2) • Conducting electricity and heat • Communications • Transporting water and gas • Roofing, gutters and downspouts • Protecting plants and crops, and as a feed supplement • Making statues and other forms of art.
Copper Supply and Demand • Growing demand because of: • Widespread use • Industrializing countries such as China and India • Supply • Copper supply comes from two sources: • Primary production (88%) ~ mine from the ground • Secondary supply (12%) ~ recycled copper scrap
World Copper Usage
Refined Copper Usage by Region, 19932008
Major International Trade Flows of Copper Ores and Concentrates
Leading Exporters and Importers of Copper Ores and Concentrates, 2008
Copper Prices, 1 Year Spot
Copper Prices, 5 Year Spot
Copper Prospects • Weak world economy due to financial crisis is expected to an overall global decrease in usage of 0. 7% • Surging industrial output in China • China is the world’s largest consumer of industrial metals • Decline of 17% in the 3 major markets is partly offset by growth in apparent usage in China of 26% • Prices expected to stabilize by 2011 (ICSG)
GOLD
Gold Overview • About Gold • Demand • Prices • Gold and the US Dollar
About Gold • Gold is used for: • Jewellery • Investment • Medium of exchange • Industrial
Gold Demand
Gold Spot Price, 1 yr
Gold Spot Price, 5 yr
Gold and the US Dollar
COAL
Coal Overview • About Coal • Energy Demand • Types of Coal • World Coal Consumption • Annual Coal Prices
Energy Demand • Primary energy demand has increased 50% since 1980 • Growth is forecast to continue at annual rate of 1. 6% between 2004 -2030 • 70% of this growth will come for developing countries • Fossil fuels projected to provide 80% of total energy demand into the future • Coal will see the largest demand increase in absolute terms (International Energy Agency)
About Coal • Coal is the world’s most abundant and widely distributed fossil fuel. • Coal is carbon-rich mineral deposit formed as organic plant matter decayed. • Coal generates the largest single source of electricity in the world. • Electricity generation, steel and cement manufacturing and industrial process heating.
Types of Coal
World Coal Consumption
Annual Coal Prices
Spot Prices for Coal
(TSE: TCK-B)
Market Profile Current Price P/E Dividend Yield Shares Outstanding Market Capitalization Daily Volume 52 Week Price Range EPS 41. 58 12. 09 589 M 24, 495 M 2, 027, 262 4. 50 -42. 98 3. 44
Common Shares Outstanding Current Dec. 31, 2009 Dec. 31, 2008 Class A 9. 35 M Class B 579. 8 M 579. 7 M 477. 5 M One Class A share has the right to 100 votes One Class B share has the right to one vote
5 Year Trend of Common Shares
1 yr. Stock Price Trend – TCK. B
5 yr. Stock Price Trend – TCK. B
1 Yr. TCK. B & S&P/TSX Global Mining
5 Yr. TCK. B & S&P/TSX Global Mining
Breakdown of Business Units
Investments – Core Assets • Copper • Highland Valley Copper (97. 5%) • Antamina (22. 5%) • Quebrada Blanca (76. 5%) • Carmen de Andacollo (90%) • Duck Pond (100%) • Metallurgical Coal • Teck Coal Partnership (100%)
Investments – Core Assets • Zinc • Trail (100%) • Red Dog (100%) • Energy • Fort Hills Project (20%) • Frontier and Equinox Projects • Other Oil Sand Leases (50%)
Non-Core Asset Dispositions • 78. 8% interest in the Morelos gold project • Disposed in November 2009, for • US$150 million cash, approximately 1. 6 million common shares, and 12. 4 million special warrants of Gleichen • 60% interest of the Agi Dagi and Kirazli gold projects in Turkey • Disposed in January 2010, for • US$24 million, and 2. 4 million shares • Interest in future gold production from Andacollo mine sold to Royal Gold • Disposed in January 2010, • Provided Andacollo with US$218 and 1. 2 million common shares of Royal Gold Teck’s share is 90%
Other Dispositions • Sale of one-third interest in the Waneta Dam for C$825 million, closed on March 5, 2010 • Total debt decreased to C$6. 7 billion • Term loan is US$1. 14 • Cash balance C$1. 3 billion
Teck Operation Overview
Overview
History • Teck is Canada's largest diversified mining, mineral processing and metallurgical company • Owns or has interests in 15 mines in Canada, United States, Chile and Peru • Cominco started in 1906 as a mining and smelting company • After a merger in 2001, became Teck Resources Ltd.
Highlights and Significant Items (in billions) 2009 2008 Operating profit before depreciation Net earnings 3. 7 2. 8 1. 8 . 659 EBITDA 4. 1 2. 0 Revenue 7. 7 6. 7
Geographic Segment 12/31/08
Business Segment 12/31/08
Revenues and Operating Profit by Product
Average Metal Prices and Exchange Rates
Financial Instruments and Derivatives
Management Norman B. Keevil (B. A. Sc. , Ph. D. , LL. D) § Joined the Board in 1963 §VP Exploration at Teck from 1962 -1968 §Executive VP from 1968 -1981 §President and CEO form 1981 -2001 §Chairman of the Board since 2001 §Lifetime director of the Mining Association of Canada §Inducted into the Canadian Mining Hall of Fame in 2004
Managment Donald R. Lindsay (B. Sc. , M. B. A) §President and CEO of Teck since January 2005 §President of CIBC world Market Inc, Head of Investment and Corporate Banking
TECK Financial Analysis
Debt positions and credit ratios (in millions) Dec. 31, 2008 Dec. 31, 2009 March 5, 2010 Term loan 3, 937 2, 325 800 Bridge loan 5, 284 - - Fixed rate term notes 1, 181 5, 086 167 205 Total debt (US$) 10, 569 7, 616 6, 091 Total debt (C$) 12, 874 8, 004 6, 402 850 1, 420 900 12, 024 6, 584 5, 502 D/E 54% 36% 29% Net D/E 52% 31% 26% Other Cash balances (C$) Net debt (C$)
Outlook • General economic conditions • Base metal prices increased • Improved customer demand • Capital expenditures • Approximately $1. 05 billion for 2010 • $375 million of sustaining capital expenditures • $675 million on development projects
Outlook • Foreign exchange, debt revaluation and interest expense • Sales of products are denominated in USD • Expenses are incurred in local currency (CAD)
Outlook • 2010 production
Recommendation: BUY
(TSE: CCO)
Market Profile Current Price P/E Dividend Yield Shares Outstanding Market Capitalization Average Daily Volume 52 Week Price Range EPS 28. 67 12 0. 82% 392. 71 B 11. 55 B 984, 678 17. 01 - 35. 00 1. 84
Market Profile • 1 Year Stock Chart
Market Profile • 5 Year Stock Chart - CCO vs TTMN
Business Overview Cameco Uranium Fuel Services Electricity
Business Overview • Uranium • 16% of world production • 480 M lbs of U 3 O 8 (Cameco`s share) • Low cost producer • Fuel Services • Refines and converts uranium to UF 6 for use in nuclear reactors • Electricity Generation • 31. 6% stake in Bruce Power L. P • Gold • As of December 2009, CCO sold stake in Centerra Gold Inc.
Business Overview • The Athabasca Basin hosts the world's richest high-grade uranium deposits
Uranium Processing Key Lake Mc. Arthur River Blind River ( UO 3 ) Port Hope
Important Mines • Mc. Arthur River • World's largest high-grade uranium deposit • Milled at Key Lake • 232. 2 M pounds (69. 8% share) • End product: U 3 O 8 – 19. 5% grade
Important Mines • Cigar Lake • World's second largest undeveloped high-grade uranium deposit • 104. 7 M pounds reserve (50% share) • End product: U 3 O 8 – 17% grade
Important Mines • Cigar Lake • Development began 2005 • 2006 and 2008 flooding • Share price dropped to $38 from $43 • Production start date mid-2013 • New Jet Boring mining method
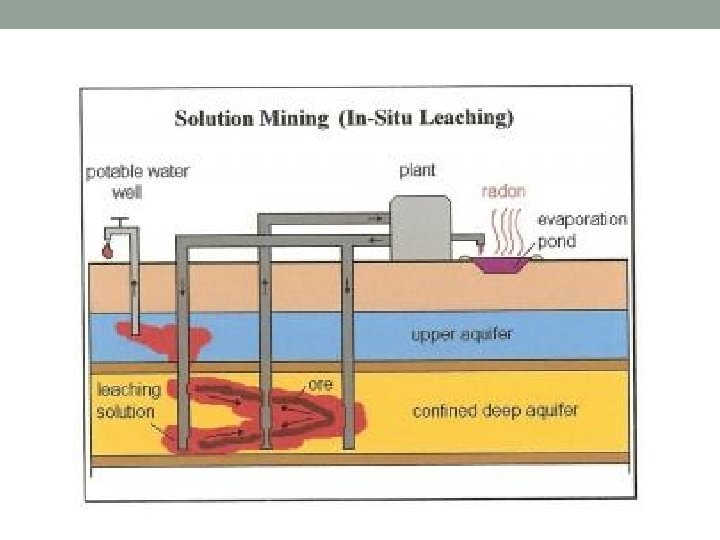
Important Mines • Inkai, Kazakhstan • 85. 1 M pounds (60% share) • End product: U 3 O 8 – 0. 07% grade • In Situ Mining method • Currently test mine • Commercial production expected 2009* • Was able to produce 0. 3 M lbs for Cameco
Reserves • As of Dec 31, 2009
15 Year U 3 O 8 Price History
6 Year UF 6 Price History
Uranium Prices • Average realized prices 2009 2008 2007 % Change 2008 -2009 Uranium $US/lb $Cdn/lb 38. 25 45. 12 39. 52 43. 91 37. 47 41. 68 (3)% 3% Fuel Services $Cdn/lb 17. 84 15. 85 14. 04 13% 64 57 52 12% Electricity $Cdn/MWh
Expected Realized Prices • How long terms contracts would respond to changing spot prices • Assumption: current contract portfolio remains unchanged
Financial Contracts • Most contracts are long term; CCO sells directly to nuclear utilities • Sells uranium concentrate, UO 2 , UF 6 , conversion or fuel fabrication • Current contracting strategy is to have contracts of 10+ years • Provides cash flow visibility (reduced volatility)
Financial Contracts • Contracts include embedded derivatives to protect downside and participate with price increases • 40: 60 ratio • 40% at fixed prices based on long term indicator adjusted for inflation • 60% at spot price near delivery time • CME contract size: 250 lbs of U 3 O 8
Foreign Exchange • Natural hedge against USD • Cash outlays denominated in USD • $0. 01 increase in USD/CAD decreases net earnings $7. 1 M
Revenue and Profit Segmentation
Geographic Revenue and Asset Segmentation
Growth Oriented Highlights Uranium Volume 2009 2008 20. 8 M lbs 17. 3 M lbs 20 1, 512 3 Revenue ($ M) 1, 551 Fuel service Electricity Volume 12. 3 M kg. U 8. 3 M kg. U Change % 48 Revenue ($ M) 276 252 Output (100%) 24. 6 TWh 24. 7 TWh Revenue ($M) 1, 640 1, 409 16 EBI 141 59 224 20 -
8 Year Revenue Growth
Growth Oriented • Increasing demand for electricity by India and China • Global clean energy movement • 53 reactors in construction, 91 projected to come online in 2019 • Uranium demand projected to grow at 3% over next 10 years
Strengths • Low cost Canadian operations • Largest high-grade uranium deposits • Long-term contracts • High capital costs and long lead times • Barriers to entry
Weaknesses • Nuclear plant construction very costly • Does not qualify for greenhouse gas emission credits • Moderate growth for uranium fuel as not many reactors are online • Demand is cyclical due to market’s infancy • Uranium prices are volatile
Long Term Strategy • Uranium – double production to 40 M pounds by 2018 from existing assets • Fuel Services – invest to support nuclear reactor growth • Electricity – maintain cash flow and look for new opportunities • Cigar Lake • Maintain exploration • 70 active exploration projects
New Projects • Millennium • Founded in Saskatchewan in 2000 • 42% ownership, 19. 6 M lbs of U 3 O 8 • Kintyre • Acquired from Rio Tinto in Australia in 2008 in joint venture • 70% ownership
Material Risks to Long Term Strategy • Inability to increase production at mines • Partner and political risks • Natural forces • Ex: flooding at Cigar Lake
Management Gerald W. Grandey , President and CEO • Current • Appointed CEO of Cameco January 1, 2003. • Appointed president elected as director on Cameco's board May, 2000. • On the boards of the Canadian Nuclear Association, the Nuclear Energy Institute, the National Mining Association
Management Gerald W. Grandey , President and CEO • Previous • Vice-chair and chief executive officer of The Concord Mining Business • • Unit President of Energy Fuels (an American coal and uranium mining company) Practiced law in the mid '70 s with a major Denver law firm specializing in mineral financing, natural resources and environmental law. President of the Uranium Producers of America Vice-chair of the World Nuclear Association • Colorado School of Mines (1968), Bachelor of Geophysical engineering • Northwestern University (1973), Law Degree
Management • Tim S. Gitzel: Senior Vice-President and Chief Operating Officer -16 yrs of senior management experience in uranium industry -Executive VP of mining business unit for AREVA (France): global uranium and gold exploration - Chief of staff to SK deputy premier and minister of economic development
Management • O. Kim Goheen: Senior Vice-President and Chief Financial Officer - Extensive experience in domestic and international finance in transportation, petroleum, mining and energy industries -Served in a variety of financial capacities at IPL Energy Inc. (Enbridge) - Commerce degree from UBC 1977, MBA from U of Western Ontario.
Board of Directors • High degree of independence from management • Only 2 of 14 individuals on Board of Directors are not independent
Financial Highlights 2009 2008 Change % Revenue 2315 2183 6 Gross profit 750 829 (10) Net earnings 1099 450 144 -$ per common share (diluted) 2. 82 1. 28 120 Adjusted net earnings (non. GAAP) 582 589 (1) -$ per common share (adjusted and diluted) 1. 49 1. 67 (11) Cash provided by continuing operations 690 530 30
Financial Analysis – Net Earnings • Net earnings higher due to sale of Centerra gold stake • 374 M of 1099 M • Mark to market gains of 179 M on financial instruments • ~50% of net earnings from one-time items
Financial Analysis – Adjusted Net Earnings • Earnings decreased 1% • Higher uranium costs due to purchasing at higher prices • Lower gold sales • Electricity sales increased due to higher prices
2010 Sales Outlook • Uranium • Decrease 5 -10% • Lower volume • Fuel services • Increase 5 -10% • Higher volume • Electricity • Decrease 5 -10% • Lower prices
Outlook • Doubling production by 2018 to 40 M lbs • Exploration costs increase by over 75% • Administration costs increase 25 -30% • Cost increases for sustaining operations
Recommendation • HOLD • Increased exploration and costs • Weak demand for uranium • Uranium competes with other forms of alternative energy (i. e. coal and wind) • SPECULATIVE BUY • Market leader • Highly levered to Ux prices
Gold. Corp Inc • STOCK PRICE ANALYSIS • OPERATIONS • FINANCIAL STATEMENT ANALYSIS • RECOMMENDATIONS
TSE: G
Market Profile as on 10 th March 2010 HIGH 42. 00 LOW 40. 92 52 WEEK HIGH 48. 37 52 WEEK LOW 32. 39 BETA 0. 82 MRKT CAP 30. 42 B P/E 25. 02 FWD P/E 31. 56 ANNUAL DIVIDEND 0. 19 YIELD 0. 50
COMMON SHARES OUTSTANDING SHARES 2009 2008 733. 5 M 729. 6 M
1 YEAR VS MARKET & INDUSTRY
5 year
ABOUT • Leading gold producer engaged in gold mining and related activities including exploration, extraction, and processing • One of the top senior gold producers in the world • Produces Gold, Silver, and Copper
Operations
OPERATIONS
OPERATIONS • 2004: Goldcorp: Red Lake Mine & Wharf Mine • 2005: Acquired Wheaton River Minerals & Virginia Gold • 2006: Acquired Canadian Placer Dome assets & Glamis Gold • 2008: Gold Eagle Mines • 2009: El Morro project • 2009: Goldcorp acquired 100% interest in the Camino Rojo gold/silver project in Mexico
GOLD RESERVES
PRODUCTION
GOLD PRODUCED (OUNCES)
REVENUES
EARNINGS
FINANCIAL RISKS • The Company closely monitors its financial assets and does not have any significant concentration of credit risk. • The Company ensures that sufficient committed loan facilities exist to meet its short-term business requirements • The Company is exposed to currency risk • The Company monitors its exposure to interest rates • Price-Risk: May hedge up to 50% of its base metal sales volume to manage its exposure to fluctuations in base metal prices
FINANCIAL CONTRACTS • Sells its products exclusively to large international financial institutions • Enters into contracts and performs business activities that give rise to commitments for future minimum payments. • May hedge up to 50% of its base metal sales volume over the next fifteen months to manage its exposure to fluctuations in base metal prices.
Growth & Development • Peñasquito is one of the largest projects and one of the largest new mines in the world that will be the primary driver of growth for Goldcorp in the next 5 years • Other important projects include Red Lake, Musselwhite, and Pueblo Viejo
STRATEGIC OBJECTIVES Goldcorp is focused on delivering long-term value and superior returns to its shareholders. Its goal is to be a low cost gold producer with geographic diversification and low political risk operating in a responsible manner with our neighbours and the environment.
STRATEGY FOR GROWTH • Strong focus on organic growth • No gold hedging • Low cost gold producer • Maintain a strong balance sheet • Focus on low political risk jurisdictions • $110 million exploration budget for 2009
FACTS • Goldcorp is the 2009 recipient of the Viola R. Mac. Millan Award for company or mine development • Goldcorp announces 6 th consecutive annual increase in gold reserves • It completes acquisition of 70% interest in EI Morro project • Delivers record 2009 gold production; peer leading 5 -year growth profile extended • Its cash flow increases 35% in the 2009 3 rd quarter • Goldcorp has grown from a strong intermediate player to one of the top senior gold producers in the world
MANAGEMENT Charles Jeannes • Charles A. Jeannes was appointed President and CEO of Goldcorp effective 1 st January 2009 • Previously Executive Vice President from 2006 -08 • From 1999 until the completion of the acquisition of Glamis, he was Executive Vice President, Administration, General Counsel and Secretary of Glamis
MANAGEMENT Ian Telfer (Chairman) - President and CEO of Goldcorp from 2005 until its merger with Glamis Gold in 2006 - CEO & President of Wheaton River from 2002 until merger in 2005 - Over 20 years experience in mining industry - Raised over $1 billion for mining exploration and development around the world
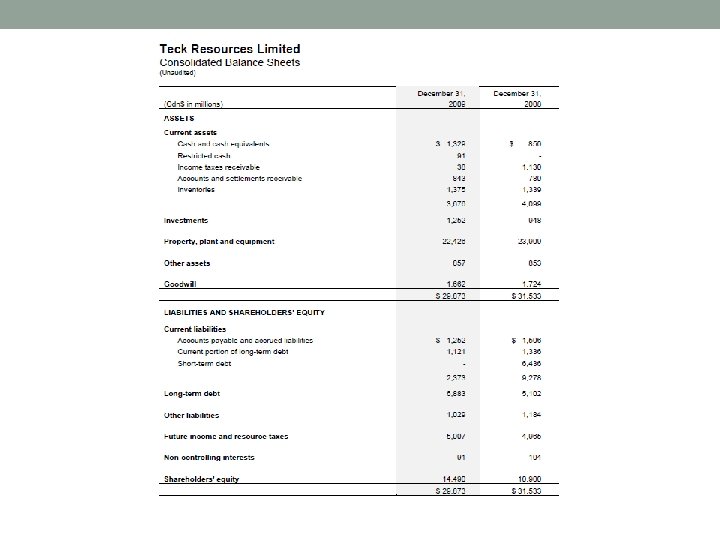
FINANCIAL STATEMENTS ANALYSIS • Balance sheets • Cash flow statement • Income statement
FINANCIAL OVERVIEW
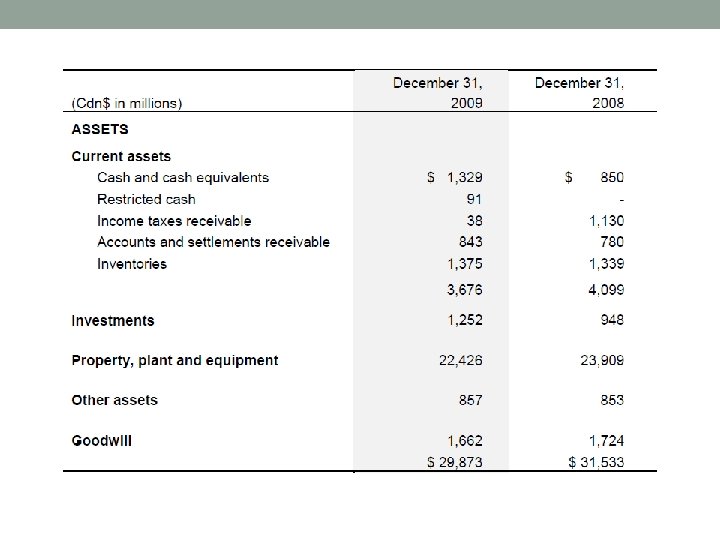
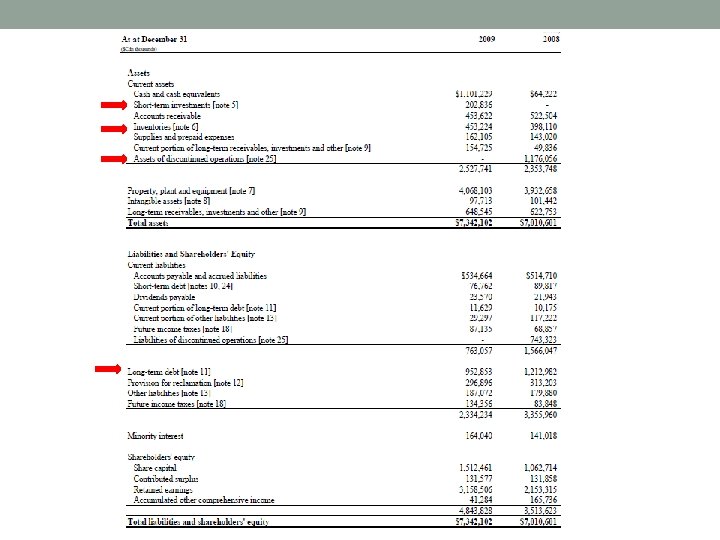
Balance sheet Year end 2009 ASSETS
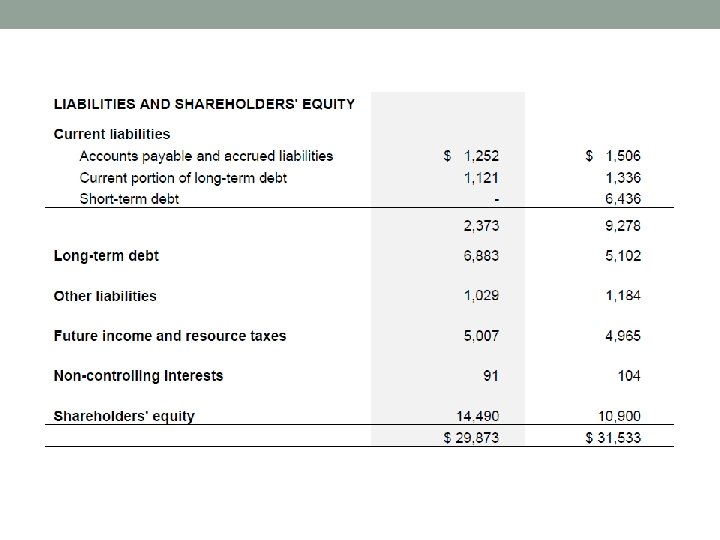
LIABILITIES 2009 2008
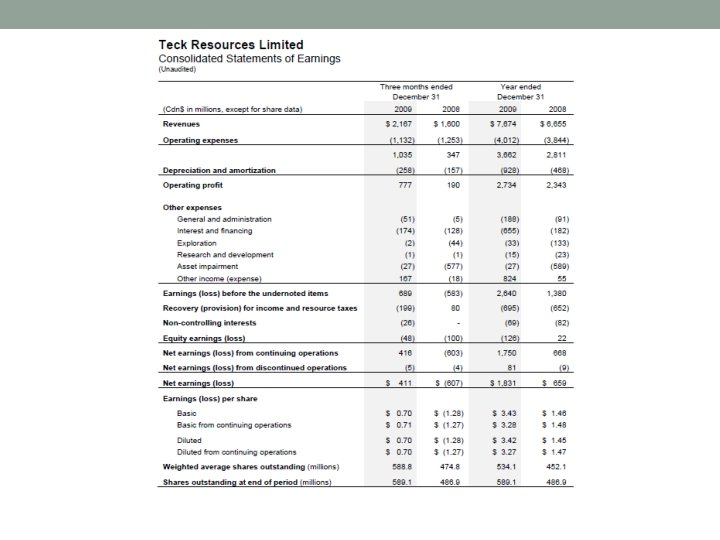
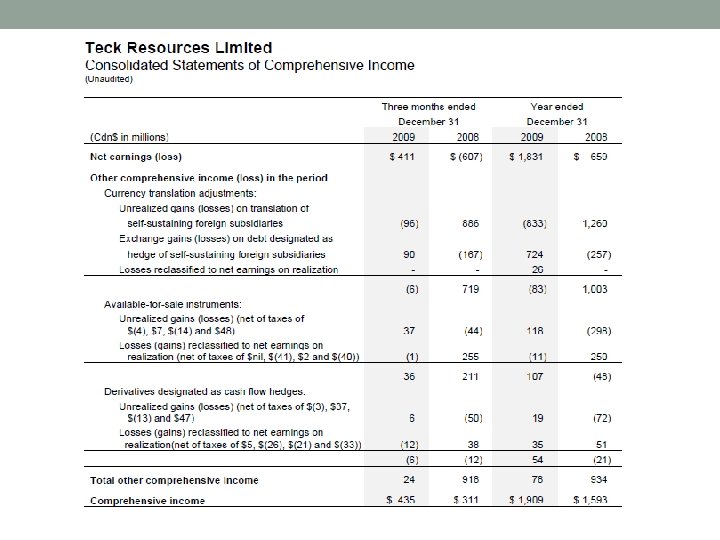
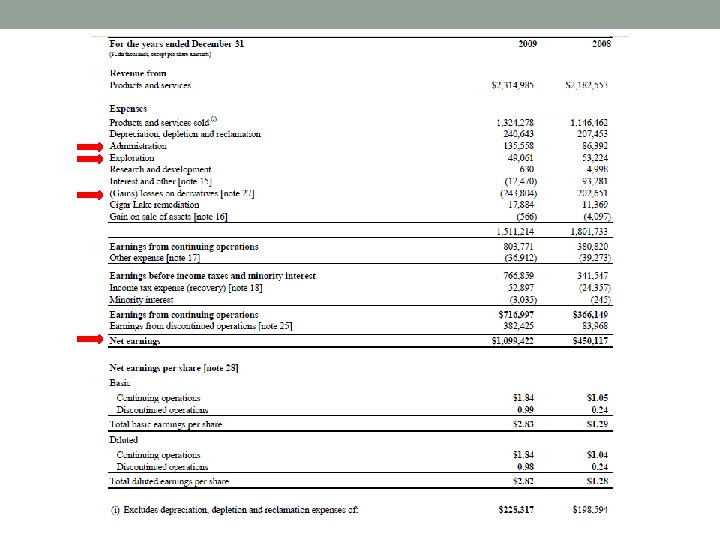
Income statement Year end 2009
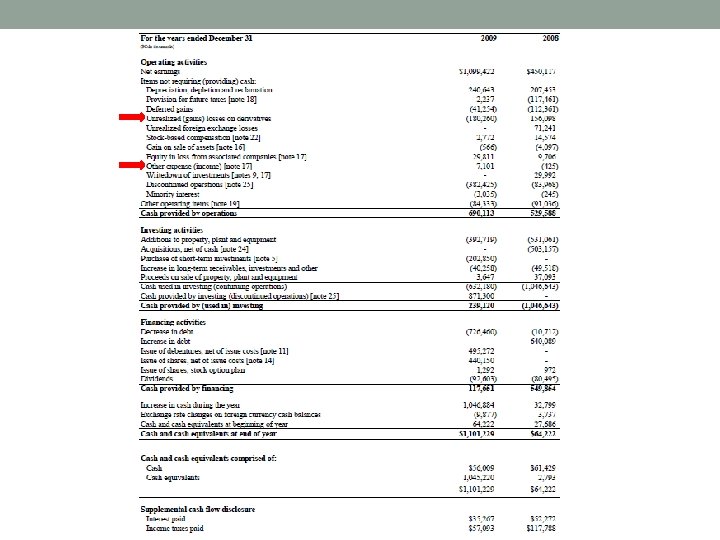
Cash flow statement Year end 2009
CASH FLOW-OPERATING ACTIVITIES
CASH FLOW-INVESTING ACTIVITIES
CASH FLOW-FINANCING ACTIVITIES
RECOMMENDATION BUY • Increasing gold prices • Growth in Gold. Corp’s operations • Increase in gold production