Canadian Oil Gas Trusts Group 4 Owen Hosford


 REIT 38 Issuers (32.")


")
")
")
")


 • Oil Sands: Combination of clay, sand, water, and bitumen")


 since 2005 – Former President until 1995 -2008")


")


 • market capitalization of")


 Daily average (bbl/d) Total (million")


 • He currently")
 • He also represents Canadian Oil")
 • He also represents Canadian Oil")


- Slides: 128
Canadian Oil & Gas Trusts Group 4 Owen Hosford Nick Morneau Parry Pasricha Angela Meng
Agenda • Canadian Oil & Gas Trusts • Companies: Canadian Oil Sands Trust
INCOME TRUSTS
What Are Income Trusts? • Corporate Trust Structures: - Entities that direct royalties or income to trust holders - Payments from interest, royalty or lease • Benefits: - Legally bypass corporate taxation (eliminates double tax) - Allows for larger distributions • Analysis: - Attractive for their high yields - Interest rate sensitive; inverse relationship between interest rates and share price
Income Trusts
Evolution of Income Trusts • Emerged in 1987 as ‘Royalty Trusts’ • Created to spur growth in Canada’s energy sector • Four main Trust types - REITS - Business Trusts - Energy Trusts - Power & Pipeline • By 2006, it had become a $200 billion industry
October 31 st 2006 • “Tax Fairness Plan” applied to all trusts by Dec 31 st 2010 • Reduce tax avoidance & tax burden and increase Canadian government revenues - Loss of $300 federal taxes annually - Loss of $300 provincial taxes annually • Income Trust index plunged 20%
Income Trusts Today 12 Issuers (17. 5 Billion Market Cap) REIT 38 Issuers (32. 1 Billion Market Cap) 92 Issuers (33. 6 Billion Market Cap) 13 Issuers (54. 2 Billion Market Cap) Energy Business Power & Pipeline
Implications of Conversion Does it affect all Income Trusts? • Real estate income trusts and mutual fund income trusts are not affected. Will the Payouts change? • Payouts to shareholders will be taxed at a 34% rate (31. 5% starting in 2011) at the corporate level. • Corporations will reduce their payout to account for the corporate taxes. Will the prices of these securities dip? • Current prices have the cost of the conversion built into it. Benefits of the conversion? • Flexibility of issuing shares more easily – like a corporation.
ENERGY TRUSTS
Energy Trusts • Set up as a royalty trusts; royalties from production are distributed as dividends • Profits are not taxed at the corporate level • Key Driver is the Prices of Oil and natural gas
S&P 500 vs Capped Energy Trust (1 yr)
S&P 500 vs Capped Energy Trust (5 yr)
Income Trust vs Energy Trust (1 -yr)
Income Trust vs Energy Trust (5 -yr)
OIL
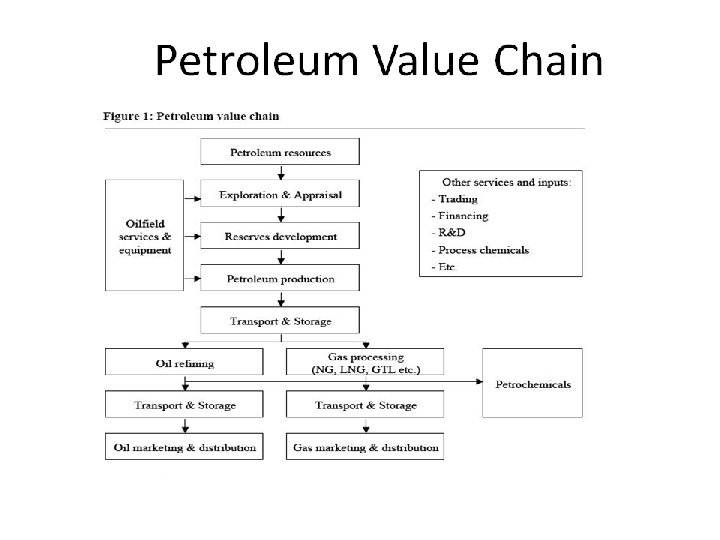
Petroleum Value Chain • Upstream Exploration and Production • Midstream Pipeline, Transportation, Storage • Downstream Refining, Marketing, Retailing
Oil Price Trend Price of Oil Dow Jones vs. Oil Price
Oil Price Trend
Crude Oil Uses • Bitumen for roads • Roofing • Fuel for ships and factories • Lubricating oils, waxes, polishes • Diesel fuel • Jet fuel • Petrol • Chemicals • Liquefied petroleum gas • Others include plastics (Ethylene and propylene), …
Proven Oil Reserves
Canadian Oil & Gas
Canadian Oil & Gas • Main production occurs in Alberta ; Primarily in upstream operations Cum. Rank - 45% conventional crude oil - 49. 5% bitumen from oil sands Suncor 159 21 24. 30 65. 17 45. 59 2 Canadian Natural Resources 275 29 9. 67 39. 13 37. 24 3 Encana 279 30 11. 11 33. 83 25. 35 4 Husky 304 34 14. 28 25. 08 21. 92 5 Enbridge 329 36 11. 89 26. 87 17. 07 6 Cenovus Energy 442 42 10. 14 20. 55 18. 42 7 Talisman Energy 557 48 6. 19 22. 53 18. 71 8 Nexen 611 54 5. 54 21. 84 11. 89 - 5. 5% natural gas wells • 1. 7 M b/d (65%) , was exported to USA Forbes Rank 1 • Seventh largest oil producing country • In 2009, it produced an average of 2. 75 M b/d Name Rank Forbes among Sales Assets Market oil (bns USD Value compa SD) ) (bns USD nies )
Canadian Conventional Oil Reserves • Six billion barrels of oil located outside the oil sands - Alberta 39% - Newfoundland 28% (offshore ) - Saskatchewan 27% • Offshore Newfoundland Labrador transport crude oil to markets by tanker. • In Western Canada, oil is transported by pipelines from the production facility to refineries where it is upgraded into gasoline, heating oil and jet fuel.
Conventional Oil & Extraction • Refers to light, medium and heavy hydrocarbons • Light oil can flow naturally to the surface - extracted from the ground using pumpjacks. • Pumpjacks are also used to remove heavy oil from the ground. • Cheaper to produce. $5 -10/barrel
UNCONVENTIONAL OIL
Oil Sands (Heavy Oil) • Oil Sands: Combination of clay, sand, water, and bitumen • Extracting Bitumen from tar sands is more complex than conventional oil recovery. • Strip mining or open pit techniques, or the oil is extracted by underground heating with additional upgrading.
Separating the Bitumen • Oil sands recovery processes include • extraction and separation systems • Separate bitumen from the clay, sand, and water that make up the tar sands. • Bitumen also requires additional upgrading • before it can be refined. • Dilution with lighter hydrocarbons to make it transportable. • 75% bitumen recovery. Process is water and energy intensive. • Additional $20/barrel to upgrade the bitumen
Methods of Extraction – Strip Mining • Surface Mining: Approximately $27/barrel (includes primary bitumen extraction) • Just 10 - 20 per cent of the oil sands are recoverable through open-pit mining. • Use large hydraulic and electrically powered shovels to dig up tar sands and load them into trucks that can carry up to 320 tons of tar sands per load. • 2 tons of oil sands = 1 barrel of oil
In Situ Methods of Extraction • In situ techniques apply heat or solvents to heavy oil reservoirs beneath the earth. . Bringing it to the surface through pipes • Ones which work best in the oil sands use heat. Steam injection has been the favoured method • In situ methods are more expensive; approx $36 -$40/ barrel to break even • These techniques include; -steam injection (Cyclic Steam Stimulation) - solvent injection - firefloods • Some of these extraction methods require large amounts of both water and energy (for heating and pumping). • SAGD – Steam Assisted Gravity Drainage
Oil Sand Projects
Future for Oil in Canada
NATURAL GAS
Natural Gas • Natural gas when burned it gives off energy with few emissions. • Found in deposits that are 1 to 2 miles below the earth's crust. • Consists primarily of methane, but includes ethane, propane, butane and pentane • Before natural gas can be used as a fuel, it must undergo processing to remove almost all materials other than methane We require energy constantly, to heat our homes, cook our food, and generate electricity. It is this need for energy that has elevated natural gas to such a level of importance in our society, and in our lives.
Uses for Natural Gas Natural gas has many uses, residentially, commercially, and industrially Furnaces Water Heaters Stoves/Ranges Transportation Heavy-duty service vehicles Input to manufacture pulp and paper, metals, chemicals, stone, clay, glass • Process certain foods. • Treat waste materials • • • There are over 120, 000 natural gas vehicles operating on American roads.
Natural Gas Reserves
Natural Gas Production
Natural Gas Price Trend
Types Natural Gas
Unconventional Forms of Natural Gas • Hydraulic fracturing is the process of pumping a fluid or a gas down a well, many hundreds or thousands of metres below ground, • The pressure this creates causes the surrounding rock to crack, or fracture • When the pumping pressure is relieved, the water disperses leaving a thin layer of the sand to prop open the cracks • This layer acts as a conduit to allow the natural gas to escape from tight formations and flow to the well so that it can be recovered
Canadian Natural Gas & Outlook • Canada is the world’s third largest producer; average annual production of 6. 4 trillion cubic feet • Producing regions are concentrated primarily in the western provinces (B. C. , Alberta and Saskatchewan) - offshore fields in Canada’s Maritimes - minor production in Ontario and Northern Canada.
TRANSPORTATION
Transportation • Pipelines are necessary to transport raw materials from their source to refineries and gas processing facilities and then to market. • Pipelines provide a safe, economical and constant flow of crude oil, natural gas and petroleum products • Cheaper than shipping and driving • 580, 000 km of pipeline in Canada • 2. 7 million barrels of crude oil per day travel through Canada’s crude oil pipeline network. • 15. 1 billion cubic feet of natural gas per day travel through Canada’s natural gas pipeline network. • Revenues are generated from various type of usage contracts, example “take-or-pay” contracts
Transportation • Pipeline costs depend on factors such as: -type of pipe -type of coating -length of pipeline -diameter of pipe -Environment and -terrain • Cost calculations based on cost per pipe diameter per distance to estimate pipeline project costs. • For example, $1, 000 per millimetre diameter per kilometre. A 50 -kilometre system consisting of 50 millimetre pipe may be roughed out as: • 50 millimetres x 50 kilometres x $1, 000 per kilometre = $2. 5 million/km
Transportation • Pipeline success fundamentally dependent on oil demand/price • Key Factors: -Human resources intensive -Capital intensive -Highly regulated • Short Term Outlook: - pipeline growth to the west coast. Serve Asian demand • Long Term Outlook: - decline as alternative energies are sought
Company Snapshot
18 -Month Total Return
1 year Vs. S&P Capped Energy Trusts
5 year Vs. S&P Capped Energy Trusts
Dividend History Year Annual Dividend Declared 2010 1. 56 at current rate 2009 2. 04 2008 4. 08 2007 4. 08
Company Overview • Long Term Debt $2. 5 Billion • 2010 Production averaged 164, 087 boe per day 60 percent to liquids and 40 percent to natural gas • 2010 Development Budget $0. 9 – $1. 0 billion • Forecast 2011 Production 172, 000 – 177, 000 boe/d • 2011 Development Budget $1. 0 – $1. 2 billion • #1 Producer of Light & Medium oil in Western Canada • 7 million acres of land base
Production Current Production: 164087 Boe/d
Reserves Proven + Probable Reserves: 687 m. Boe Reserve Life: 11. 1 years
Relative Market Position
Sector Decline
Areas of Operation
Development Cycle
Project Economics Cardium Amaranth Colorado Carbonates Recoverable Resource 400 -800 mmboe 100 -180 mmboe 75 -100 mmboe 100 -250 mmboe Operated wells 24 56 52 16 Drilled wells 42 77 69 28 90 -110 80 -110 65 -80 30 -40 $16 -18/boe $15 -20/boe $21 -23 k/boe/d $28 -30 k/boe/d $25 -28 k/boe/d 2011 Expected wells Economics/well F&D Cap Eff IRR NPV (10%discount rate) $15 -17/boe $25 -27 k/boe/d $15 -17/boe 40 -60% 60 -80% 70 -90% $2. 2 -2. 7 mm $1. 2 -1. 5 mm $2. 1 -2. 4 mm $3. 5 -4. 2 mm
Near-Term Expansion
Finding & Development Costs
Drilling Technology
Cost Efficiencies
Operational Strategy • • • Capital budget of approximately $800 million necessary to maintain current production levels Focus funds to increase pace of development in key play areas – anticipate $200 to $400 million for organic growth Timing for conversion at year-end 2010 Set dividend with objective to remain within funds flow for sustaining capital, growth capital and dividend Guidance for 2011 has been set at $1. 0 - $1. 2 billion capital and average daily production of 172, 000 – 177, 000
Financial Strategy • • Focus on oil upside Protect capex vs. distribution Countercyclical foreign exchange Balance sheet strength • Current Hedges • FX @ $1. 06 to match 2011 debt obligation • 35% of 2011 production hedged between $80 - $92
• William E. Andrew (CEO) since 2005 – Former President until 1995 -2008 – On the Board of Directors • Professional Engineer with 35 years of oil and natural gas industry experience & 18 years with Penn West. • Education – Engineering Diploma (UPEI) – BEng (UNS) Murray R. Nunns President & COO Previously on the BOD BEng (UWO) Senior Vice President & CFO 25 years of oil and natural gas industry and public accounting experience. Joined Penn West in 1994 Professional Geologist with 30 years of oil and gas experience Education Todd Takeyasu Education BBA (University of Lethbridge) CA
Q 3 Summary • Funds flow in the third quarter was $267 million compared to $349 million in the third quarter of 2009. The decline was primarily due to lower realized risk management gains. • Net loss was $25 million compared to a net income of $7 million in the third quarter of 2009. The decrease in net income in 2010 was mainly due to lower realized risk management gains and unrealized foreign exchange gains. • Netback was $23. 13 per boe compared to $25. 91 per boe in the third quarter of 2009. The decline was primarily due to lower realized risk management gains.
Q 3 Summary
Consolidated Balance Sheet
Q 3 Income Statement
Cash Flows Statement
Profitability vs. Oil Price 2009 2008 % Change
Business Risks • • • Commodity Price Risk Foreign Currency Rate Risk Credit Risk Interest Rate Risk Liquidity Risk Environmental & Climate Change Risk
Sensitivity Analysis
Recommendation HOLD
Company Snapshot
1 year Vs. S&P Capped Energy Trusts
5 year Vs. S&P Capped Energy Trusts
Overview • • established in 1997, owns and operates energy infrastructure in in western Canada, the United Kingdom, Germany and Ireland Long lived assets located near demand. Long term risk reducing contracts. Focused on organic growth but open to strategic acquisitions.
Cash Distribution Growth
Growth
Fundamentals
Revenues & Contracts Fee Based Contracts - a fixed fee is tied to usage. - volume risk. Commodity Based Contracts -Uses a variable price based on the commodity sale value less most costs. - Used for profit sharing. -Volume and commodity risks. Cost of Service Contracts - Most stable - Provides for recovery of operating costs and a fixed capital charge. - Minimal volume risk and no commodity price exposure
Oil Sands Play Forecast revenues from expansion represent 60% of cash flow generated in 2009. Company expects oil sand segment to make up 50% of revenues in the future.
Corridor • Transports diluted bitumen • Governed by Corridor firm services agreement • Long-term ship-or-pay contract • Modified cost of service contract • Extends to 2029. • Covers costs and a return on equity, which is linked to treasury bond yields. Cold Lake (85% ownership) • • Transports diluted bitumen Governed by Cold Lake transportation services agreement • Cost of service contract • Defined fee linked with volume transported • Minimum ship or pay of 27. 8 million until Dec. 2011 • After 2011 Shippers have option to uses alternative Polaris • Originally part of corridor pipeline. • Connecting pipeline to Kearl and Sunrise oil sands projects. • 20+ year cost of service contract for shipping a committed 90, 000 b/d. Cold Lake Contract Structure
Natural Gas Extraction Three facilities: • • • Cochrane Empress V (50% 0 wnership) Empress II Recovers Propane, Butane, Propane-plus, and ethane. • Largest Ethane producer in Canada. All three types of contracts in use with an average of 9 years remaining. Strong customer base
Conventional Oil Pipelines • 3800 km of pipelines linking 143 producers. • Short term contracts with fixed tolling and no volume commitments. • Three major segments • Oil gathering • Hardisty south transmission • Midstream Marketing Bow River • 128 km of new pipeline complete at the end of 2009. • Ships crude oil from Hardisty to refining markets in the US, under a 7 year take or pay agreement.
Bulk Liquid Storage Segment • • • Simon Storage wholly owned subsidiary. Europe based storage system with capacity to store 8 million barrels. Fee based revenue structure. Revenue breakdown • • 60% from lease arrangements 40% from throughput and services Many contracts expire in 5 years or less Historically stable customer base.
Management David Fesyk - Director, President and CEO • Held position since 1997. • Bachelor of Science from Arizona State University. • Master of Business Administration from University of Calgary. • Held executive positions in multiple Oil and gas related companies. • Also worked for multiple geological consulting firms.
William van Yzerloo Chief Financial Officer • Held position since April 2004. • • Jeffery Marchant VP Oil Sands Development Paul Murphy VP NGL Extraction • With company since 1997. • Held position since 2004. • Appointed VP Corporate planning in 2006. VP Corporate development 2003 -2005. • Appointed VP OSD 2007. 17 years of executive • Bachelor of Chemical experience. Engineering from University of Alberta. Certified general accountant since 1986. • Professional Engineering designation and member of Attended the University of APEGGA. Idaho Energy Industry Leadership program. • Over 25 years natural gas exploration, processing, extraction and transmission. • Held multiple management positions relating to gas transmission and processing. • Bachelor of Science in Geology from U of Alberta. • Member of APPEGGA.
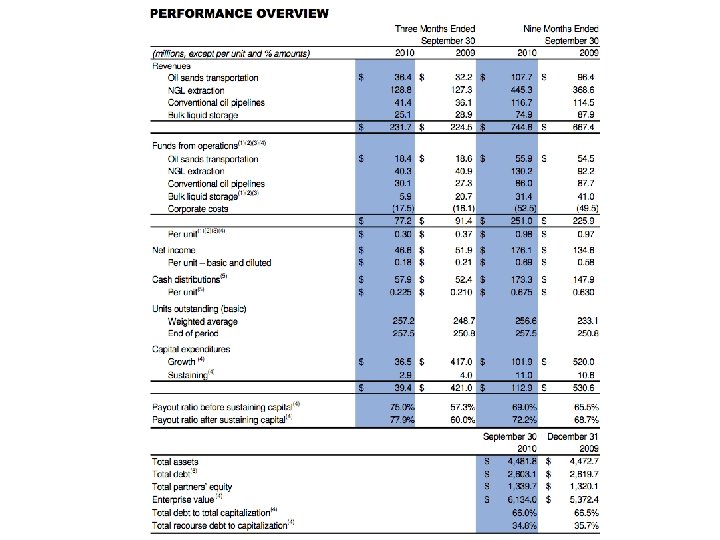
Performance
Annual Balance Sheet
Quarterly Balance Sheet
Annual Income Statement
Quarterly Income Statement 2008 NI per unit: $0. 66
Annual Cash Flow Statement
Quarterly Cash Flow Statement
Recommendation BUY
Company Snapshot
UNIT TRADING ACTIVITY • Toronto Stock Exchange (symbol COS. UN) • market capitalization of approximately $12 billion with 484 million Units outstanding
Distribution and Returns
1 Year Movement
5 Years Movement
Moving Average
COS. UN vs. S&P/TSX Energy Trust
COS. UN vs. Price of Crude Oil
Background • Generates income from a 36. 74% share of Syncrude oil operation in the Alberta – Main operator of Syncrude Oil • Organized as an Open-Ended Investment Trust • Acts as a middleman between oil producers and pipeline operators – Takes possession of the oil and markets it to pipelines
• History: Syncrude Oil – Syncrude was incorporated in December 1964 – Site preparations at Mildred Lake, AB • Product: – Syncrude currently produces a single, high-quality light synthetic crude oil – The final product is sent by pipeline to three Edmonton area refineries and to pipeline terminals which ship it to refineries in Canada and the United States – Each Syncrude Participant receives its share of production in kind and is responsible for the subsequent marketing • Ownership
Oil Sands Lease Map
Production Syncrude Canadian Oil Sands, net* Total (million bbls) Daily average (bbl/d) Total (million bbls) Daily Average (bbl/d) YTD 2010 85. 6 281, 600 31. 5 103, 500 YTD 2009 102. 2 280, 000 37. 5 102, 900 YTD 2008 105. 8 289, 100 38. 9 106, 200 based on a 36. 74% Syncrude working interest.
Marketing • Markets its synthetic crude oil production to refineries in both Canada and the United States • Responsible for the transportation beyond Edmonton and delivery directly to the refinery • customers take delivery in Canada and are responsible for the transportation costs
Expansion Plan • Unlock production potential in the existing upgrading facility • Build bitumen supply that result in volume growth from 2015 to 2020 • Capitalize on investments already made in the existing plant • Provide Syncrude with operational flexibility and Canadian Oil Sands with the ability to market multiple
Management Marcel R. Coutu - President and Chief Executive Officer • Wholly owned Canadian Oil Sands Limited • Chairman of the Board of Syncrude Canada Ltd. and chairs the Syncrude Joint Venture CEO and Management Committees • H. B. Sc. in geology from the University of Waterloo (1976), an MBA from the University of Western Ontario (1980)
Donald J. Lowry - Chairman of the Board (Oct 1, 2009) • He currently is the President and Chief Executive Officer of EPCOR Utilities Inc. • B. Comm. (Hons) and MBA from the University of Manitoba • Graduate of the Harvard Advanced Management Program and the Banff School of Management.
Ryan M. Kubik - Chief Financial Officer(April, 2007) • He also represents Canadian Oil Sands as Chair of the Syncrude Audit and Business Controls Sub-Committee. • He was in senior finance positions with En. Cana Corporation, Pan. Canadian Energy and Pricewaterhouse. Coopers • CA and CFA designations and a Bachelor of Commerce degree from the University of Calgary.
Trevor R. Roberts - Chief Operations Officer (2005) • He also represents Canadian Oil Sands on the Syncrude Management Committee and Chairs the Syncrude Growth Development Planning and Major Projects Sub-Committee. • He was Senior Vice President, Operations with Suncor Energy • Bachelor of Chemical Engineering degree from the University of Waterloo
Financial Strategy • Maintain a strong financial position. • Mitigate impact of trust taxation through tax pools, anticipated to total $2 billion by the end of 2010. • Convert to a corporation on or about December 31, 2010. • Further develop plans to add bitumen supply from Aurora South and debottleneck the upgrader.
Sensitivity Analysis
Third Quarter Highlights 2010
SUMMARY OF QUARTERLY RESULTS
Annual Balance Sheet
Unitholder Equity
Quarterly Cash Flow Statement
Recommendation BUY