Process Simulation Software for Natural Gas and Oil


 for non-hydrate condition of Khanchey field-plant Actual 732")

.")

")
 and calculating solubility of methane in DEG at")

 and calculating water content in methane, g/m 3")


- Slides: 23
Process Simulation Software for Natural Gas and Oil Engineering Version 2. 3 MOST RELIABLE COMPUTATION DATA
CONTENTS q Gas. Cond. Oil - Simulation q Examples of Gas. Cond. Oil-Flowsheets q Comparison of calculating data, obtaining by PRO-2, HYSYS and Gas. Cond. Oil q Literature about Cas. Cond. Oil q Overall Conclusion q Contacts
Gas. Cond. Oil - Simulation: þ- composition, phase behavior and properties of reservoir natural gas and oil þ- field transportation and gathering of oil and gas þ- field-separation, glycol-absorption and oil-absorption processes þ- reconcentration of glycols and methanol þ- fractional distillation þ- low-temperature processing þ- ice- hydrate formation conditions and inhibitors expenditure
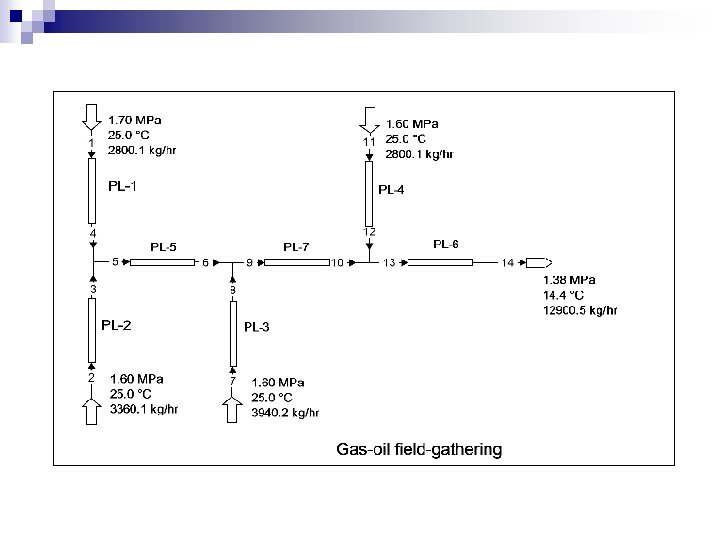
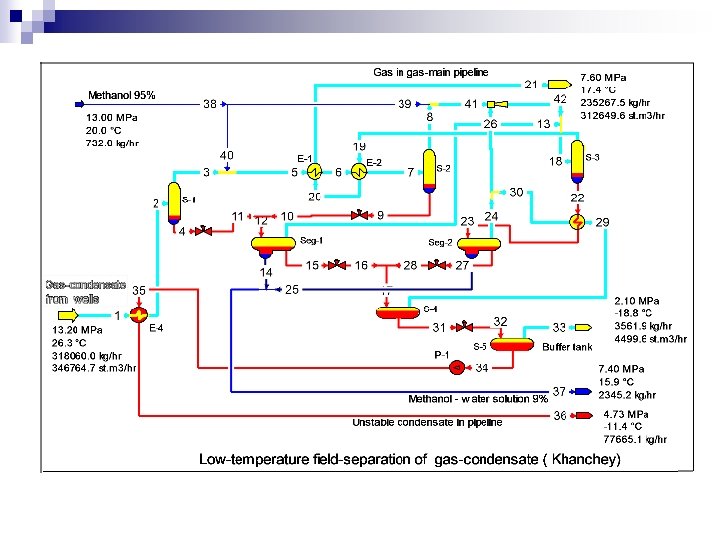
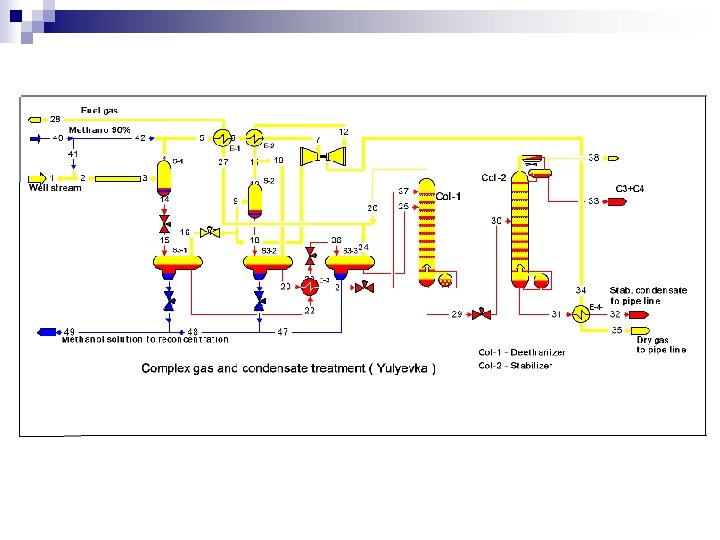
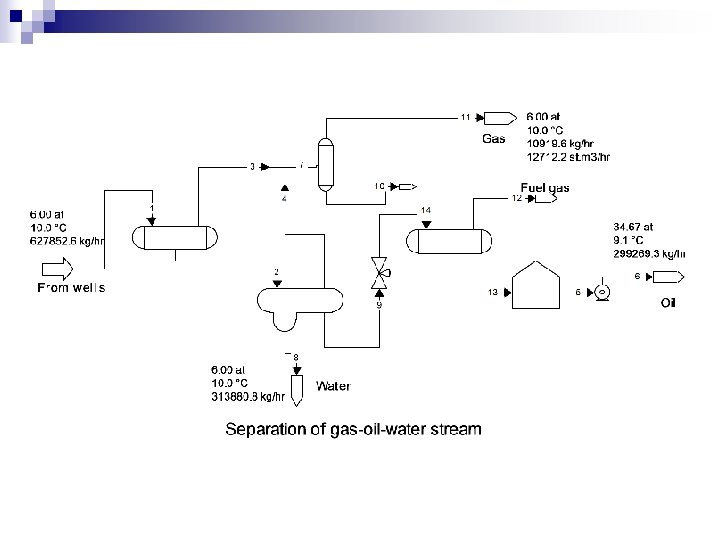
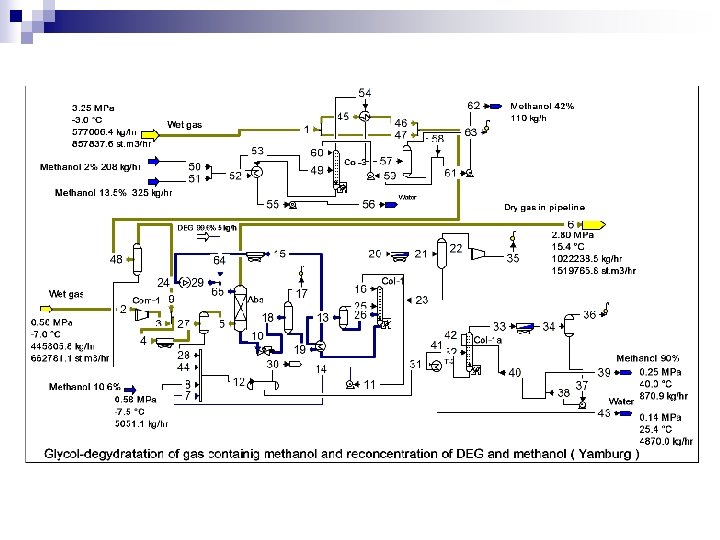
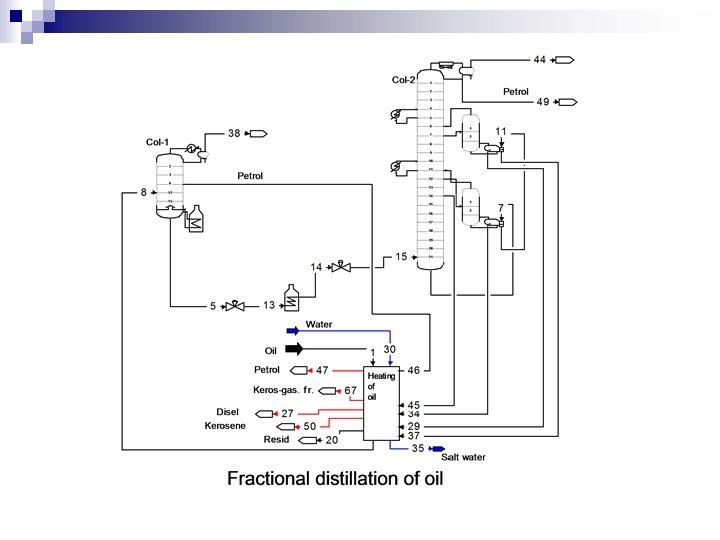
Examples of Gas. Cond. Oil-Flowsheets
Comparison of calculating data, obtaining by PRO-2, HYSYS and Gas. Cond. Oil 1. Field-separation of gas-condensate (Khanchey field-plant). 2. Actual (measurements of Tyumen. NIIgiprogaz) and calculating data. Table 1. 1. Actual and calculating temperature in apparatus. Apparatus t act. (hourly average data, 27. 05. 04) PRO-2 SRK-MPR 1 HYSYS PR-SV 1 GCO PR-Gas Inst. Separator S-3 -32. 0 -30. 52 -30. 5 Segregator S 3 -1 20. 9 19. 7 19. 6 19. 5 Separator S-4 -9. 9 -12. 6 -13. 7 -13. 0 Buffer tank S-5 -19. 2 -18. 3 -19. 5 -18. 6 Notes: 1 - These thermodynamic models in PRO-2 and HYSYS given least deviation from actual data. 2 – Because of absence in PRO-2 and HYSYS of gas-ejection models, temperature in separator S-3 was accepted equal to temperature, calculated by means of Gas. Cond. Oil.
Table 1. 2. Actual and calculating product-rates. Plant production Factual data (hourly average data, 27. 05. 04) PRO-2 SRKMPR HYSYS PR-SV 1 GCO PR-Gas Inst GCO 2 PR-Gas Inst GCO 3 PR-Gas Inst Gas in gas-main pipeline, MSTD m 3/h 314. 27 312. 23 312. 28 312. 65 312. 74 314. 28 Unstable condensate, ton/h 76. 40 78. 23 77. 71 77. 67 77. 45 76. 36 2. 7 63. 9 5. 6 66. 31 6. 0 84. 5 6. 1 85. 8 Methanol concentration, % (weight): In segregator Seg 3 -1 4. 0 In segregator Seg 3 -2 85. 3 Notes: 1 - Peng-Robinson equation of state (modif. Strijek-Vera). PR and KD (Kabadi-Danner) models give respectively 53% and 20%. 2 - Equilibrium model + liquid entrainment from separators (3 cm 3/std. m 3). 3 - With application of a nonequilibria factor + liquid entrainment.
Table 1. 3. Actual and calculating content of light hydrocarbons in commercial condensate Components kg/h actual PRO-2 SRK-MPR HYSYS PR-SV GCO PR-Gas Inst 1 kg/hr Devia tion, % kg/hr Devia tion, % Methane 1677 2220 32. 4 2170 29. 4 2154 28. 4 1794 7. 0 Ethane 3420 5424 58. 6 5218 52. 6 5325 55. 7 3453 1. 0 Propane 7324 6625 -9. 5 6750 -7. 8 6817 -6. 9 7190 -1. 8 i-Butane 2874 2734 -4. 9 2671 -7. 1 2653 -7. 7 2827 -1. 6 n-Butane 7173 6637 -7. 5 6650 -7. 3 6626 -7. 6 7013 -2. 2 i-Pentane 3323 3263 -1. 8 3222 -3. 0 3198 -3. 8 3314 -0. 3 n-Pentane 4505 4441 -1. 4 4295 -4. 7 4303 -4. 5 4432 -1. 6 Note: 1 - With application of a nonequilibria factor
Table 1. 4. Methanol-flow rate (kg/h) for non-hydrate condition of Khanchey field-plant Actual 732 Theoretical HYSYS GCO 1250 630
2. Experimental and calculating solubility of hydrocarbons, water, methanol and glycols. Table 2. 1. Experimental (Katz, 1964) and calculating solubility of methane in water at 10 MPa T, C % (mole) methane in water Deviation , % Exp HYSYS A^E PRO-2 SRKMPR 1 GCO PRGas Inst HYSYS A^E PRO-2 SRKMPR GCO PR Gas Inst 25 0. 18 0. 29 0. 000025 0. 183 +61. 1 -100. 0 -1. 7 40 0. 15 0. 23 0. 000086 0. 145 +53. 3 -99. 9 -3. 3 80 0. 12 0. 17 0. 000670 0. 119 +41. 7 -99. 4 -0. 8 100 0. 12 0. 17 0. 001600 0. 128 +41. 7 -98. 6 +6. 7 Note: 1 - Models PR-SV, PR, PRTwu in HYSYS give at 25 C respectively 0. 0%, 0. 00003 % and 0. 000035%; Models PR-HV and PR in PRO-2 – 17. 7% and 0. 00003%.
Table 2. 2. Methanol content of natural gas ( 95 mole % methane ). T, C -20 20 P, MPa % (mole) methanol in gas Literary HYSY data S (Istomin, A^E 1987) Deviation, % PRO-2 GCO SPK-SS PR-Gas Inst HYSYS A^E 1 PRO-2 SPKSS 2 GCO PR- Gas Inst 4. 9 0. 052 0. 046 0. 050 0. 052 -11. 5 -3. 8 0. 0 10 0. 093 0. 074 0. 109 0. 081 -20. 4 +17. 2 -12. 9 14. 7 0. 150 0. 131 0. 245 0. 136 -12. 7 +63. 3 -9. 3 20 0. 210 0. 239 0. 452 0. 200 +13. 8 +115. 2 -4. 8 4. 9 0. 48 0. 511 0. 487 -2. 0 +4. 3 -0. 6 10 0. 46 0. 52 0. 579 0. 475 +13. 0 +25. 9 +3. 3 14. 7 0. 53 0. 66 0. 850 0. 577 +24. 5 +60. 4 +8. 9 20 0. 60 0. 90 1. 280 0. 726 +50. 0 +113. 3 +21. 0 Notes: 1 - model PR-SV give deviation from +3. 8% to 226%, KD from -6. 1% to +103. 3%, PR from +3. 8% to +226. 2%, SRK-Twu, PR-Twu, TST from +16% to +220%; 2 – model SRK (modif. Panad-Reid) give deviation from – 11. 0% to – 44. 3%, PR from – 3. 8% to +115. 2%.
Table 2. 3. Solubility of methanol in unstable condensate, % mass. (by concentration of methanol in water 50% and molecular weight of unstable condensate 90). T, C Literary HYSYS data (PR-SV) (Istomin, 1987) PRO-2 (SRKSS) GCO PR- Gas Inst Deviation, % HYSYS (PR-SV)1 PRO-2 (SRK-SS)2 GCO PR- Gas Inst -20 0. 22 0. 76 0. 59 0. 24 +245. 5 +168. 2 +9. 1 -10 0. 41 0. 99 0. 77 0. 38 +141. 5 +87. 8 -7. 3 0 0. 63 1. 25 0. 99 0. 57 +98. 4 +57. 1 -9. 5 10 1. 54 0. 99 0. 85 +54. 0 -15. 0 Notes: 1 - model PR give deviation from +96 % to +450 %, KD from +290 % to +1000 %, PR-Twu, SRK-Twu, TST, CEOS/A^E – above +370%; 2 - model SRK-MPR give deviation to – 100 %, PR-MPR from +300 % to +700 %, PR - to +1100 %.
Table 2. 4. Solubility of water in liquid hydrocarbons System T, C % (mole) of water in hydrocarbon phase Experim. HYSYS PRO-2 (Griswold, KD SRK 1942) SS Wateroctane Deviation, % GCO PR- Gas Inst HYSYS KD 1 PRO-2 SRKSS 2 GCO PR- Gas Inst 10 0. 056 0. 022 0. 031 0. 055 -60. 7 -44. 6 -17. 8 37. 8 0. 2 0. 084 0. 19 -58. 0 -50. 0 -5. 0 Water- 124 heavy oil fraction 189 (M=434) 2. 52 1. 43 2. 8 2. 1 -43. 2 +11. 1 -16. 7 9. 53 5. 8 10. 8 9. 4 -39. 1 +13. 3 -1. 4 Notes: 1 – model PR give deviation from -25. 4% to -60. 7%, PR-SV from – 27. 2% to -66. 1%, PR-Twu, SRK-Twu, TST from – 60% to -90%, CEOS/A^E - up to +1000%; 2 – model SRK (modif. Panad-Reid) give deviation from +12. 7% to – 44. 6%, PR from – 8. 2% to -50. 0%.
Table 2. 5. Experimental (Yokoyama, 1988) and calculating solubility of methane in DEG at t = 25 C. P, MPa % (mole) methane in DEG Exp 3 Deviation, % HYS PRO-2 YS SRK-SS TST GCO PR- Gas Inst HYSYS PRO-2 GCO TST 1 SRK-SS 2 PR- Gas Inst 0, 959 0, 96 3, 4 1, 06 0. 0 +254. 5 +10. 5 5 1, 66 1, 5 5, 4 1, 65 -9. 6 +225. 3 -0. 6 8 2, 48 2, 18 7, 9 2, 42 -12. 1 +218. 5 -2. 4 Notes: 1 – model PR-Twu give deviation from -7% to -18%, SRK-Twu from -12% to -21%, CEOS/A^E from +230% to +250%, PR from +230% to 260%, PR-SV from +450% to +500%, KD from +170% to +200%; 2 – model SRK (modif. Panad-Reid) give deviation from 140% to 170%, PR from – 220% to +260%.
3. Influence of reservoir mineralized water on properties of a field technological medium. Table 3. 1. Experimental (Morrison, 1990) and calculating relative volatility of methanol in water – salt mixture (T = 361 K, P = 0. 101 MPa). 1 Na. Cl Methanol Experimental content in relative water, volatility % (mole) PRO-2 SRKMPR GCO PR-Gas Inst Deviation, % % (PRO-2, (GCO, PR- SRKGas Inst) MPR)2 0 10. 7 6. 8 6. 4 6. 0 -5. 9 -11. 8 2. 9 10. 2 8. 7 15. 0 8. 1 +72. 4 -6. 9 4. 3 10. 0 9. 5 21. 4 8. 9 +125. 3 -6. 3 5. 8 9. 7 10. 7 29. 3 9. 7 +173. 8 -9. 3 7. 1 9. 5 11. 5 37. 1 10. 3 +222. 6 -10. 4 Notes: 1 – Calculation by HYSYS no possible. 2 – SRK-KD, SRK-SS etc. models give greater deviation.
Table 3. 2. Literary (Katz, 1959) and calculating water content in methane, g/m 3 (T= 313 K). P, MPa 1 10 % (weight) Ca. Cl 2 in water Literary data GCO PRGas Inst 0 5, 74 5, 84 201 4, 85 4, 5 0 0, 81 201 0, 68 0, 62 Notes: 1 – Calculation by HYSYS and PRO-2 no possible.
Literature about Cas. Cond. Oil 1. Kalashnikov O. V. , Budnyak S. V. , Ivanov Yu. V Engineering calculating models for technological processes of oil and gas field. 5. Gas. Cond. Oil-system. Ecotechnologies and resource saving, 1996, № 2, p. 50 -51. 2. Kalashnikov O. V. , Ivanov Yu. V. , Budnyak S. V. Adequacy questions of thermalphysic base of HYSYS, PRO-2 and Gas. Cond. Oil. 2. Hydrocarbons, water, methanol, glycols and salts mixtures. Ecotechnologies and resource saving, 2000, № 1, p. 31 -35. ) 3. Besprozvanny A. V. , Kabanov O. P. , Stavitsky V. A. , Zvetkov N. A. , Grizishin D. N. , Tipugin A. A. Perspective of valangin gas treatment (En-Yahin field). Problems of development of Urengoy-complex. M. , Nedra, 2003, p. 143 -149. 4. Kalashnikov O. V. Application of equation of state for natural gas-mineralized water system. Ecotechnologies and resource saving, 2004, № 2, p. 24 -27. 5. Lanchakov G. A. , Stavitsky V. A. , Kabanov O. P. , Zvetkov N. A. , Abdullaev R. V. , Tipugin A. A. Optimization of valangin reservoir gas treatment (Urengoy). Gas Industry, 2005, № 3, p. 48 -50. 6. Kalashnikov O. V. , Kasperovich A. G. , Budnyak S. V. , Gamaleya R. V. , Rychkov D. A. Adequacy questions of thermalphysic base of HYSYS, PRO-2 and Gas. Cond. Oil. 4. Computation and actual data of low-temperature natural gas separation plant", Ecotechnologies and resource saving, 2005, № 4, p. 70 -74.
Overall Conclusion Ø Comparison of the Gas. Cond. Oil-Program with PRO-2 and HYSYS shows a like accuracy for hydrocarbon mixtures and better results for hydrocarbonsaqueous solution systems containing methanol, glycols and salts. Ø As compared with existing analogs Gas. Cond. Oil provides most reliable results by engineering calculations of gas-oil-field systems. Contacts: ► The Gas Institute of National Academy of Sciences of Ukraine ► Scientific & Technical Firm THERMOGAS Ltd. Ukraine, Kiev tel. /fax (+38 044) 2497357, 5464628, 4602629; tel. (+38 044) 5558324. E-mail: Thermogas. Ltd@ukr. net Web: Gas. Cond. Oil. com