pharmacology Dr manar zraikat The principles of pharmacology



- Slides: 131

pharmacology Dr manar zraikat

The principles of pharmacology include the study of the following: • The relationship between drug concentration and biological response • Drug action over time • Factors affecting absorption, distribution, binding, metabolism, and elimination of chemicals

• Structure-activity relationships • Biological changes that result from repeated drug use: • tolerance, • addiction, • adverse reactions, • altered rates of drug metabolism, and so forth

• Antagonism of the effects of one drug by another • The process of drug interaction with cellular macromolecules (receptors) to alter physiological function (i. e. , receptor theory)

Pharmacodynamics The study of how a drug affects an organism

RECEPTORS • to initiate an effect in a cell, most drugs combine with some molecular structure on the surface of or within the cell. • This molecular structure is called a receptor • This combination results in a molecular change in the receptor • triggers a chain of events leading to a response

This concept also applied to the action of naturally occurring substances, • hormones • Neurotransmitters many drugs mimic the effects of hormones or transmitters because they combine with the same receptors as do these endogenous substances.

• It is assumed that all receptors with which drugs combine are receptors for neurotransmitters, hormones, or other physiological substances the discovery of a specific receptor for a group of drugs can lead to a search for previously unknown endogenous substances that combine with those same receptors.

example, finding the evidence for the existence of endogenous peptides with morphinelike activity (endorphins) after discovery of the receptor of the morphine drugs such as morphine merely mimic endorphins by combining with the same receptors

DRUG RECEPTORS AND BIOLOGICAL RESPONSES

Receptors are molecular substances or macromolecules in tissues that combine chemically with the drug. Because most drugs have a considerable degree of selectivity receptors will interact with only a limited number of structurally related or complementary compounds

Specific receptive substances serve as triggers of cellular reactions

Specific example to show the drug– receptor interaction • The end-plate region of a skeletal muscle fiber contains large numbers of receptors having a high affinity for the transmitter acetylcholine. • Each of these receptors, known as nicotinic receptors, is an integral part of a channel in the postsynaptic membrane that controls the inward movement of sodium ions

Specific example to show the drug– receptor interaction • At rest, the postsynaptic membrane is relatively impermeable to sodium. • Stimulation of the nerve results in the release of acetylcholine from the nerve fiber in the region of the end plate

• The acetylcholine combines with the receptors and changes them so that channels are opened and sodium flows inward. • The more acetylcholine the end-plate region contains, the more receptors are occupied and the more channels are open

• When the number of open channels reaches a critical value • sodium enters rapidly enough to disturb the ionic balance of the membrane • resulting in local depolarization

• The local depolarization (endplate potential) triggers the activation of large numbers of voltage-dependent sodium channels • causing the conducted depolarization known as an action potential

• The action potential leads to the release of calcium from intracellular binding sites. • The calcium then interacts with the contractile proteins • resulting in shortening of the muscle cell.

Ach + receptor → Na influx → action potential → increased free Ca ++ → contraction

• If we consider the sequence of events by which acetylcholine brings about muscle contraction through receptors, we can easily appreciate that foreign chemicals (drugs) can be designed to interact with the same process. • Thus, such a drug would mimic the actions of acetylcholine at the motor end plate; nicotine and carbamylcholine are two drugs that have such an effect.

• Chemicals that interact with a receptor and thereby initiate a cellular reaction are termed agonists. • Thus, acetylcholine itself, as well as the drugs nicotine and carbamylcholine, are agonists for the receptors in the skeletal muscle end plate.

• On the other hand, if a chemical is somewhat less similar to acetylcholine, it may interact with the receptor but be unable to induce the exact molecular change necessary to allow the inward movement of sodium. • In this instance the chemical does not cause contraction, but because it occupies the receptor site, it prevents the interaction of acetylcholine with its receptor. Such a drug is termed an antagonist.

An example • d-tubocurarine, an antagonist of acetylcholine at the end-plate receptors. • Since it competes with acetylcholine for its receptor and prevents acetylcholine from producing its characteristic effects, • Administration of d-tubocurarine results in muscle relaxation by interfering with acetylcholine’s ability to induce and maintain the contractile state of the muscle cells.

• Historically, receptors have been identified through recognition of the relative selectivity by which certain exogenously administered drugs, neurotransmitters, or hormones exert their pharmacological effects. • By applying mathematical principles to dose– response relationships, • it became possible to estimate dissociation constants for the interaction between specific receptors and individual agonists or antagonists

THE CHEMISTRY OF DRUG–RECEPTOR BINDING • Biological receptors are capable of combining with drugs in a number of ways • the forces that attract the drug to its receptor must be sufficiently strong and long-lasting to permit the initiation of the sequence of events that ends with the biological response. • Those forces are chemical bonds, and a number of types of bonds participate in the formation of the initial drug–receptor complex

• The bond formed when two atoms share a pair of electrons is called a covalent bond (100 kcal/mole) • Since bonds of this type are so stable at physiological temperatures, the binding of a drug to a receptor through covalent bond formation would result in the formation of a long-lasting complex

• most drug–receptor interactions are readily reversible, • some compounds, such as the anticancer nitrogen mustards and other alkylating agents form relatively irreversible complexes. • Covalent bond formation is a desirable feature of an antineoplastic or antibiotic drug, since long-lasting inhibition of cell replication is needed. • However, covalent bond formation between environmental pollutants and cellular constituents may result in mutagenesis or carcinogenesis in normal, healthy cells.

• The formation of an ionic bond results from the electrostatic attraction that occurs between oppositely charged ions. • The strength of this bond is considerably less (5 kcal/mole) than that of the covalent bond • Diminishes in proportion to the square of the distance between the ionic species. • Most macromolecular receptors have a number of ionizable groups at physiological Ph (e. g. , carboxyl, hydroxyl, phosphoryl, amino) that are available for interaction with an ionizable drug.

• The hydrogen atom, can be bound to one strongly electronegative atom and still accept an electron from another electronegative donor atom, such as oxygen, and thereby form a bridge (hydrogen bond) between these two donor atoms. • The formation of several such bonds between two molecules (e. g. , drug and receptor) can result in a relatively stable but reversible interaction. • Such bonds serve to maintain the tertiary structure of proteins and nucleic acids and are thought to play a significant role in establishing the selectivity and specificity of drug– receptor interactions.

• Van der Waals bonds are quite weak (0. 5 kcal/mole) • become biologically important only when two atoms are brought into sufficiently close contact. • Vander Waals forces play a significant part in determining drug–receptor specificity. • Like the hydrogen bonds, several van der Waals bonds may be established between two molecules

• Several van der Waals bonds may be established if the drug molecule and a receptor have complementary three-dimensional conformations and thus fit closely together. The closer the drug comes to the receptor, the stronger the possible binding forces that can be established.

• Slight differences in three-dimensional shape among a group of agonists result into • slight differences in fit or strength of bonding forces that can be established between agonists and receptor form the basis for the structure–activity relationships among related agonists

• methods were developed to measure the specific binding of radioactively labeled drugs to receptor sites in tissues • thereby determine the affinity of a drug for its receptor, • also the density of receptors per cell

SECOND-MESSENGER SYSTEMS • Many receptors are capable of initiating a chain of events involving second messengers. • Key factors in many of these second-messenger systems are proteins termed G proteins, short for guanine nucleotide–binding proteins. • G proteins have the capacity to bind guanosine triphosphate (GTP) and hydrolyze it to guanosine diphosphate (GDP).

• Whether or not a particular agonist has any effect on a particular cell depends initially on the presence or absence of the appropriate receptor. However, the nature of the response depends on these factors: • Which G protein couples with the receptor • Which kinase is activated • Which proteins are accessible for the kinase to phosphorylate

Pharmacokinetics

Pharmacokinetics is the description of the time course of a drug in the body encompassing absorption, distribution, metabolism, excretion. what the body does to the drug

Pharmacokinetic uses to determine the optimal formulation of a drug Dose dosing frequency

Pharmacokinetic is important in case of narrow therapeutic index nonsteroidal anti-inflammatory drugs, such as ibuprofen, have a wide therapeutic index normal doses can vary from 400 to 3200 mg per day with no substantial difference in acute toxicity or effect. However the blood concentrations of the antiasthmatic drug theophylline must usually be maintained within the range of 10– 20 ug/m. L At concentrations below this, patients may not obtain relief of symptoms, while concentrations above 20 ug/m. L can result in serious toxicities, such as seizures, arrhythmias, and even death. therapeutic index (difference between the minimum effective dose and the minimum toxic dose)

DRUG CONCENTRATION–TIME PROFILES AND BASIC PHARMACOKINETIC PARAMETERS

The time course of a drug Is a concentration–time profile in which the concentrations of a drug in the body are measured analytically and the results plotted in semilogarithmic form against time

single doses Concentration–time profile for a hypothetical drug administered intravenously. Following intravenous dosing of a drug, blood concentrations of the drug reach a maximum almost immediately. Y-axis is logarithmic scale

If the drug given intravenously, maximum concentrations are achieved almost instantaneously since absorption across membranes is not required though distributive processes may also occur (not depicted for the sake of simplicity). The concentrations of drug in the blood decline over time according to the elimination rate of that particular drug

More commonly drug is given via extravascular routes (e. g. , orally), so absorption and distribution must occur, and therefore it will take some time before maximum concentrations are achieved.

225 ug/m. L Single doses approximately 2 hours Concentration–time profile for a hypothetical drug administered extravascularly. Cmax, maximum concentration achieved. Tmax, time required to achieve maximum concentration. AUC � Area under the curve. Y-axis is on logarithmic scale.

pharmacokinetic parameters Cmax is defined as the maximum concentration achieved in the blood Tmax time needed to reach maximum concentration area under the curve half-life, could be estimated by visual inspection or computation

The same drug in a formulation that permits a faster rate of absorption would have a shorter Tmax and generally a higher Cmax than the formulation with slower absorptive properties

drug with a slower elimination rate will generally exhibit a longer Tmax and higher Cmax.

the shape of a concentration–time profile is determined by absorption, distribution, metabolism, excretion which occurs all at once, not in a sequential fashion

area under the curve (AUC) One indicator of the overall exposure of a person to a drug

AUC is the mathematically integrated area under the concentration–timcurve and is most commonly calculated using the trapezoidal rule of mathematics.

the AUC is represented by the shaded area

The shape of the concentration–time profile may affect the AUC for a drug However Two drugs with entirely different concentration– time profile shapes may have the same AUC.

Calculating the AUC is useful, because it can be used to assess the person’s overall exposure to a drug, even though the individual may have reached different Tmax and Cmax values from those of other individuals.

AUC is also useful for calculating clearance the clearance is a pharmacokinetic measurement of the volume of plasma from which a substance is completely removed per unit time; the usual units are m. L/min


The half-life of the drug the time it takes for half of the drug to be eliminated from the body it can readily be used to evaluate how long a drug is expected to remain in the body after termination of dosing

The half-life of the drug helps to calculate The time required for a drug to reach steady state and the frequency of dosing steady state when the rate of drug entering the body is equal to the rate of drug leaving the body

Calculation of the half-life • t 1/2 is the half-life • ke is the elimination rate constant

the elimination rate constant calculated from the slope of the declining portion of the concentration–time profile Elimination of a hypothetical drug with a half-life of 5 hours. The drug concentration decreases by 50% every 5 hours (i. e. , t 1/2 � 5 hours). The slope of the line is the elimination rate (ke).

half-life denotes that 50% of the drug in the body at a given time will be eliminated over the calculated period. However, this does not mean that the same amount of drug is eliminated each half-life

• during the first half-life period (0– 5 hours) the drug concentration is reduced from 100 ug/m. L to 50 ug/m. L during the second half-life period (5– 10 hours), even though the amount in the body is reduced by 50%, the concentration falls only from 50 ug/m. L to 25 ug/m. L (a reduction in concentration of 25 ug/m. L)

It takes approximately five half-lives for 97% of the drug to be eliminated from the body (regardlessof the duration of the half-life)

if one wished to switch a patient from one drug to another but not have both drugs present in substantial quantities the clinician must wait five half-lives before administering the second drug

• also require five half-lives for a drug to reach steady state • independent of the duration of the half-life • Steady state is when the amount of drug entering the body is equal to the amount of drug being eliminated in a given period

Drugs are generally dosed every half-life Thus, the concept of half-life has considerable importance for determining dosing frequency or adjusting doses in a patient.

Bioavailability

Bioavailability (designated as F) is defined as the fraction of the administered drug reaching the systemic circulation as intact drug.

Bioavailability is highly dependent on • the route of administration • the drug formulation

Drugs that are given intravenously exhibit a bioavailability of 1, since the entire dose reaches the systemic circulation as intact drug. However, for other routes of administration, this is not necessarily the case

Factors reduce bioavailability drug being absorbed first by all routes of administration including Subcutaneous, intramuscular, oral, rectal, and other The drug also may be subject to metabolism prior to reaching the systemic circulation,

Example regarding rout of administration when the B-blocking agent propranolol is given intravenously, F=1, but when it is given orally, F = ~0. 2, suggesting that only approximately 20% of the administered dose reaches the systemic circulation as intact drug.

Example regarding effect of drug formulation on bioavailability Digoxin If Given orally as a solution the bioavailability of digoxin approaches F = 1, suggesting essentially complete Bioavailability.

If • Digoxin is given as liquid capsules also exhibit F = ~1 when given orally and thus are also completely available.

If Digoxin is given as tablets, F = ~0. 7, suggesting incomplete bioavailability, probably because of lack of absorption


Two types of bioavailability can be calculated • Absolute bioavailability • Relative bioavailability

The absolute bioavailability of a drug calculation of the absolute bioavailability of a given product compared to the intravenous formulation(F=1) Where the route of administration is other than intravenous(e. g. , oral, rectal).

For calculation of absolute bioavailability Complete concentration-time profiles are needed for both the intravenous and other routes of administration

Relative bioavailability This calculation is determined when two products are compared to each other, not to an intravenous standard.

in the generic drug industry to determine that the generic formulation (e. g. , a tablet) is bioequivalent to the original formulation (e. g. , another tablet)

• bioavailability is not routinely calculated in an individual patient • Reserved for product development by a drug manufacturer. • It is important to have an idea of how formulations or routes of administration differ with respect to bioavailability • for proper dosage adjustment when changing formulations or routes of administration

Clearance

Clearance is a pharmacokinetic parameter used to describe the efficiency of irreversible elimination of drug from the body

Also clearance is defined as the volume of blood from which drug can be completely removed per unit of time (e. g. , 100 m. L/minute). Clearance can involve 1. metabolism of drug to a metabolite 2. excretion of drug from the body

A molecule that has undergone glucuronidation is described as having been cleared, even though the molecule itself may not have left the body

Clearance of drug can be accomplished by excretion of drug into the • urine • gut contents • expired air • sweat • and saliva as well • as metabolic conversion to another form.

uptake of drug into tissues does not constitute clearance

Total (systemic) clearance the clearance of drug by all routes or where Vd is the volume of distribution

To calculate clearance • Must give the drug intravenously to assure 100% bioavailability, • lack of 100% bioavail-ability can change the dose numerator, which is required to calculate total clearance.

But if intravenous administration is not possible

the apparent clearance (also called oral clearance) can be estimated • The term apparent clearance is used because the bioavailability of the compound is unknown. • Thus, estimations of apparent clearance will always be higher than the true systemic clearance because of this unknown bioavailability.

the apparent clearance (also called oral clearance) can be estimated by the following equation rearranged

Renal clearance • that portion of clearance that is due to renal elimination. • Calculation of renal clearance is especially useful for drugs that are eliminated primarily by the kidney.

Renal clearance is calculated as where Ae is the total amount of drug excreted unchanged into the urine.


The importance of clearance

• The calculation of clearance can be especially useful in optimizing dosing of patients • The clearance includes both the volume of distribution and the elimination rate • The clearance adjusts for differences in distribution characteristics and elimination rates among people

The easiest clearance parameter to estimate is that of apparent (oral) clearance since it does not require intravenous administration

Volume of Distribution • Vd relates a concentration of drug measured in the blood to the total amount of drug in the body • This mathematically determined value gives a rough indication of the overall distribution of a drug in the body

Example • For a drug with a Vd of approximately 12 L (i. e. , interstitial fluid plus plasma water) • the drug is probably distributed throughout extracellular fluid but is unable to penetrate cells. • In general, the greater the Vd, the greater the diffusibility of the drug

• The volume of distribution is not an actual volume, • its estimation may result in a volume greater than the volume available in the body (~40 L in a 70 -kg adult). • Such a value will result if the compound is bound or sequestered at some extravascular site.

Examples • a highly lipid-soluble drug, such as thiopental, that can be extensively stored in fat depots may have a Vd considerably in excess of the entire fluid volume of the body. • Thus, because of their physicochemical characteristics, different drugs can have quite different volumes of distribution in the same person.

Examples • The anti inflammatory drug ibuprofen, • typically exhibits a volume of distribution of 0. 14 L/kg such that for a 70 -kg person, the Vd would be 10. 8 L. • This volume (10. 8 L) is approximately equal to the plasma volume of a person that size, suggesting that this drug does not distribute widely into tissues (though it does reach tissues to some degree to exert its action)

Examples • the antiarrhythmic amiodarone has a Vd of 60 L/kg, giving a total Vd of 4200 L for this same 70 -kg person. • This large Vd suggests that amiodarone distributes widely throughout the body; • in fact, it does distribute to various tissues, such as the liver, lungs, eyes, and adipose tissue.

Since the total volume of the body does not equal 4200 L, it can clearly be seen that this is not a “real” volume but one that relates the blood concentration to the amount of drug in the body.

Protein Binding

• Most drugs bind to plasma proteins such as albumin and alpha 1 -acid glycoprotein (AGP) to some degree. This becomes clinically important as it is assumed that only unbound (free) drug is available for binding to receptors being metabolized by enzymes, eliminated from the body.

Example • phenytoin is approximately 90% bound to plasma proteins, • leaving 10% of the concentration in the blood as free drug and available for pharmacological action and metabolism.

• If the presence of renal disease or a drug interaction were to alter the degree of protein binding to only 80%, this change could have substantial clinical consequences. • Even though the total percent bound changes relatively little, the net result is to double the amount of free drug. for phenytoin this could make a real difference

However • For most drugs, displacement from protein binding sites results in only a transient increase in free drug concentration, since the drug is rapidly redistributed into other body water compartments. • Thus, interactions or changes in protein binding in most cases have little clinical effect despite these theoretical considerations.

PHARMACOKINETICS OF SINGLE VERSUS MULTIPLE DOSING

• Administration of single doses of a drug are occasionally encountered in clinical practice • it is more common to use single doses to determine the pharmacokinetic profile of a drug. • Following a single dose, concentrations can be monitored until no longer analytically detectable and a complete pharmacokinetic profile is described.

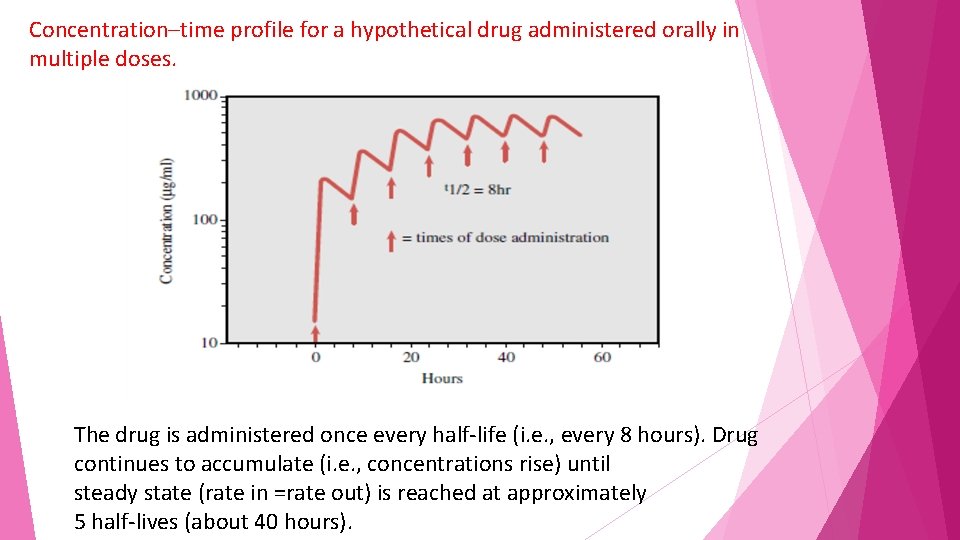
In clinical practice, drugs are more commonly administered in multiple doses, with the second dose usually given before the first dose is completely eliminated. With each successive dose up to approximately five doses, the concentration of drug keeps increasing, a phenomenon known as accumulation

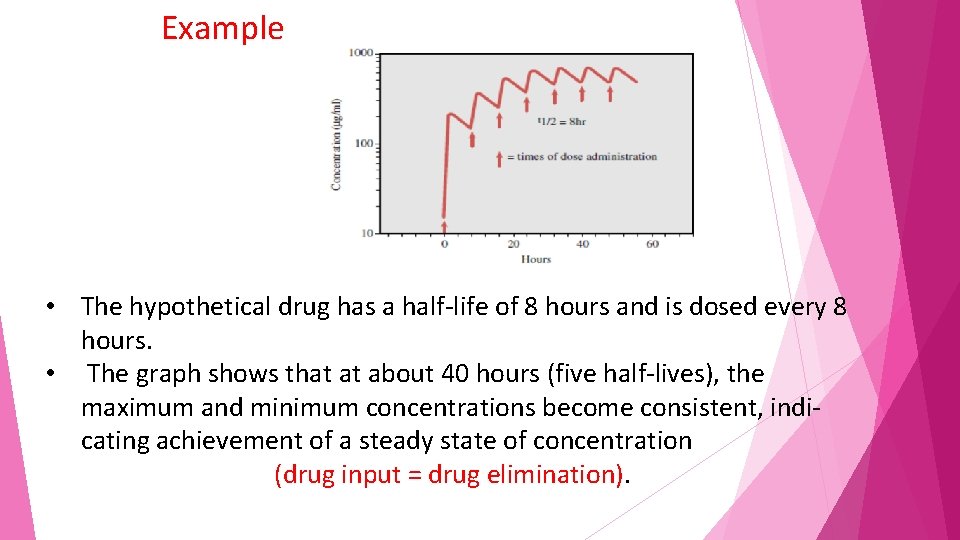
Concentration–time profile for a hypothetical drug administered orally in multiple doses. The drug is administered once every half-life (i. e. , every 8 hours). Drug continues to accumulate (i. e. , concentrations rise) until steady state (rate in =rate out) is reached at approximately 5 half-lives (about 40 hours).


The final concentrations of drug reached depend on • the elimination rate of the drug, • the dosing frequency, • and the actual dose

for a given drug, concentrations will reach higher steady-state values if • the drug is given more frequently • or in greater doses. In contrast, • the time to reach steady state is affected by neither the dose amount nor dosing frequency.

• The time to reach steady state is solely affected by the elimination rate (which is reflected in the t 1/2). • Giving a larger dose or giving the dose more often will not change the time needed to reach steady state except in the case of a bolus dose

Just as it takes approximately five halflives for a drug to be essentially (97%) eliminated it also requires five half-lives for a drug to reach steady state

Example • The hypothetical drug has a half-life of 8 hours and is dosed every 8 hours. • The graph shows that at about 40 hours (five half-lives), the maximum and minimum concentrations become consistent, indicating achievement of a steady state of concentration (drug input = drug elimination).

The only practical method for achieving steady-state concentrations prior to five half-lives is to administer a bolus dose of drug (a dose much higher than normal and designed to bring concentrations up to steady state immediately)

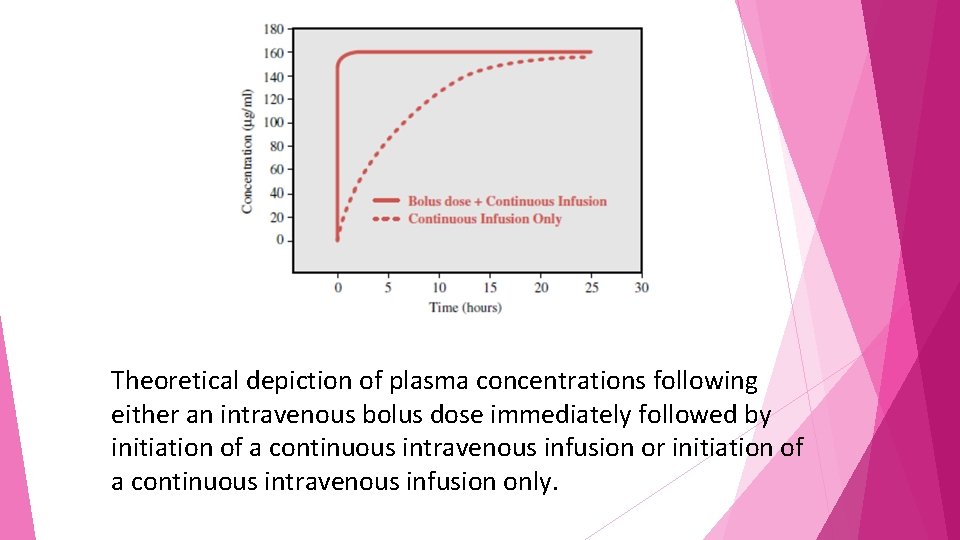
Theoretical depiction of plasma concentrations following either an intravenous bolus dose immediately followed by initiation of a continuous intravenous infusion or initiation of a continuous intravenous infusion only.

• After the bolus the “accumulation” of drug occurs rapidly because of the large amount of drug given initially. • bolus doses must be calculated in accordance with both the drug’s pharmacokinetic parameters and the physiological characteristics of the individual to avoid potential toxicities.

NONLINEAR PHARMACOKINETICS

If the drug of interest follows linear pharmacokinetic principles; that is, the concentrations achieved are proportional to the dose given. For example, a doubling of the dose will produce a doubling of the blood concentration.

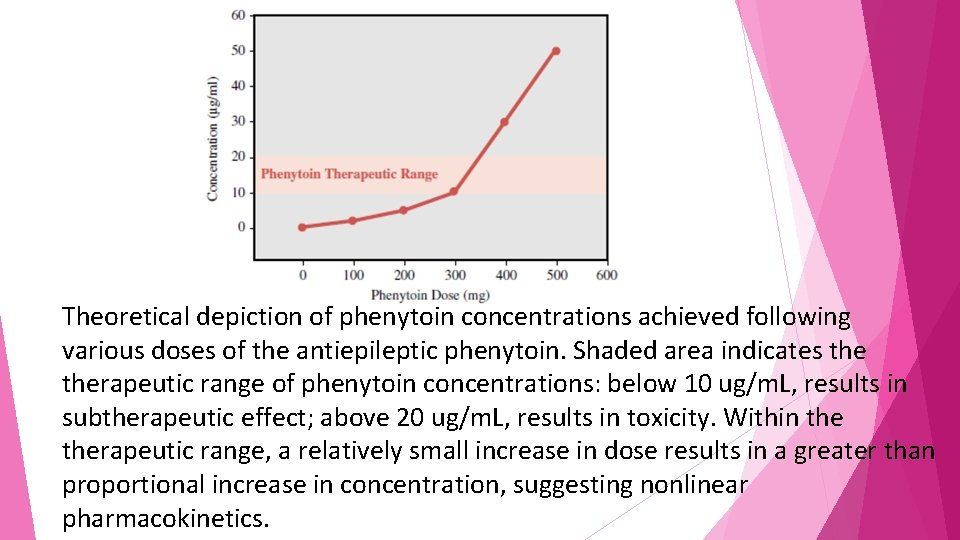
The nonlinear drug behavior an increase in dose may produce a concentration much greater than expected. • For example, • Increases in dosage of the antiepileptic agent phenytoin above approximately 300 mg daily • usually produce a greater than expected increase in blood concentrations

Theoretical depiction of phenytoin concentrations achieved following various doses of the antiepileptic phenytoin. Shaded area indicates therapeutic range of phenytoin concentrations: below 10 ug/m. L, results in subtherapeutic effect; above 20 ug/m. L, results in toxicity. Within therapeutic range, a relatively small increase in dose results in a greater than proportional increase in concentration, suggesting nonlinear pharmacokinetics.

• The graph demonstrates that as one approaches doses that result in therapeutic concentrations of phenytoin, • the rise in concentrations becomes nonlinear such that • an increase in dose from 300 to 400 mg (33% increase) produces a 300% increase in phenytoin concentration.

• toxicity may arise quickly following • what was seemingly a small increase in dose; under linear circumstances such a small increase in dose would have resulted in concentrations still within therapeutic range

Reasons for nonlinearity • This nonlinearity often occurs because the drug-metabolizing enzymes for the drug become saturated at typical blood concentrations, • Such that despite increases in dose, drug is still metabolized at the same rate and blood concentrations go up unexpectedly. • In this case, following Michaelis-Menten enzyme kinetics, the maximum velocity (Vmax) has been reached and the rate of drug metabolism remains
 Basic principles of pharmacology
 Basic principles of pharmacology
 Chapter 30 principles of pharmacology
 Hổ đẻ mỗi lứa mấy con
 Thế nào là hệ số cao nhất
 Diễn thế sinh thái là
 Vẽ hình chiếu vuông góc của vật thể sau
 Ng-html
 101012 bằng
 Thế nào là mạng điện lắp đặt kiểu nổi
 Lời thề hippocrates
 Tư thế worm breton
 đại từ thay thế
 Vẽ hình chiếu đứng bằng cạnh của vật thể
 Quá trình desamine hóa có thể tạo ra
 Sự nuôi và dạy con của hổ
 Các châu lục và đại dương trên thế giới
 Dạng đột biến một nhiễm là
 Nguyên nhân của sự mỏi cơ sinh 8
 Bổ thể
 Phản ứng thế ankan
 Thiếu nhi thế giới liên hoan
 Hát lên người ơi alleluia
 điện thế nghỉ
 Vẽ hình chiếu vuông góc của vật thể sau
 Một số thể thơ truyền thống
 Hệ hô hấp
 Công thức tính độ biến thiên đông lượng
 Số nguyên tố là
 đặc điểm cơ thể của người tối cổ
 Tỉ lệ cơ thể trẻ em
 Các châu lục và đại dương trên thế giới
 ưu thế lai là gì
 Thẻ vin
 Môn thể thao bắt đầu bằng chữ đua
 Tư thế ngồi viết
 Cái miệng nó xinh thế
 Hình ảnh bộ gõ cơ thể búng tay
 Mật thư anh em như thể tay chân
 Từ ngữ thể hiện lòng nhân hậu
 Tư thế ngồi viết
 Trời xanh đây là của chúng ta thể thơ
 Giọng cùng tên là
 Gấu đi như thế nào
 Thể thơ truyền thống
 Dopamine blockers
 Pharmacology chapter 1
 Pharmacology newcastle
 First pass metabolism definition pharmacology
 Guaifenasin
 Mechanism of drug action
 First order kinetics
 Glomerular
 Basic & clinical pharmacology
 Ansc 497
 Competitive antagonist
 Pharmacology for nurses: a pathophysiological approach
 Focus on pharmacology essentials for health professionals
 Alia drug testing
 Therapeutic index
 Pharmacology definition
 Define pharmacology
 Pharmacology tutor anderson
 Dopamine synthesis
 Clinical pharmacology powered by clinicalkey
 Clinical pharmacology seminar
 First pass effect
 Loading dose formula in pharmacology
 What is ion trapping in pharmacology
 Clinical pharmacology residency
 Toxicology and applied pharmacology
 What is ion trapping in pharmacology
 Respiratory pharmacology quiz
 Diazepa
 Drug excretion
 Loading dose example
 Venipuncture for radiologic technologists
 Essential drug concept in pharmacology
 Clinical pharmacology
 Branches of pharmacology
 Pharmacology of drugs acting on respiratory system
 Adrenal drugs pharmacology
 What is pharmacology
 Estado estable farmacologia
 Bioavailability definition
 Drug metabolism definition
 Annual review of pharmacology and toxicology
 Rationale meaning in pharmacology
 Computational pharmacology
 Pharmacology module
 Loading dose formula
 Advantages and disadvantages of drugs
 Summation drug interaction
 Reductinist
 Basic & clinical pharmacology
 Fundamentals of pharmacology for veterinary technicians
 Pharmacology pay
 Chapter 15 diagnostic procedures and pharmacology
 Clinical pharmacology seminar
 Slidetodoc
 First bypass effect
 Difference between tolerance and tachyphylaxis
 Fish pharmacology
 Principles of primary care
 Photodiode current equation
 Introduction of total quality management
 Manual handling
 Montanas state flag
 Radial preload in external fixator
 Giacomo balla
 Principles of effective intervention
 7 principles of business ethics
 Photography principles
 Process redesign principles
 Objectives of macro teaching
 Geomerty
 Florida real estate principles practices & law 43rd edition
 Contemporary leadership principles
 Example of universal principles
 C max pharmacokinetics definition
 Principles of typography
 Dpup principles
 Principles of iv medication
 Element and principles of art
 Positive law vs natural law
 Principles of marketing chapter 2
 Principles of representative democracy
 4 principles of natural selection
 Receiving and put-away
 Basic principles of animal form and function
 Principles of direct method
 Pelergo

