Introduction to the Cray XK 7 Jeff Larkin

















- Slides: 164

Introduction to the Cray XK 7 Jeff Larkin Cray Supercomputing Center of Excellence larkin@cray. com

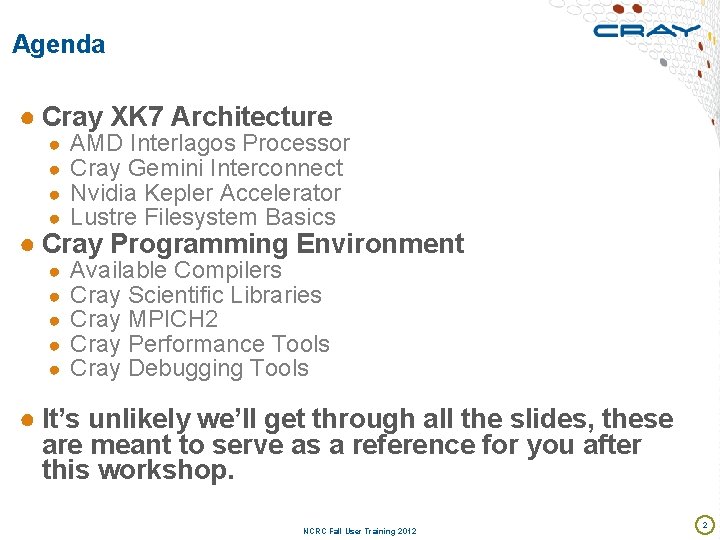
Agenda ● Cray XK 7 Architecture ● ● AMD Interlagos Processor Cray Gemini Interconnect Nvidia Kepler Accelerator Lustre Filesystem Basics ● ● ● Available Compilers Cray Scientific Libraries Cray MPICH 2 Cray Performance Tools Cray Debugging Tools ● Cray Programming Environment ● It’s unlikely we’ll get through all the slides, these are meant to serve as a reference for you after this workshop. NCRC Fall User Training 2012 2

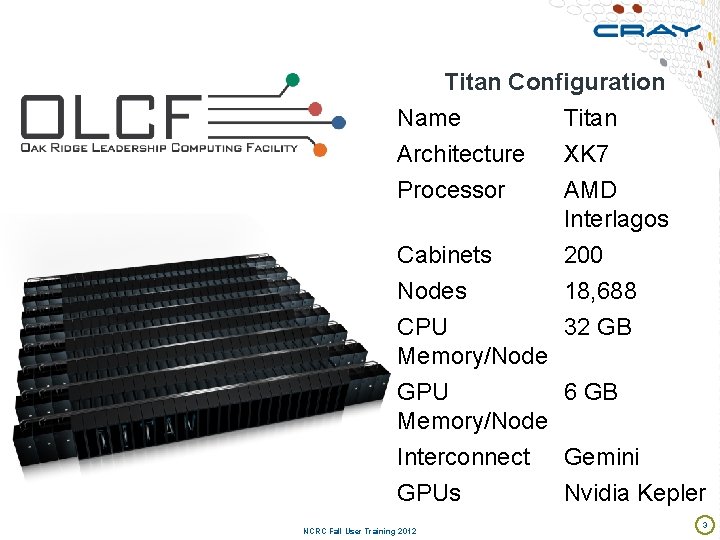
Titan Configuration Name Titan Architecture XK 7 Processor AMD Interlagos Cabinets 200 Nodes 18, 688 CPU 32 GB Memory/Node GPU 6 GB Memory/Node Interconnect Gemini GPUs Nvidia Kepler NCRC Fall User Training 2012 3

Cray XK 7 Architecture AMD Interlagos Processor Cray Gemini Interconnect Nvidia Kepler Accelerator Lustre Filesystem Basics

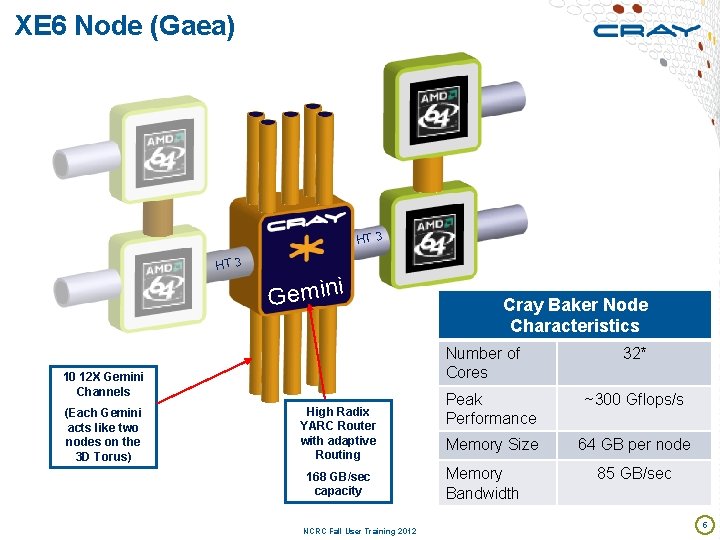
XE 6 Node (Gaea) HT 3 Gemini Number of Cores 10 12 X Gemini Channels (Each Gemini acts like two nodes on the 3 D Torus) Cray Baker Node Characteristics High Radix YARC Router with adaptive Routing 168 GB/sec capacity NCRC Fall User Training 2012 32* Peak Performance ~300 Gflops/s Memory Size 64 GB per node Memory Bandwidth 85 GB/sec 5

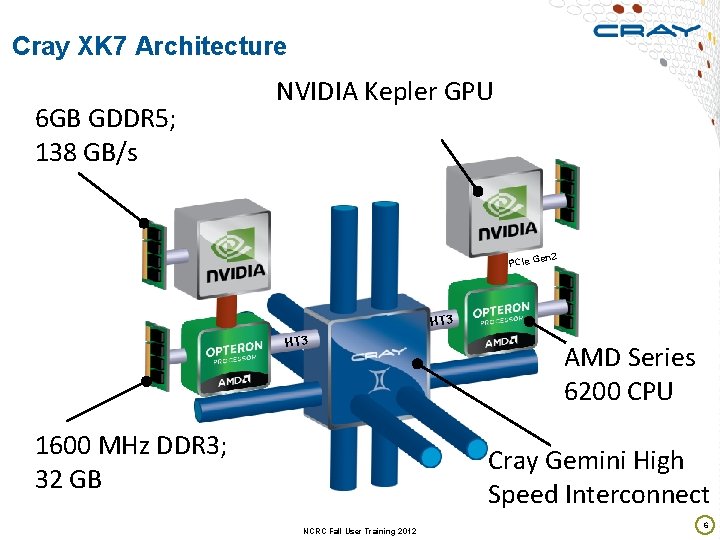
Cray XK 7 Architecture 6 GB GDDR 5; 138 GB/s NVIDIA Kepler GPU en 2 PCIe G HT 3 1600 MHz DDR 3; 32 GB AMD Series 6200 CPU Cray Gemini High Speed Interconnect NCRC Fall User Training 2012 6

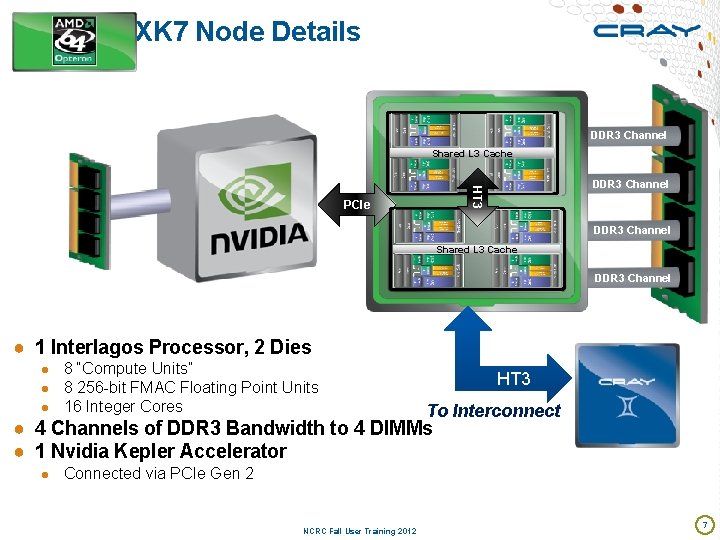
XK 7 Node Details DDR 3 Channel Shared L 3 Cache HT 3 DDR 3 Channel PCIe DDR 3 Channel Shared L 3 Cache DDR 3 Channel ● 1 Interlagos Processor, 2 Dies ● 8 “Compute Units” ● 8 256 -bit FMAC Floating Point Units ● 16 Integer Cores HT 3 To Interconnect ● 4 Channels of DDR 3 Bandwidth to 4 DIMMs ● 1 Nvidia Kepler Accelerator ● Connected via PCIe Gen 2 NCRC Fall User Training 2012 7

AMD Interlagos Processor NCRC Fall User Training 2012 8

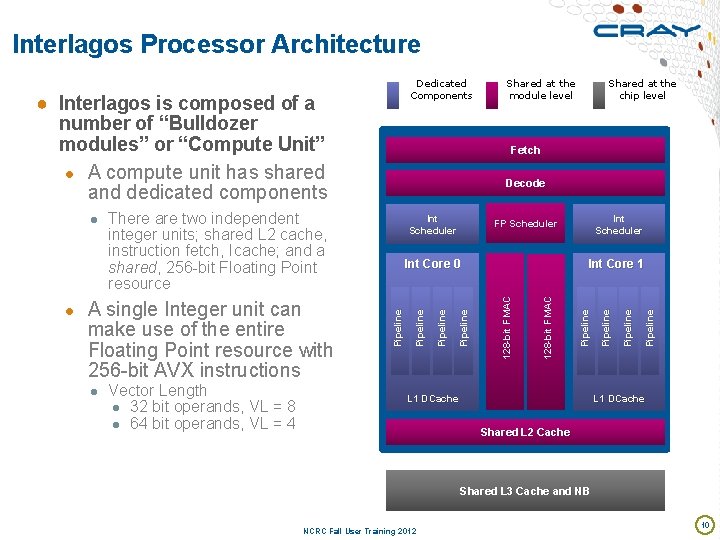
Interlagos Core Definition ● In order to optimize the utilization of the shared and dedicated resources on the chip for different types of applications, modern x 86 processors offer flexible options for running applications. As a result, the definition of a core has become ambiguous. ● Definition of a Core from Blue Waters proposal: ● Equivalent to an AMD “Interlagos” Compute Unit, which is an AMD Interlagos “Bulldozer module” consisting of: one instruction fetch/decode unit, one floating point scheduler with two FMAC execution units, two integer schedulers with multiple pipelines and L 1 Dcache, and a L 2 cache. This is sometimes also called a “Core Module. ” A “core” = “compute unit” = “core module. ” NCRC Fall User Training 2012 9

Interlagos Processor Architecture Dedicated Components ● Interlagos is composed of a number of “Bulldozer modules” or “Compute Unit” ● A compute unit has shared and dedicated components Decode ● Vector Length ● 32 bit operands, VL = 8 ● 64 bit operands, VL = 4 L 1 DCache Pipeline 128 -bit FMAC Int Core 1 128 -bit FMAC Pipeline Int Core 0 Pipeline Int Scheduler FP Scheduler Pipeline Int Scheduler integer units; shared L 2 cache, instruction fetch, Icache; and a shared, 256 -bit Floating Point resource make use of the entire Floating Point resource with 256 -bit AVX instructions Shared at the chip level Fetch ● There are two independent ● A single Integer unit can Shared at the module level L 1 DCache Shared L 2 Cache Shared L 3 Cache and NB NCRC Fall User Training 2012 10

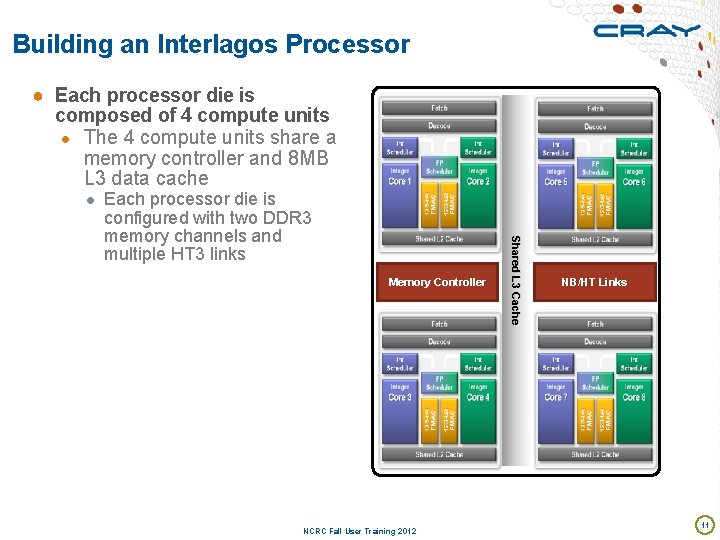
Building an Interlagos Processor ● Each processor die is composed of 4 compute units ● The 4 compute units share a memory controller and 8 MB L 3 data cache ● Each processor die is Memory Controller NCRC Fall User Training 2012 Shared L 3 Cache configured with two DDR 3 memory channels and multiple HT 3 links NB/HT Links 11

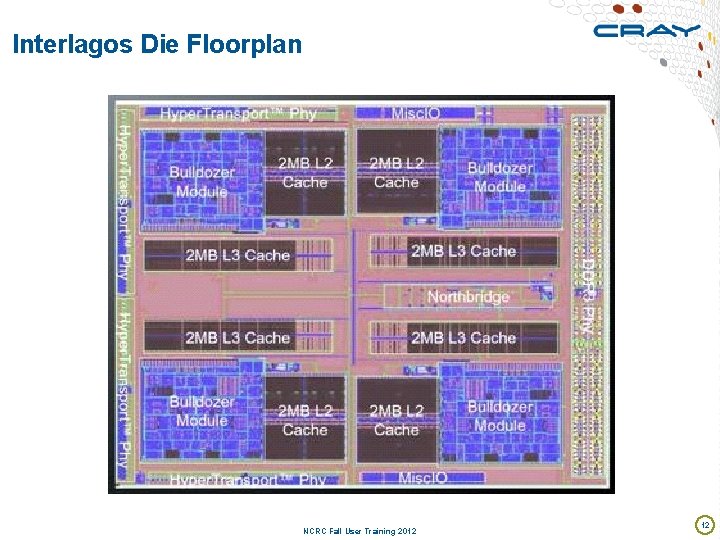
Interlagos Die Floorplan NCRC Fall User Training 2012 12

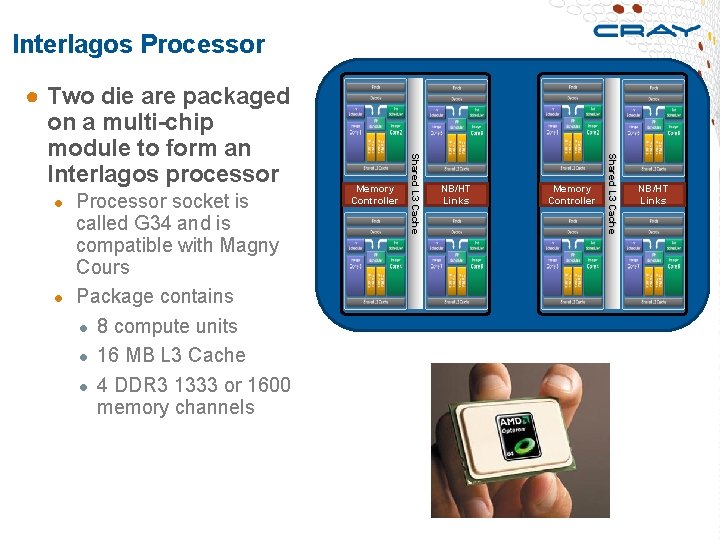
Interlagos Processor called G 34 and is compatible with Magny Cours ● Package contains ● 8 compute units ● 16 MB L 3 Cache ● 4 DDR 3 1333 or 1600 memory channels NB/HT Links Memory Controller Shared L 3 Cache ● Processor socket is Memory Controller Shared L 3 Cache ● Two die are packaged on a multi-chip module to form an Interlagos processor NB/HT Links

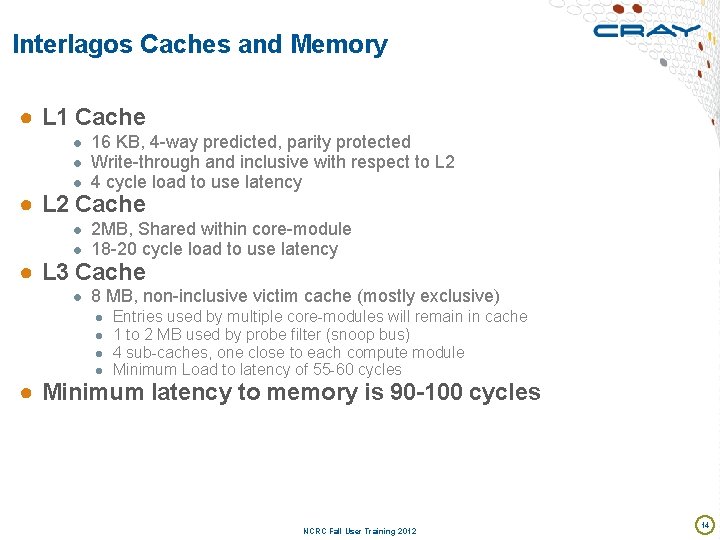
Interlagos Caches and Memory ● L 1 Cache ● 16 KB, 4 -way predicted, parity protected ● Write-through and inclusive with respect to L 2 ● 4 cycle load to use latency ● L 2 Cache ● 2 MB, Shared within core-module ● 18 -20 cycle load to use latency ● L 3 Cache ● 8 MB, non-inclusive victim cache (mostly exclusive) ● Entries used by multiple core-modules will remain in cache ● 1 to 2 MB used by probe filter (snoop bus) ● 4 sub-caches, one close to each compute module ● Minimum Load to latency of 55 -60 cycles ● Minimum latency to memory is 90 -100 cycles NCRC Fall User Training 2012 14

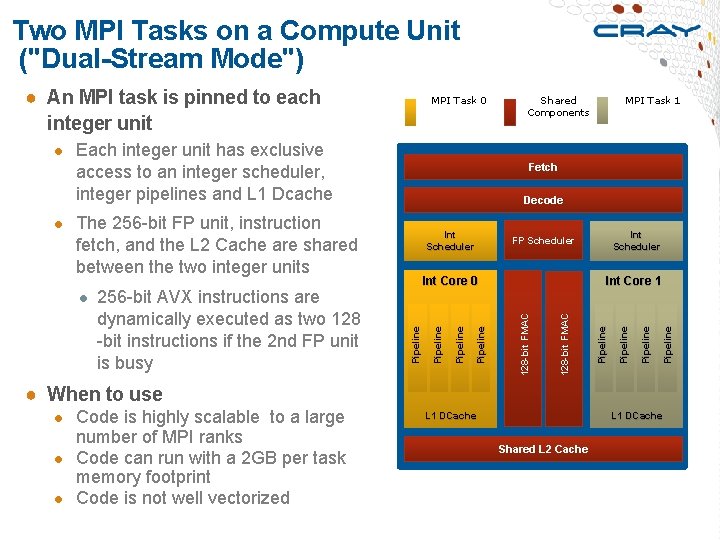
Two MPI Tasks on a Compute Unit ("Dual-Stream Mode") ● An MPI task is pinned to each integer unit MPI Task 0 Shared Components MPI Task 1 ● Each integer unit has exclusive Fetch access to an integer scheduler, integer pipelines and L 1 Dcache Decode Pipeline 128 -bit FMAC Int Core 1 128 -bit FMAC Pipeline dynamically executed as two 128 -bit instructions if the 2 nd FP unit is busy Pipeline Int Core 0 ● 256 -bit AVX instructions are Int Scheduler FP Scheduler Pipeline Int Scheduler fetch, and the L 2 Cache are shared between the two integer units Pipeline ● The 256 -bit FP unit, instruction ● When to use ● Code is highly scalable to a large number of MPI ranks ● Code can run with a 2 GB per task memory footprint ● Code is not well vectorized L 1 DCache Shared L 2 Cache

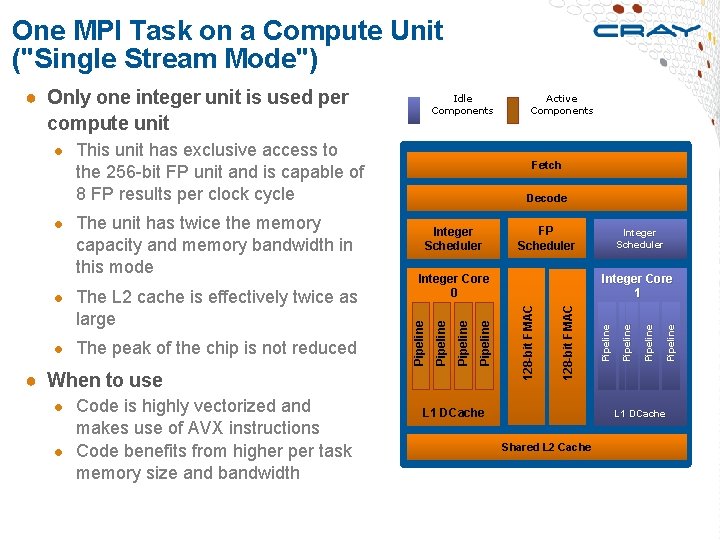
One MPI Task on a Compute Unit ("Single Stream Mode") ● Only one integer unit is used per compute unit Idle Components ● This unit has exclusive access to Fetch the 256 -bit FP unit and is capable of 8 FP results per clock cycle ● Code is highly vectorized and makes use of AVX instructions ● Code benefits from higher per task memory size and bandwidth L 1 DCache Pipeline 128 -bit FMAC ● When to use Integer Scheduler Integer Core 1 128 -bit FMAC ● The peak of the chip is not reduced Pipeline large FP Scheduler Integer Core 0 Pipeline ● The L 2 cache is effectively twice as Integer Scheduler Pipeline capacity and memory bandwidth in this mode Decode Pipeline ● The unit has twice the memory Active Components L 1 DCache Shared L 2 Cache

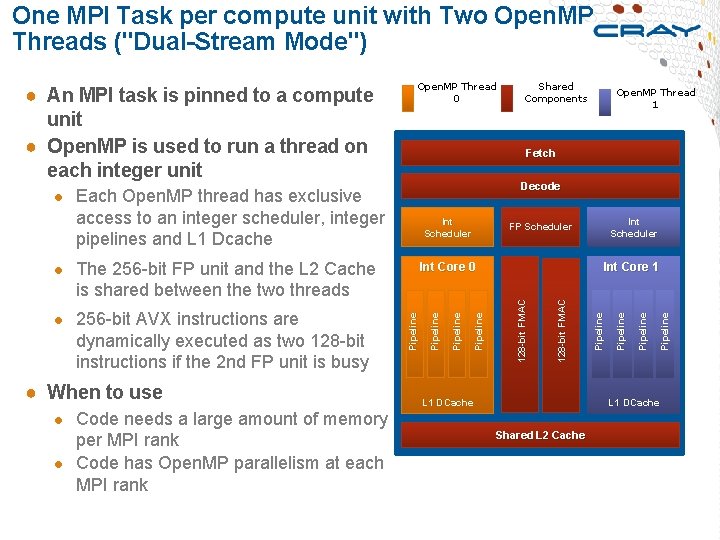
One MPI Task per compute unit with Two Open. MP Threads ("Dual-Stream Mode") Open. MP Thread 0 Decode ● When to use L 1 DCache ● Code needs a large amount of memory per MPI rank ● Code has Open. MP parallelism at each MPI rank Pipeline Pipeline is shared between the two threads Int Core 1 128 -bit FMAC Int Core 0 Pipeline ● The 256 -bit FP unit and the L 2 Cache Int Scheduler FP Scheduler Pipeline Int Scheduler Pipeline access to an integer scheduler, integer pipelines and L 1 Dcache dynamically executed as two 128 -bit instructions if the 2 nd FP unit is busy Open. MP Thread 1 Fetch ● Each Open. MP thread has exclusive ● 256 -bit AVX instructions are Shared Components 128 -bit FMAC ● An MPI task is pinned to a compute unit ● Open. MP is used to run a thread on each integer unit Shared L 2 Cache

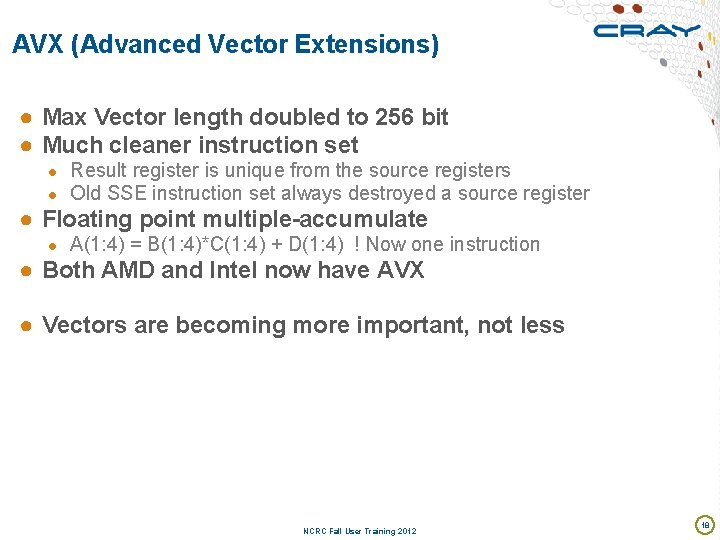
AVX (Advanced Vector Extensions) ● Max Vector length doubled to 256 bit ● Much cleaner instruction set ● Result register is unique from the source registers ● Old SSE instruction set always destroyed a source register ● Floating point multiple-accumulate ● A(1: 4) = B(1: 4)*C(1: 4) + D(1: 4) ! Now one instruction ● Both AMD and Intel now have AVX ● Vectors are becoming more important, not less NCRC Fall User Training 2012 18

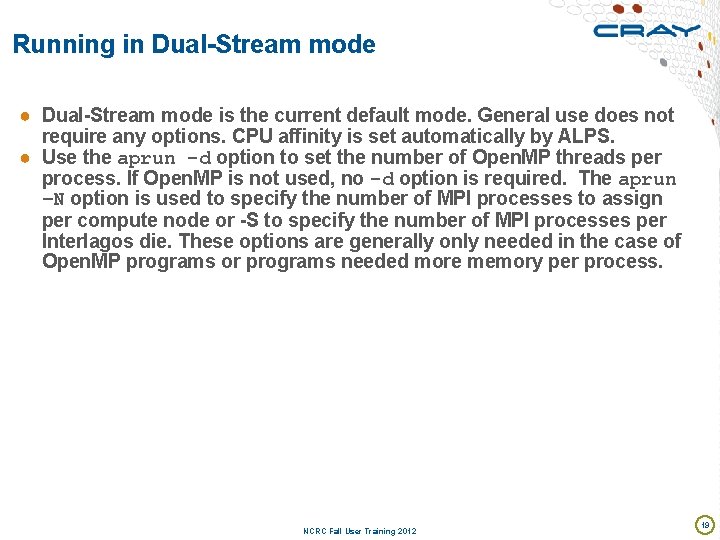
Running in Dual-Stream mode ● Dual-Stream mode is the current default mode. General use does not require any options. CPU affinity is set automatically by ALPS. ● Use the aprun -d option to set the number of Open. MP threads per process. If Open. MP is not used, no -d option is required. The aprun –N option is used to specify the number of MPI processes to assign per compute node or -S to specify the number of MPI processes per Interlagos die. These options are generally only needed in the case of Open. MP programs or programs needed more memory per process. NCRC Fall User Training 2012 19

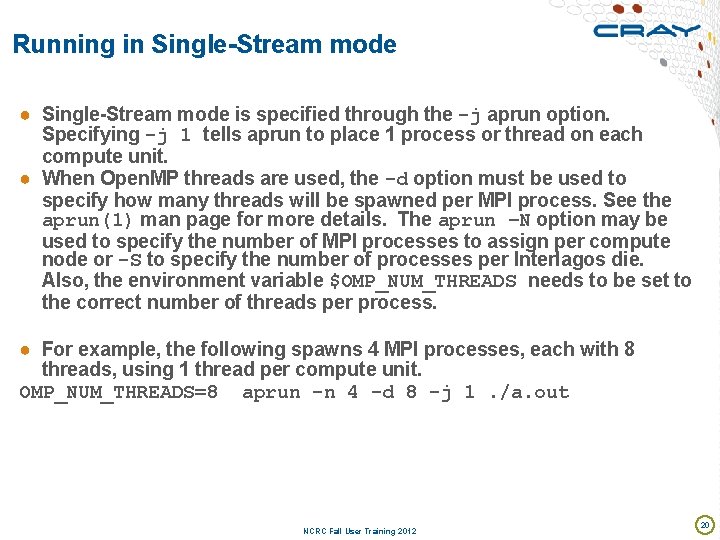
Running in Single-Stream mode ● Single-Stream mode is specified through the -j aprun option. Specifying -j 1 tells aprun to place 1 process or thread on each compute unit. ● When Open. MP threads are used, the -d option must be used to specify how many threads will be spawned per MPI process. See the aprun(1) man page for more details. The aprun –N option may be used to specify the number of MPI processes to assign per compute node or -S to specify the number of processes per Interlagos die. Also, the environment variable $OMP_NUM_THREADS needs to be set to the correct number of threads per process. ● For example, the following spawns 4 MPI processes, each with 8 threads, using 1 thread per compute unit. OMP_NUM_THREADS=8 aprun -n 4 -d 8 -j 1. /a. out NCRC Fall User Training 2012 20

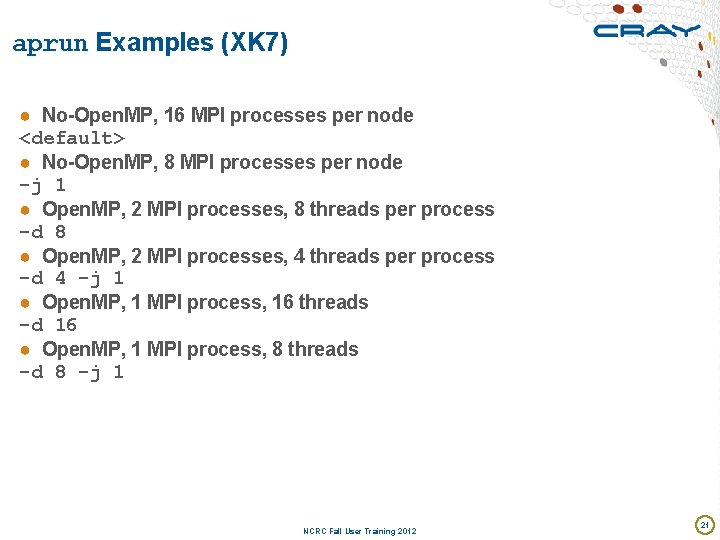
aprun Examples (XK 7) ● No-Open. MP, 16 MPI processes per node <default> ● No-Open. MP, 8 MPI processes per node -j 1 ● Open. MP, 2 MPI processes, 8 threads per process -d 8 ● Open. MP, 2 MPI processes, 4 threads per process -d 4 -j 1 ● Open. MP, 1 MPI process, 16 threads -d 16 ● Open. MP, 1 MPI process, 8 threads -d 8 -j 1 NCRC Fall User Training 2012 21

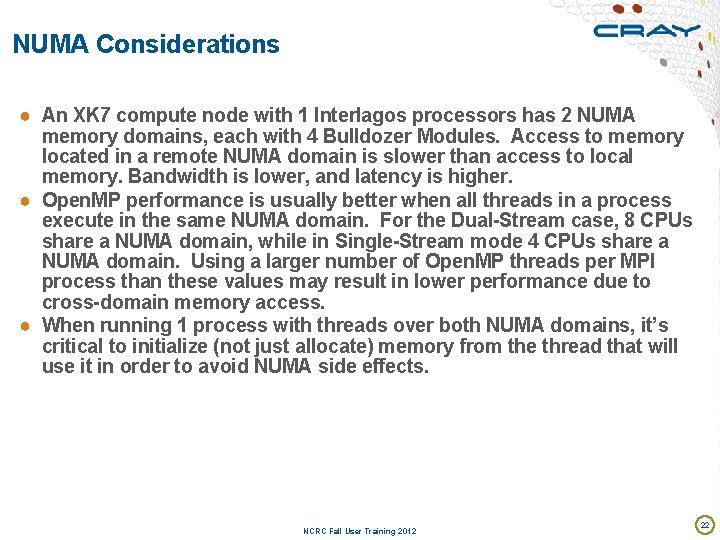
NUMA Considerations ● An XK 7 compute node with 1 Interlagos processors has 2 NUMA memory domains, each with 4 Bulldozer Modules. Access to memory located in a remote NUMA domain is slower than access to local memory. Bandwidth is lower, and latency is higher. ● Open. MP performance is usually better when all threads in a process execute in the same NUMA domain. For the Dual-Stream case, 8 CPUs share a NUMA domain, while in Single-Stream mode 4 CPUs share a NUMA domain. Using a larger number of Open. MP threads per MPI process than these values may result in lower performance due to cross-domain memory access. ● When running 1 process with threads over both NUMA domains, it’s critical to initialize (not just allocate) memory from the thread that will use it in order to avoid NUMA side effects. NCRC Fall User Training 2012 22

NCRC Fall User Training 2012 23

Cray Gemini Interconnect NCRC Fall User Training 2012 24

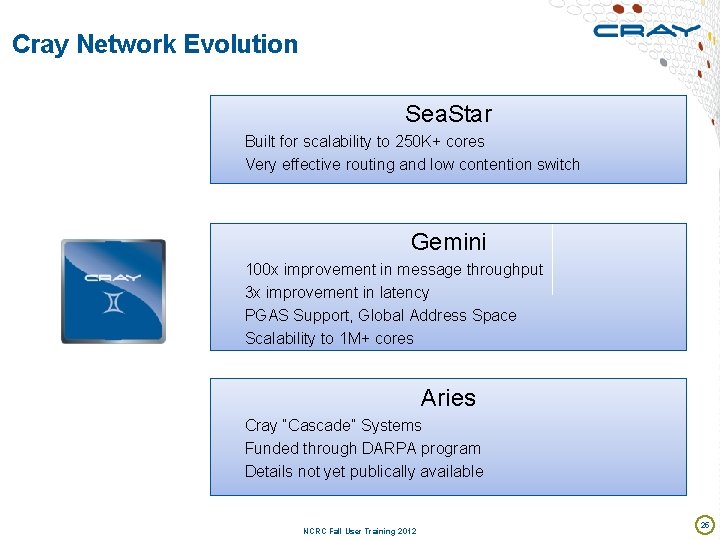
Cray Network Evolution Sea. Star Built for scalability to 250 K+ cores Very effective routing and low contention switch Gemini 100 x improvement in message throughput 3 x improvement in latency PGAS Support, Global Address Space Scalability to 1 M+ cores Aries Cray “Cascade” Systems Funded through DARPA program Details not yet publically available NCRC Fall User Training 2012 25

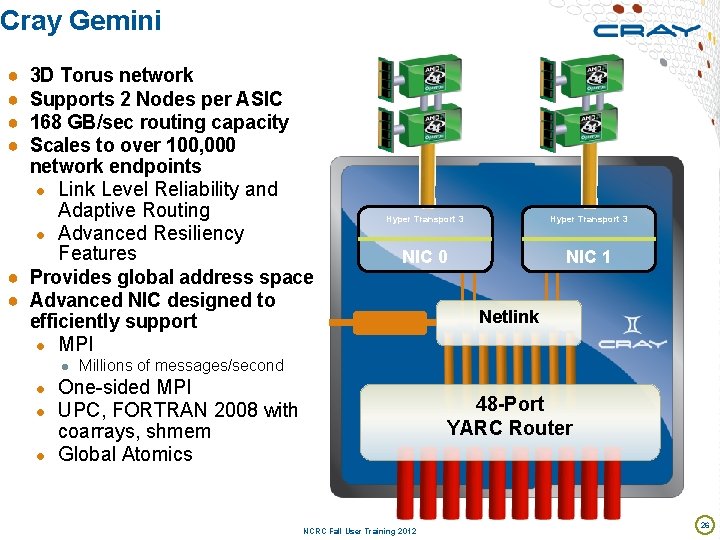
Cray Gemini ● ● 3 D Torus network Supports 2 Nodes per ASIC 168 GB/sec routing capacity Scales to over 100, 000 network endpoints ● Link Level Reliability and Adaptive Routing ● Advanced Resiliency Features ● Provides global address space ● Advanced NIC designed to efficiently support ● MPI Hyper Transport 3 NIC 0 NIC 1 Netlink ● Millions of messages/second ● One-sided MPI ● UPC, FORTRAN 2008 with coarrays, shmem ● Global Atomics NCRC Fall User Training 2012 48 -Port YARC Router 26

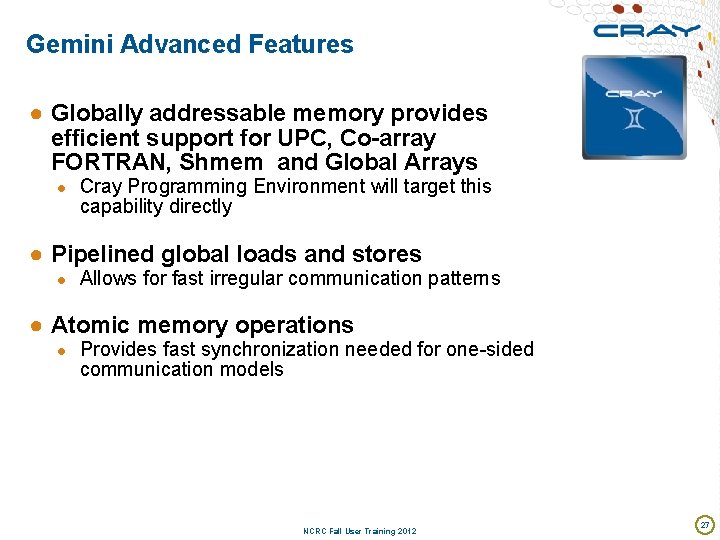
Gemini Advanced Features ● Globally addressable memory provides efficient support for UPC, Co-array FORTRAN, Shmem and Global Arrays ● Cray Programming Environment will target this capability directly ● Pipelined global loads and stores ● Allows for fast irregular communication patterns ● Atomic memory operations ● Provides fast synchronization needed for one-sided communication models NCRC Fall User Training 2012 27

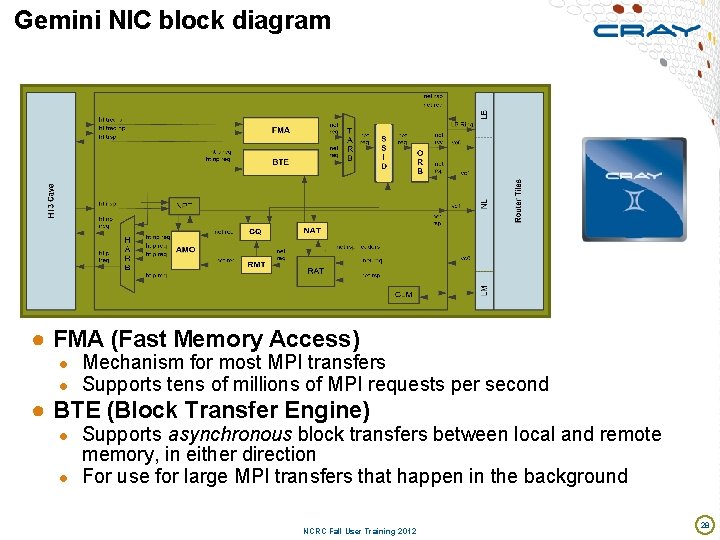
Gemini NIC block diagram ● FMA (Fast Memory Access) ● Mechanism for most MPI transfers ● Supports tens of millions of MPI requests per second ● BTE (Block Transfer Engine) ● Supports asynchronous block transfers between local and remote memory, in either direction ● For use for large MPI transfers that happen in the background NCRC Fall User Training 2012 28

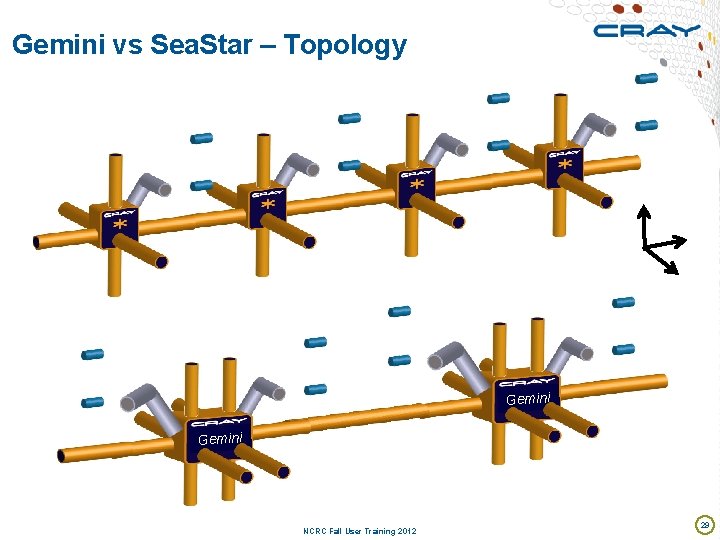
Gemini vs Sea. Star – Topology Module with Sea. Star Z Y X Gemini Module with Gemini NCRC Fall User Training 2012 29

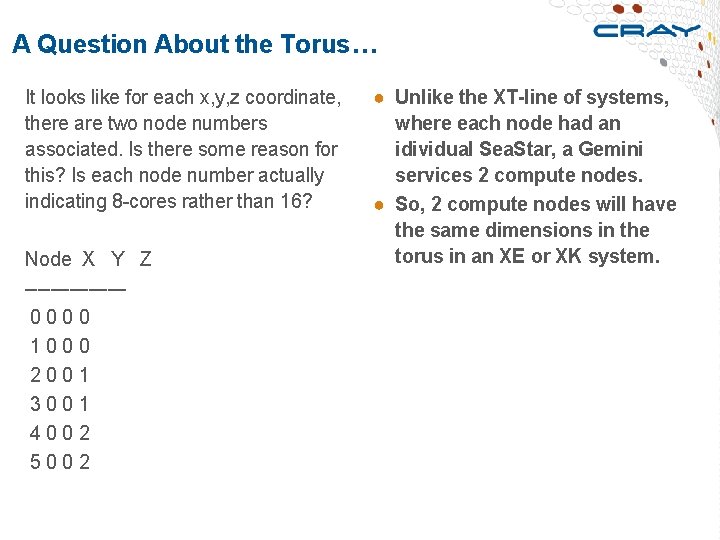
A Question About the Torus… It looks like for each x, y, z coordinate, there are two node numbers associated. Is there some reason for this? Is each node number actually indicating 8 -cores rather than 16? Node X Y Z -------- 0 0 1 0 0 0 2 0 0 1 3 0 0 1 4 0 0 2 5 0 0 2 ● Unlike the XT-line of systems, where each node had an idividual Sea. Star, a Gemini services 2 compute nodes. ● So, 2 compute nodes will have the same dimensions in the torus in an XE or XK system.

Nvidia Kepler Accelerator Some slides taken from Nvidia GTC 2012 “Inside Kepler” talk by Stephen Jones and Lars Nyland (NVIDIA ) NCRC Fall User Training 2012 31

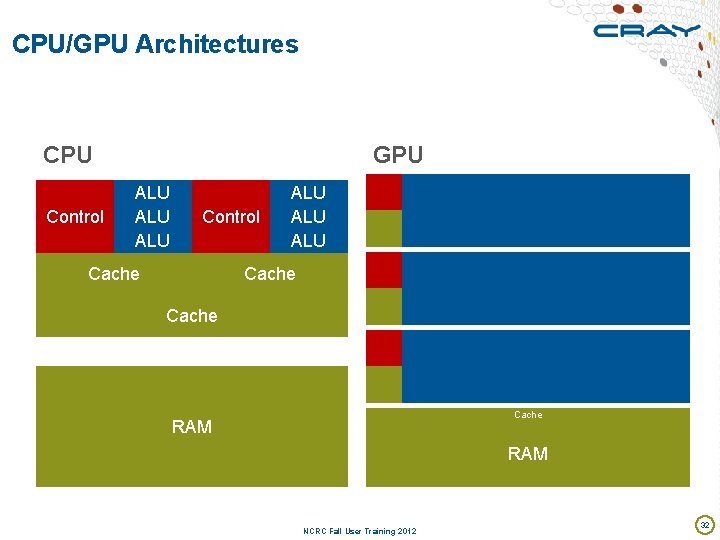
CPU/GPU Architectures CPU Control GPU ALU ALU Control Cache ALU ALU Cache RAM NCRC Fall User Training 2012 32

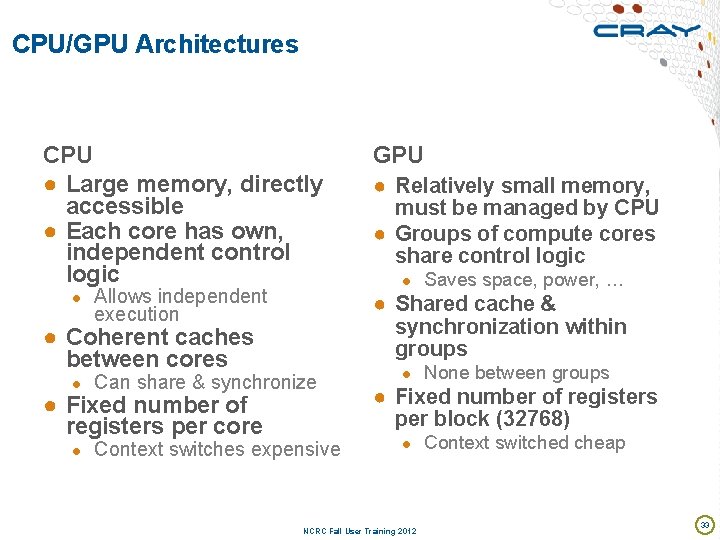
CPU/GPU Architectures CPU ● Large memory, directly accessible ● Each core has own, independent control logic ● Allows independent ● Relatively small memory, must be managed by CPU ● Groups of compute cores share control logic ● Saves space, power, … ● Shared cache & synchronization within groups execution ● Coherent caches between cores ● Can share & synchronize ● Fixed number of registers per core GPU ● Context switches expensive ● None between groups ● Fixed number of registers per block (32768) ● Context switched cheap NCRC Fall User Training 2012 33

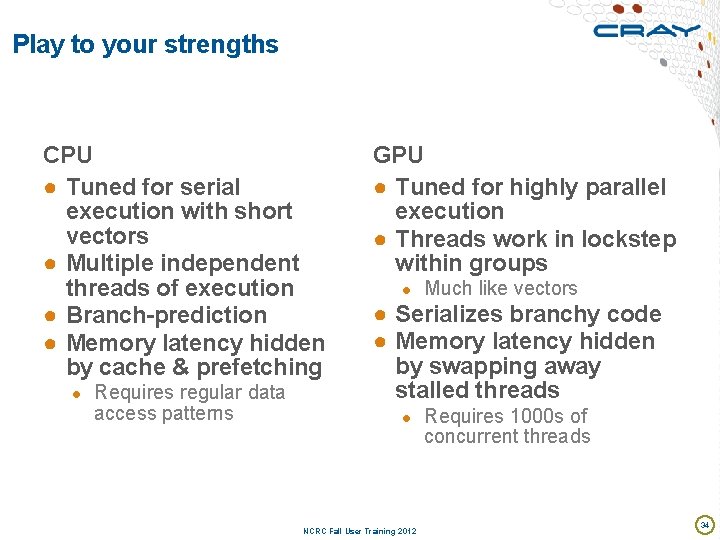
Play to your strengths CPU ● Tuned for serial execution with short vectors ● Multiple independent threads of execution ● Branch-prediction ● Memory latency hidden by cache & prefetching ● Requires regular data access patterns GPU ● Tuned for highly parallel execution ● Threads work in lockstep within groups ● Much like vectors ● Serializes branchy code ● Memory latency hidden by swapping away stalled threads ● Requires 1000 s of concurrent threads NCRC Fall User Training 2012 34

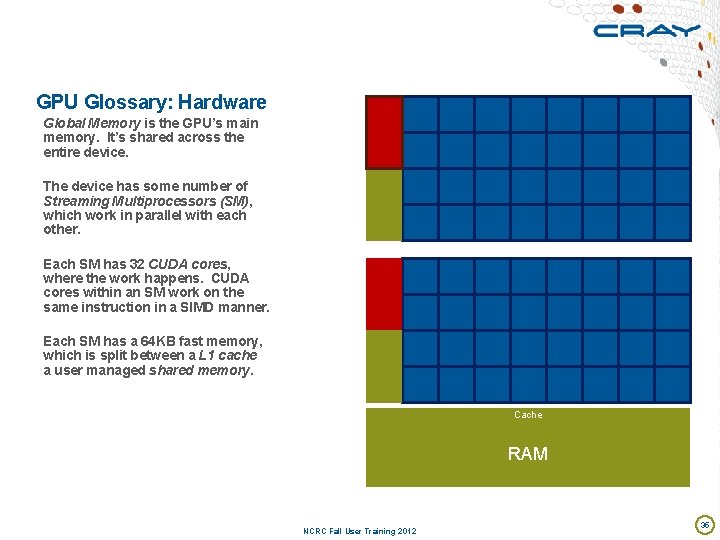
GPU Glossary: Hardware Global Memory is the GPU’s main memory. It’s shared across the entire device. The device has some number of Streaming Multiprocessors (SM), which work in parallel with each other. Each SM has 32 CUDA cores, where the work happens. CUDA cores within an SM work on the same instruction in a SIMD manner. Each SM has a 64 KB fast memory, which is split between a L 1 cache a user managed shared memory. Cache RAM NCRC Fall User Training 2012 35

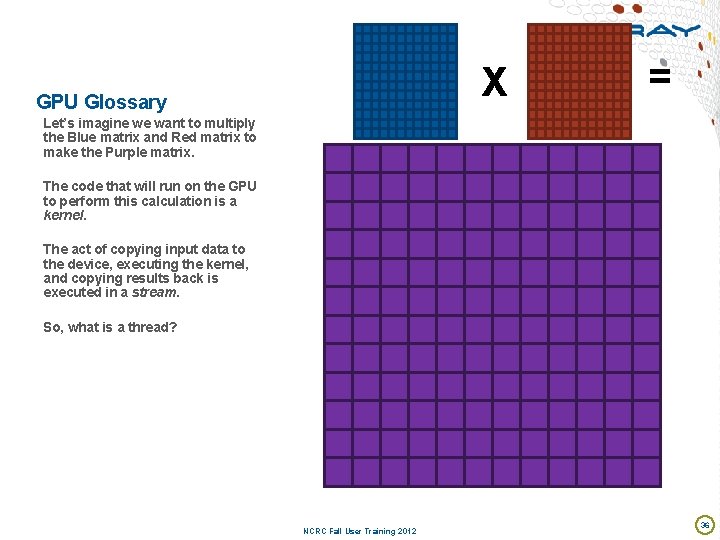
X GPU Glossary = Let’s imagine we want to multiply the Blue matrix and Red matrix to make the Purple matrix. The code that will run on the GPU to perform this calculation is a kernel. The act of copying input data to the device, executing the kernel, and copying results back is executed in a stream. So, what is a thread? NCRC Fall User Training 2012 36

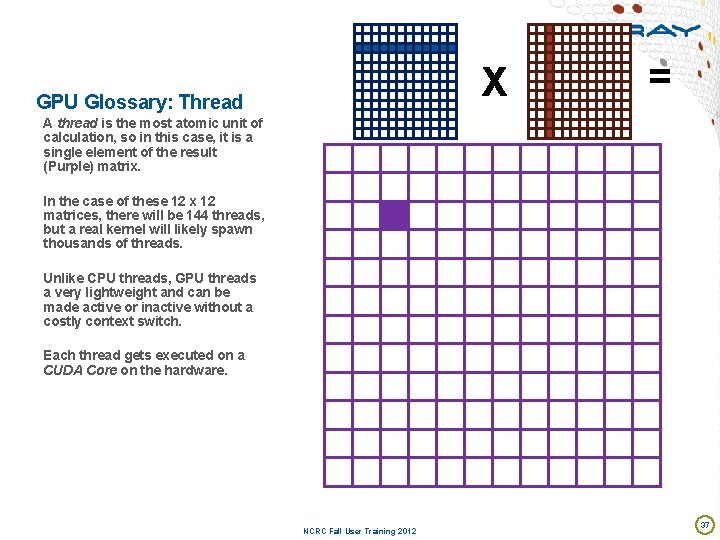
X GPU Glossary: Thread = A thread is the most atomic unit of calculation, so in this case, it is a single element of the result (Purple) matrix. In the case of these 12 x 12 matrices, there will be 144 threads, but a real kernel will likely spawn thousands of threads. Unlike CPU threads, GPU threads a very lightweight and can be made active or inactive without a costly context switch. Each thread gets executed on a CUDA Core on the hardware. NCRC Fall User Training 2012 37

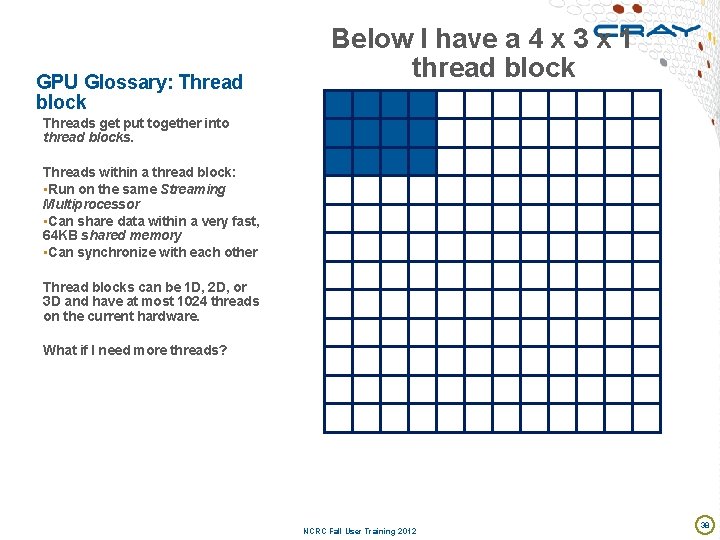
GPU Glossary: Thread block Below I have a 4 x 3 x 1 thread block Threads get put together into thread blocks. Threads within a thread block: • Run on the same Streaming Multiprocessor • Can share data within a very fast, 64 KB shared memory • Can synchronize with each other Thread blocks can be 1 D, 2 D, or 3 D and have at most 1024 threads on the current hardware. What if I need more threads? NCRC Fall User Training 2012 38

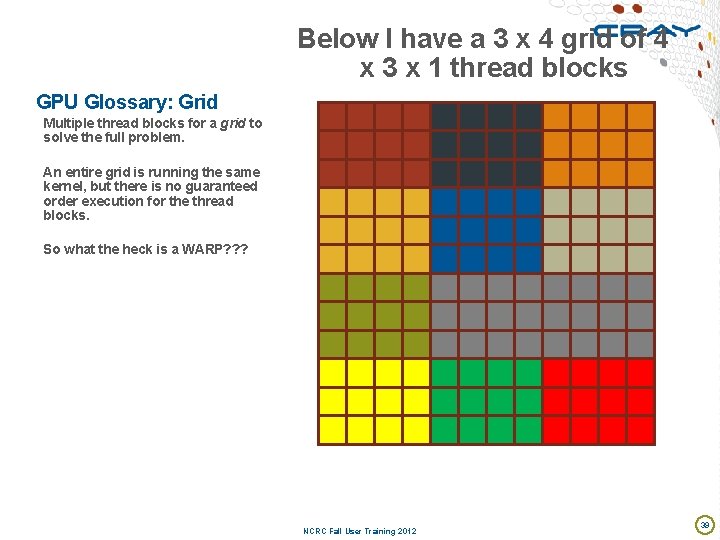
Below I have a 3 x 4 grid of 4 x 3 x 1 thread blocks GPU Glossary: Grid Multiple thread blocks for a grid to solve the full problem. An entire grid is running the same kernel, but there is no guaranteed order execution for the thread blocks. So what the heck is a WARP? ? ? NCRC Fall User Training 2012 39

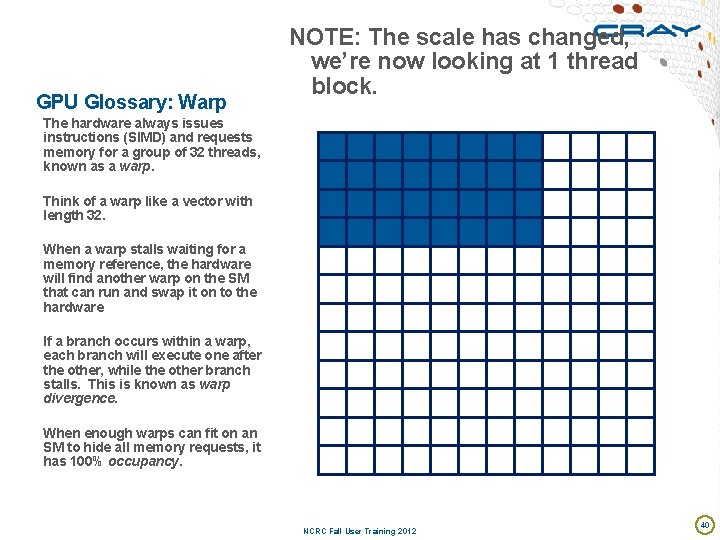
GPU Glossary: Warp NOTE: The scale has changed, we’re now looking at 1 thread block. The hardware always issues instructions (SIMD) and requests memory for a group of 32 threads, known as a warp. Think of a warp like a vector with length 32. When a warp stalls waiting for a memory reference, the hardware will find another warp on the SM that can run and swap it on to the hardware If a branch occurs within a warp, each branch will execute one after the other, while the other branch stalls. This is known as warp divergence. When enough warps can fit on an SM to hide all memory requests, it has 100% occupancy. NCRC Fall User Training 2012 40

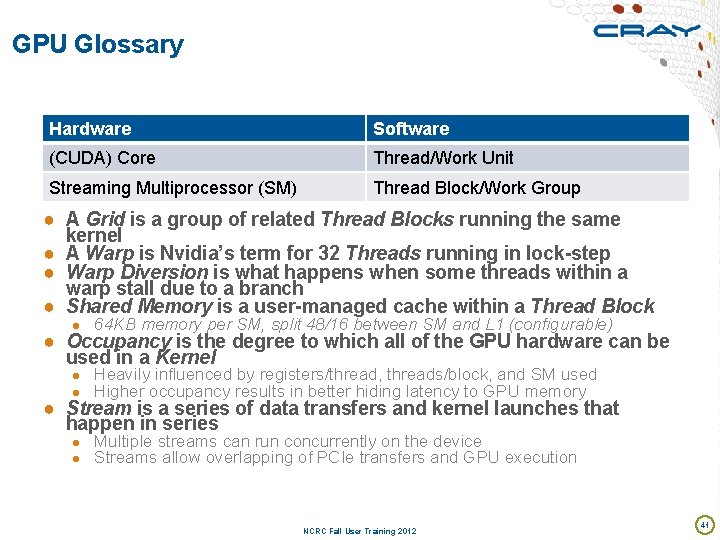
GPU Glossary Hardware Software (CUDA) Core Thread/Work Unit Streaming Multiprocessor (SM) Thread Block/Work Group ● A Grid is a group of related Thread Blocks running the same kernel ● A Warp is Nvidia’s term for 32 Threads running in lock-step ● Warp Diversion is what happens when some threads within a warp stall due to a branch ● Shared Memory is a user-managed cache within a Thread Block ● 64 KB memory per SM, split 48/16 between SM and L 1 (configurable) ● Occupancy is the degree to which all of the GPU hardware can be used in a Kernel ● Heavily influenced by registers/thread, threads/block, and SM used ● Higher occupancy results in better hiding latency to GPU memory ● Stream is a series of data transfers and kernel launches that happen in series ● Multiple streams can run concurrently on the device ● Streams allow overlapping of PCIe transfers and GPU execution NCRC Fall User Training 2012 41

Nvidia Kepler Specifics NCRC Fall User Training 2012 42

NCRC Fall User Training 2012 43

NCRC Fall User Training 2012 44

Lustre Filesystem Basics NCRC Fall User Training 2012 45

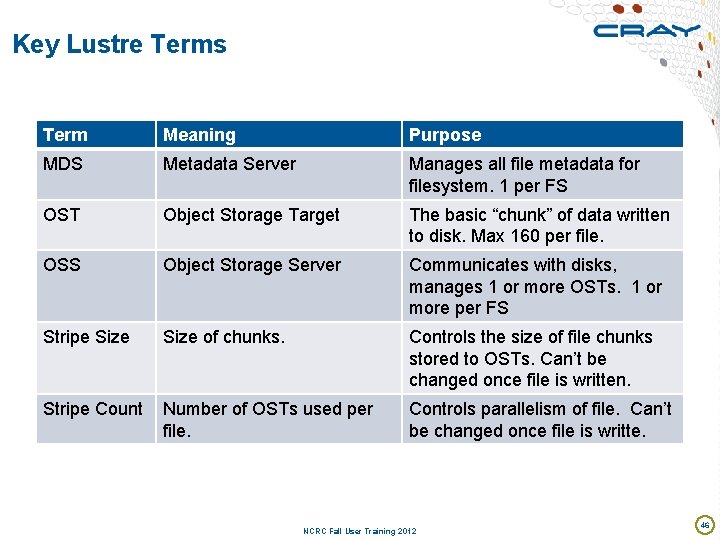
Key Lustre Terms Term Meaning Purpose MDS Metadata Server Manages all file metadata for filesystem. 1 per FS OST Object Storage Target The basic “chunk” of data written to disk. Max 160 per file. OSS Object Storage Server Communicates with disks, manages 1 or more OSTs. 1 or more per FS Stripe Size of chunks. Controls the size of file chunks stored to OSTs. Can’t be changed once file is written. Stripe Count Number of OSTs used per file. Controls parallelism of file. Can’t be changed once file is writte. NCRC Fall User Training 2012 46

Lustre File System Basics NCRC Fall User Training 2012 47

File Striping: Physical and Logical Views NCRC Fall User Training 2012 48


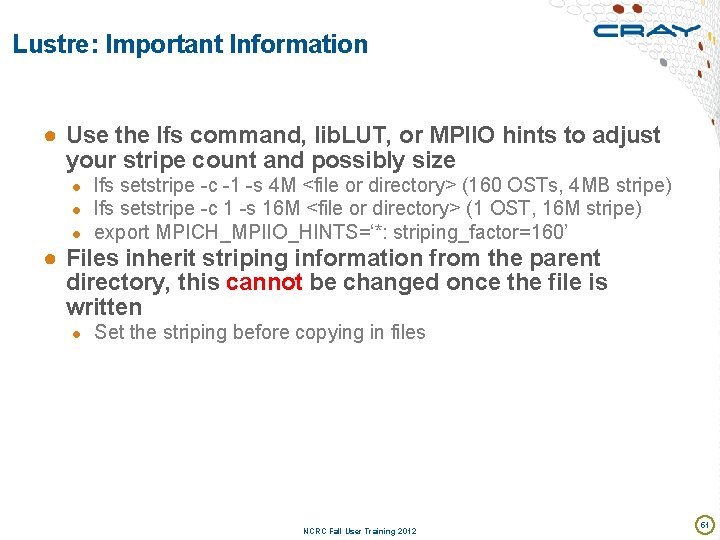
Lustre: Important Information ● Use the lfs command, lib. LUT, or MPIIO hints to adjust your stripe count and possibly size ● lfs setstripe -c -1 -s 4 M <file or directory> (160 OSTs, 4 MB stripe) ● lfs setstripe -c 1 -s 16 M <file or directory> (1 OST, 16 M stripe) ● export MPICH_MPIIO_HINTS=‘*: striping_factor=160’ ● Files inherit striping information from the parent directory, this cannot be changed once the file is written ● Set the striping before copying in files NCRC Fall User Training 2012 51

Cray Programming Environment Available Compilers Cray Scientific Libraries Cray MPICH 2 Cray Performance Tools Cray Debugging Tools

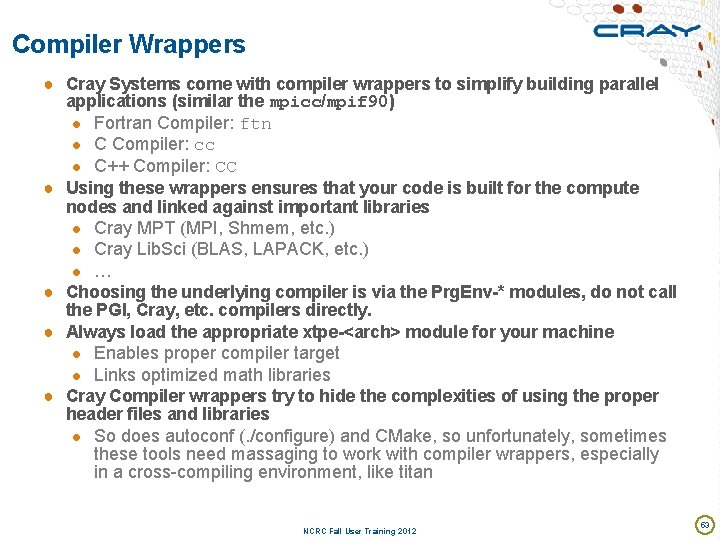
Compiler Wrappers ● Cray Systems come with compiler wrappers to simplify building parallel applications (similar the mpicc/mpif 90) ● Fortran Compiler: ftn ● C Compiler: cc ● C++ Compiler: CC ● Using these wrappers ensures that your code is built for the compute nodes and linked against important libraries ● Cray MPT (MPI, Shmem, etc. ) ● Cray Lib. Sci (BLAS, LAPACK, etc. ) ● … ● Choosing the underlying compiler is via the Prg. Env-* modules, do not call the PGI, Cray, etc. compilers directly. ● Always load the appropriate xtpe-<arch> module for your machine ● Enables proper compiler target ● Links optimized math libraries ● Cray Compiler wrappers try to hide the complexities of using the proper header files and libraries ● So does autoconf (. /configure) and CMake, so unfortunately, sometimes these tools need massaging to work with compiler wrappers, especially in a cross-compiling environment, like titan NCRC Fall User Training 2012 53

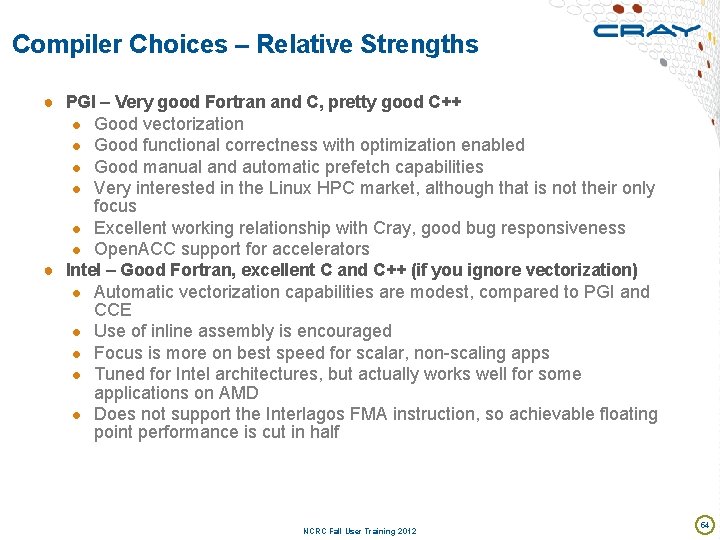
Compiler Choices – Relative Strengths …from Cray’s Perspective ● PGI – Very good Fortran and C, pretty good C++ ● Good vectorization ● Good functional correctness with optimization enabled ● Good manual and automatic prefetch capabilities ● Very interested in the Linux HPC market, although that is not their only focus ● Excellent working relationship with Cray, good bug responsiveness ● Open. ACC support for accelerators ● Intel – Good Fortran, excellent C and C++ (if you ignore vectorization) ● Automatic vectorization capabilities are modest, compared to PGI and CCE ● Use of inline assembly is encouraged ● Focus is more on best speed for scalar, non-scaling apps ● Tuned for Intel architectures, but actually works well for some applications on AMD ● Does not support the Interlagos FMA instruction, so achievable floating point performance is cut in half NCRC Fall User Training 2012 54

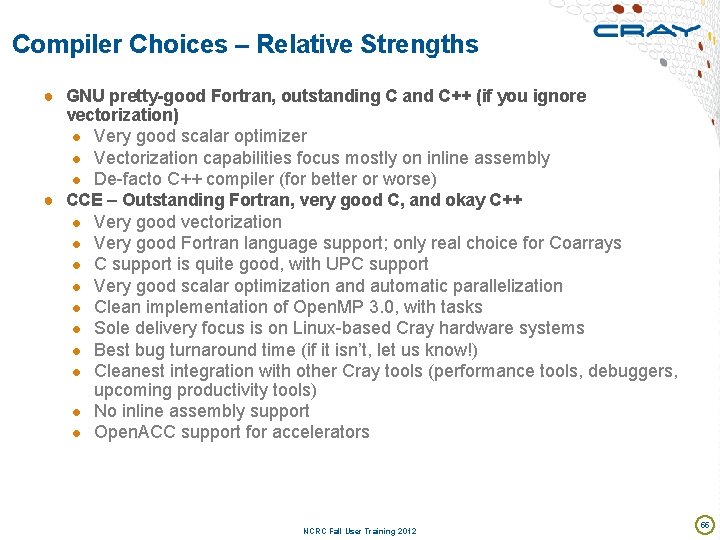
Compiler Choices – Relative Strengths …from Cray’s Perspective ● GNU pretty-good Fortran, outstanding C and C++ (if you ignore vectorization) ● Very good scalar optimizer ● Vectorization capabilities focus mostly on inline assembly ● De-facto C++ compiler (for better or worse) ● CCE – Outstanding Fortran, very good C, and okay C++ ● Very good vectorization ● Very good Fortran language support; only real choice for Coarrays ● C support is quite good, with UPC support ● Very good scalar optimization and automatic parallelization ● Clean implementation of Open. MP 3. 0, with tasks ● Sole delivery focus is on Linux-based Cray hardware systems ● Best bug turnaround time (if it isn’t, let us know!) ● Cleanest integration with other Cray tools (performance tools, debuggers, upcoming productivity tools) ● No inline assembly support ● Open. ACC support for accelerators NCRC Fall User Training 2012 55

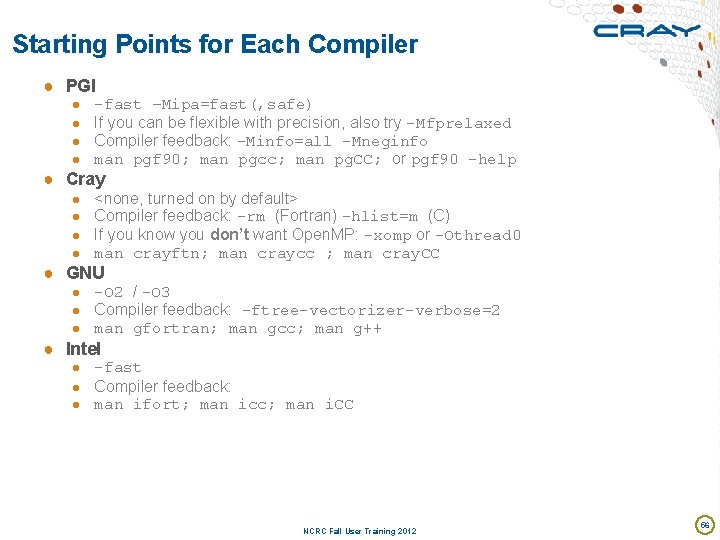
Starting Points for Each Compiler ● PGI ● ● -fast –Mipa=fast(, safe) If you can be flexible with precision, also try -Mfprelaxed Compiler feedback: -Minfo=all -Mneginfo man pgf 90; man pgcc; man pg. CC; or pgf 90 -help ● Cray ● ● <none, turned on by default> Compiler feedback: -rm (Fortran) -hlist=m (C) If you know you don’t want Open. MP: -xomp or -Othread 0 man crayftn; man craycc ; man cray. CC ● GNU ● -O 2 / -O 3 ● Compiler feedback: -ftree-vectorizer-verbose=2 ● man gfortran; man gcc; man g++ ● Intel ● -fast ● Compiler feedback: ● man ifort; man icc; man i. CC NCRC Fall User Training 2012 56

PGI Compiler NCRC Fall User Training 2012 57

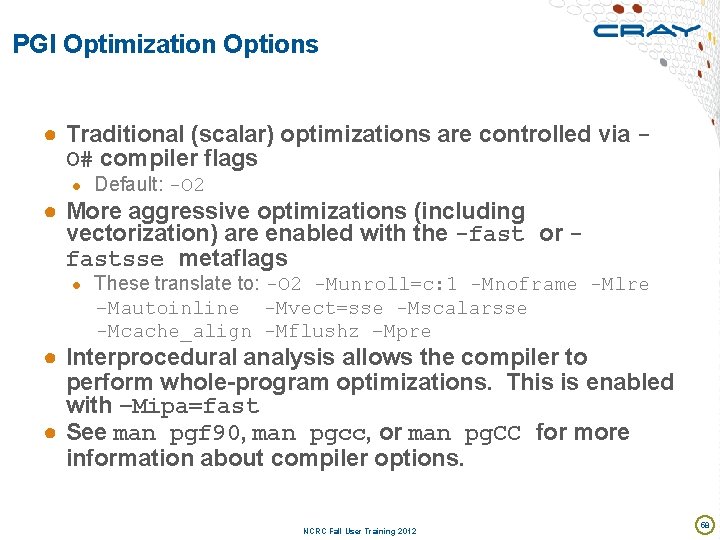
PGI Optimization Options ● Traditional (scalar) optimizations are controlled via O# compiler flags ● Default: -O 2 ● More aggressive optimizations (including vectorization) are enabled with the -fast or fastsse metaflags ● These translate to: -O 2 -Munroll=c: 1 -Mnoframe -Mlre –Mautoinline -Mvect=sse -Mscalarsse -Mcache_align -Mflushz –Mpre ● Interprocedural analysis allows the compiler to perform whole-program optimizations. This is enabled with –Mipa=fast ● See man pgf 90, man pgcc, or man pg. CC for more information about compiler options. NCRC Fall User Training 2012 58

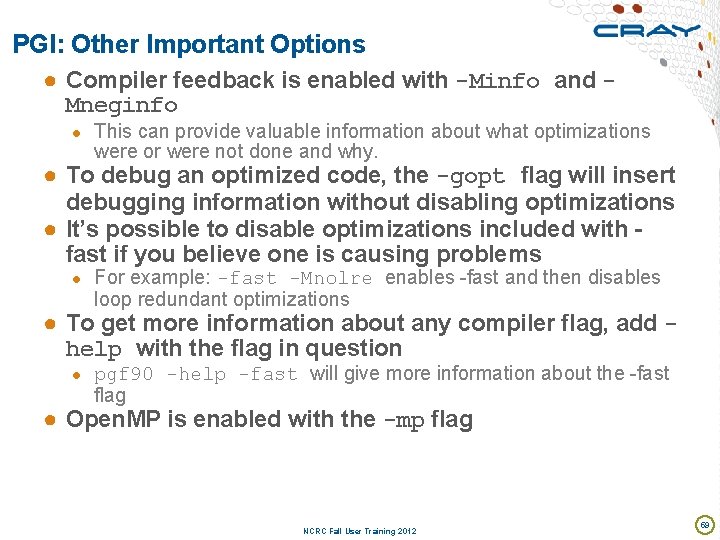
PGI: Other Important Options ● Compiler feedback is enabled with -Minfo and Mneginfo ● This can provide valuable information about what optimizations were or were not done and why. ● To debug an optimized code, the -gopt flag will insert debugging information without disabling optimizations ● It’s possible to disable optimizations included with fast if you believe one is causing problems ● For example: -fast -Mnolre enables -fast and then disables loop redundant optimizations ● To get more information about any compiler flag, add help with the flag in question ● pgf 90 -help -fast will give more information about the -fast flag ● Open. MP is enabled with the -mp flag NCRC Fall User Training 2012 59

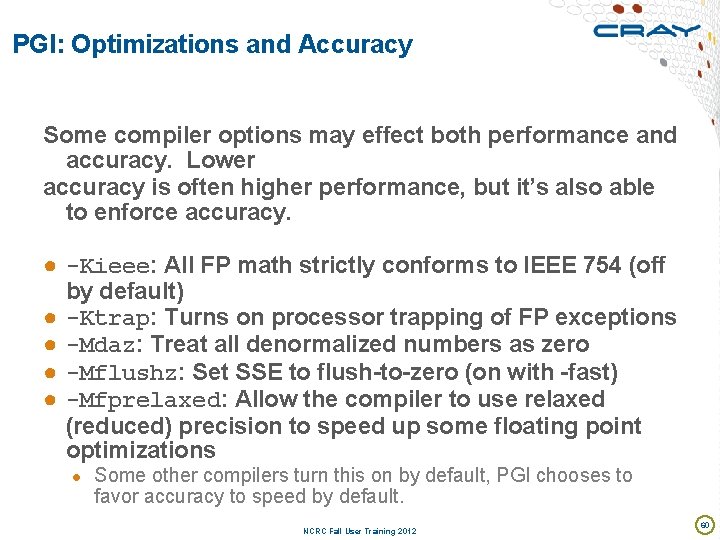
PGI: Optimizations and Accuracy Some compiler options may effect both performance and accuracy. Lower accuracy is often higher performance, but it’s also able to enforce accuracy. ● -Kieee: All FP math strictly conforms to IEEE 754 (off by default) ● -Ktrap: Turns on processor trapping of FP exceptions ● -Mdaz: Treat all denormalized numbers as zero ● -Mflushz: Set SSE to flush-to-zero (on with -fast) ● -Mfprelaxed: Allow the compiler to use relaxed (reduced) precision to speed up some floating point optimizations ● Some other compilers turn this on by default, PGI chooses to favor accuracy to speed by default. NCRC Fall User Training 2012 60

Cray Compiler Environment NCRC Fall User Training 2012 61

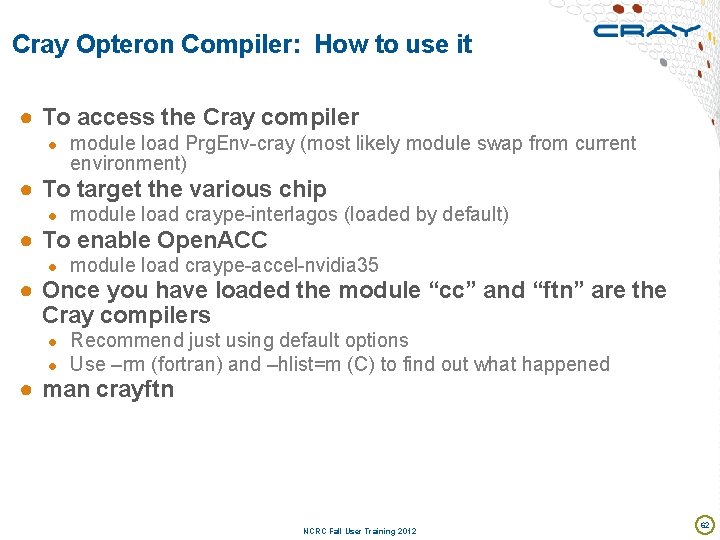
Cray Opteron Compiler: How to use it ● To access the Cray compiler ● module load Prg. Env-cray (most likely module swap from current environment) ● To target the various chip ● module load craype-interlagos (loaded by default) ● To enable Open. ACC ● module load craype-accel-nvidia 35 ● Once you have loaded the module “cc” and “ftn” are the Cray compilers ● Recommend just using default options ● Use –rm (fortran) and –hlist=m (C) to find out what happened ● man crayftn NCRC Fall User Training 2012 62

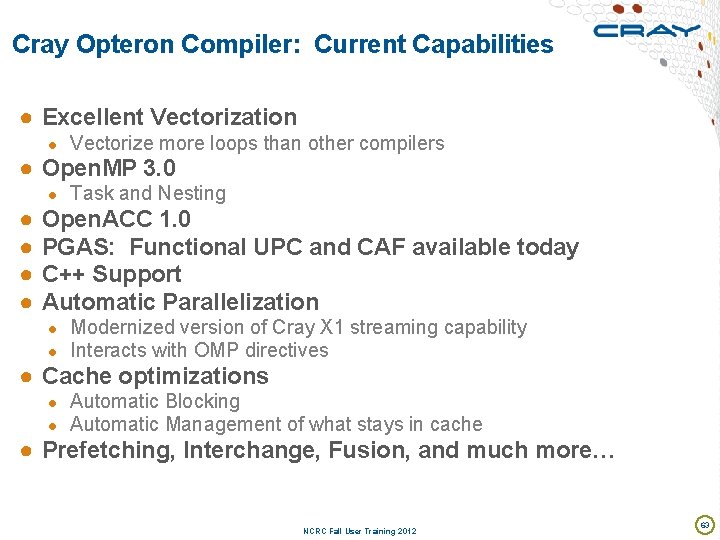
Cray Opteron Compiler: Current Capabilities ● Excellent Vectorization ● Vectorize more loops than other compilers ● Open. MP 3. 0 ● ● ● Task and Nesting Open. ACC 1. 0 PGAS: Functional UPC and CAF available today C++ Support Automatic Parallelization ● Modernized version of Cray X 1 streaming capability ● Interacts with OMP directives ● Cache optimizations ● Automatic Blocking ● Automatic Management of what stays in cache ● Prefetching, Interchange, Fusion, and much more… NCRC Fall User Training 2012 63

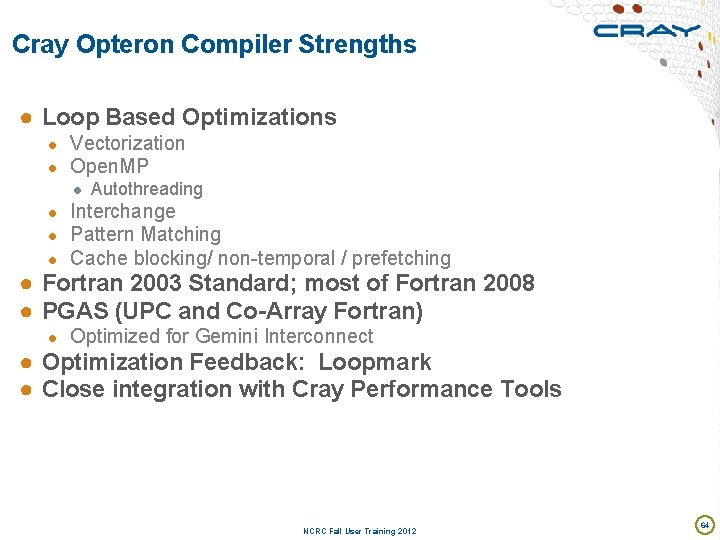
Cray Opteron Compiler Strengths ● Loop Based Optimizations ● Vectorization ● Open. MP ● Autothreading ● Interchange ● Pattern Matching ● Cache blocking/ non-temporal / prefetching ● Fortran 2003 Standard; most of Fortran 2008 ● PGAS (UPC and Co-Array Fortran) ● Optimized for Gemini Interconnect ● Optimization Feedback: Loopmark ● Close integration with Cray Performance Tools NCRC Fall User Training 2012 64

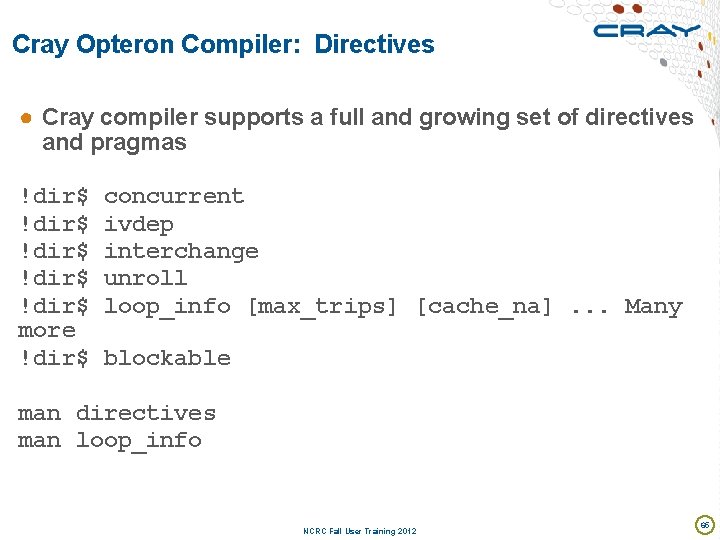
Cray Opteron Compiler: Directives ● Cray compiler supports a full and growing set of directives and pragmas !dir$ concurrent !dir$ ivdep !dir$ interchange !dir$ unroll !dir$ loop_info [max_trips] [cache_na]. . . Many more !dir$ blockable man directives man loop_info NCRC Fall User Training 2012 65

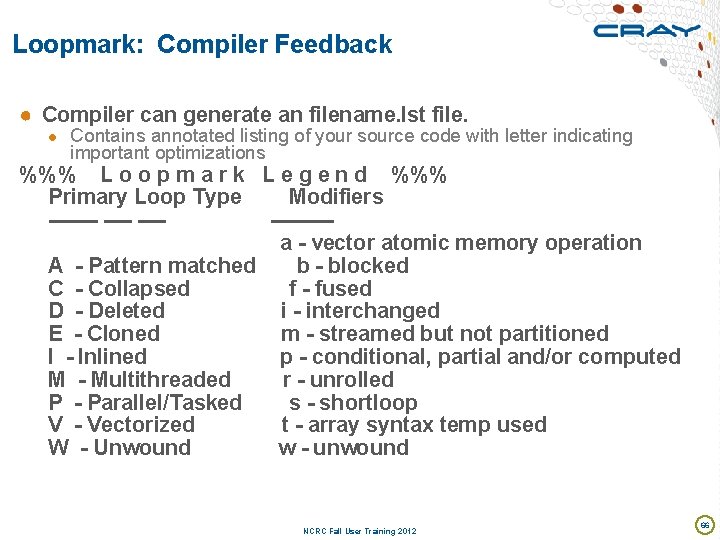
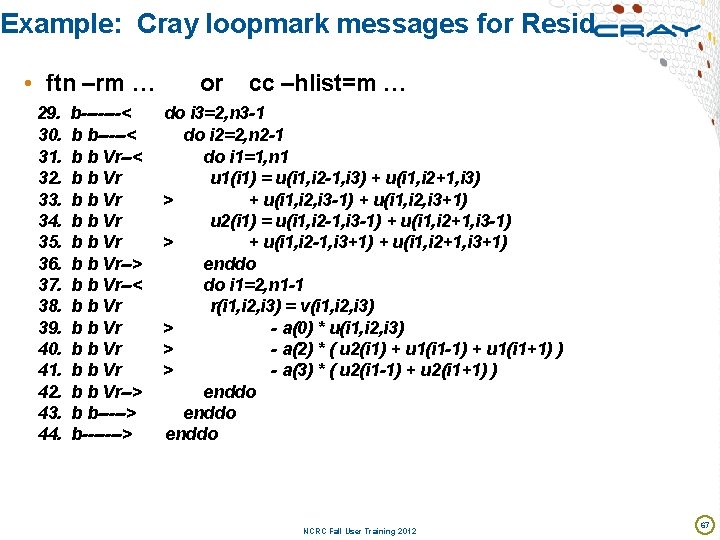
Loopmark: Compiler Feedback ● Compiler can generate an filename. lst file. ● Contains annotated listing of your source code with letter indicating important optimizations %%% L o o p m a r k L e g e n d %%% Primary Loop Type Modifiers ------- ---- a - vector atomic memory operation A - Pattern matched b - blocked C - Collapsed f - fused D - Deleted i - interchanged E - Cloned m - streamed but not partitioned I - Inlined p - conditional, partial and/or computed M - Multithreaded r - unrolled P - Parallel/Tasked s - shortloop V - Vectorized t - array syntax temp used W - Unwound w - unwound NCRC Fall User Training 2012 66

Example: Cray loopmark messages for Resid • ftn –rm … or cc –hlist=m … 29. 30. 31. 32. 33. 34. 35. 36. 37. 38. 39. 40. 41. 42. 43. 44. b-------< b b Vr--< b b Vr b b Vr b b Vr--> b b-----> b-------> do i 3=2, n 3 -1 do i 2=2, n 2 -1 do i 1=1, n 1 u 1(i 1) = u(i 1, i 2 -1, i 3) + u(i 1, i 2+1, i 3) > + u(i 1, i 2, i 3 -1) + u(i 1, i 2, i 3+1) u 2(i 1) = u(i 1, i 2 -1, i 3 -1) + u(i 1, i 2+1, i 3 -1) > + u(i 1, i 2 -1, i 3+1) + u(i 1, i 2+1, i 3+1) enddo do i 1=2, n 1 -1 r(i 1, i 2, i 3) = v(i 1, i 2, i 3) > - a(0) * u(i 1, i 2, i 3) > - a(2) * ( u 2(i 1) + u 1(i 1 -1) + u 1(i 1+1) ) > - a(3) * ( u 2(i 1 -1) + u 2(i 1+1) ) enddo NCRC Fall User Training 2012 67

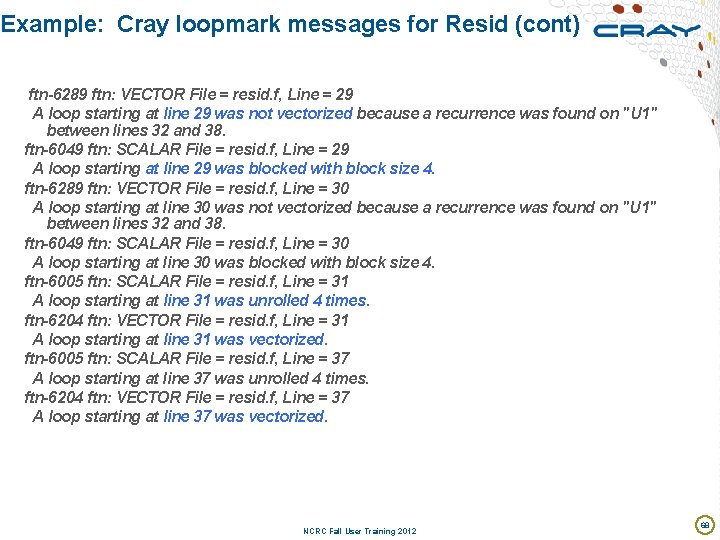
Example: Cray loopmark messages for Resid (cont) ftn-6289 ftn: VECTOR File = resid. f, Line = 29 A loop starting at line 29 was not vectorized because a recurrence was found on "U 1" between lines 32 and 38. ftn-6049 ftn: SCALAR File = resid. f, Line = 29 A loop starting at line 29 was blocked with block size 4. ftn-6289 ftn: VECTOR File = resid. f, Line = 30 A loop starting at line 30 was not vectorized because a recurrence was found on "U 1" between lines 32 and 38. ftn-6049 ftn: SCALAR File = resid. f, Line = 30 A loop starting at line 30 was blocked with block size 4. ftn-6005 ftn: SCALAR File = resid. f, Line = 31 A loop starting at line 31 was unrolled 4 times. ftn-6204 ftn: VECTOR File = resid. f, Line = 31 A loop starting at line 31 was vectorized. ftn-6005 ftn: SCALAR File = resid. f, Line = 37 A loop starting at line 37 was unrolled 4 times. ftn-6204 ftn: VECTOR File = resid. f, Line = 37 A loop starting at line 37 was vectorized. NCRC Fall User Training 2012 68

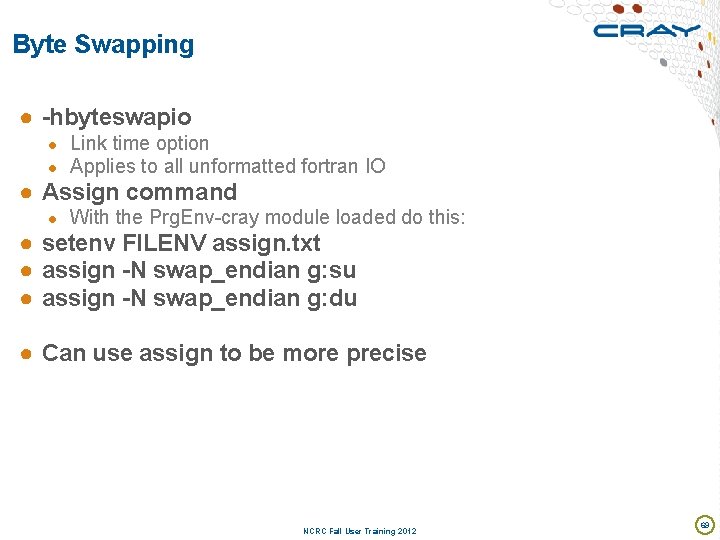
Byte Swapping ● -hbyteswapio ● Link time option ● Applies to all unformatted fortran IO ● Assign command ● With the Prg. Env-cray module loaded do this: ● setenv FILENV assign. txt ● assign -N swap_endian g: su ● assign -N swap_endian g: du ● Can use assign to be more precise NCRC Fall User Training 2012 69

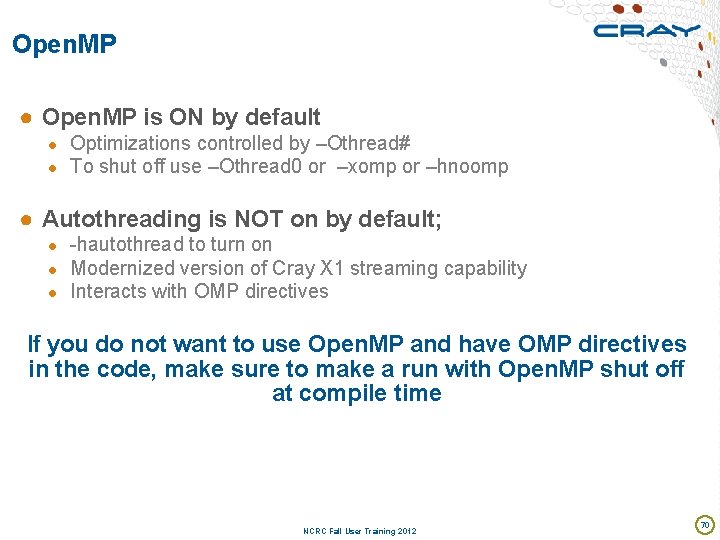
Open. MP ● Open. MP is ON by default ● Optimizations controlled by –Othread# ● To shut off use –Othread 0 or –xomp or –hnoomp ● Autothreading is NOT on by default; ● -hautothread to turn on ● Modernized version of Cray X 1 streaming capability ● Interacts with OMP directives If you do not want to use Open. MP and have OMP directives in the code, make sure to make a run with Open. MP shut off at compile time NCRC Fall User Training 2012 70

Cray Scientific Libraries (Libsci) NCRC Fall User Training 2012 71

What are libraries for? ● ● ● Building blocks for writing scientific applications Historically – allowed the first forms of code re-use Later – became ways of running optimized code These days the complexity of the hardware is very high Cray PE insulates the user from that complexity ● ● ● Cray module environment CCE Performance tools Tuned MPI libraries (+PGAS) Optimized Scientific libraries ● Cray scientific libraries are designed to give maximum possible performance from Cray systems with minimum effort NCRC Fall User Training 2012 72

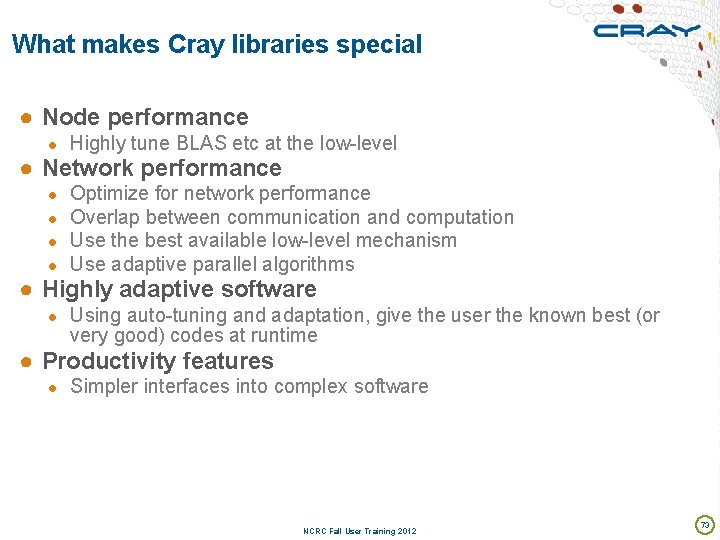
What makes Cray libraries special ● Node performance ● Highly tune BLAS etc at the low-level ● Network performance ● ● Optimize for network performance Overlap between communication and computation Use the best available low-level mechanism Use adaptive parallel algorithms ● Highly adaptive software ● Using auto-tuning and adaptation, give the user the known best (or very good) codes at runtime ● Productivity features ● Simpler interfaces into complex software NCRC Fall User Training 2012 73

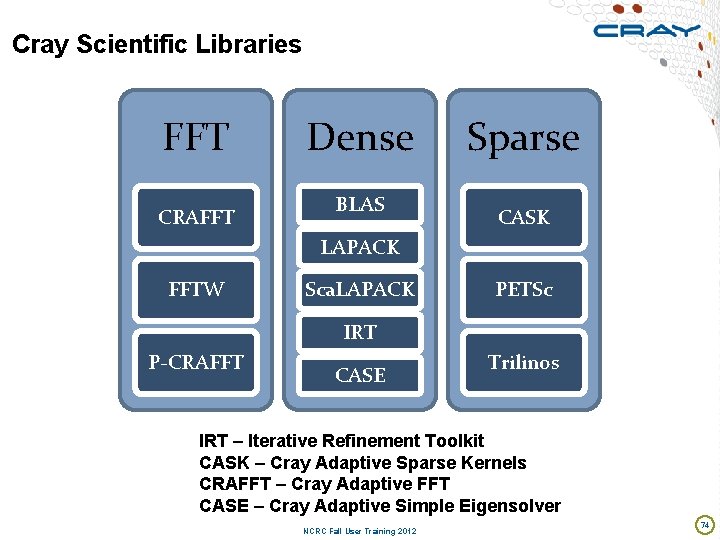
Cray Scientific Libraries FFT CRAFFT Dense BLAS Sparse CASK LAPACK FFTW Sca. LAPACK PETSc IRT P-CRAFFT CASE Trilinos IRT – Iterative Refinement Toolkit CASK – Cray Adaptive Sparse Kernels CRAFFT – Cray Adaptive FFT CASE – Cray Adaptive Simple Eigensolver NCRC Fall User Training 2012 74

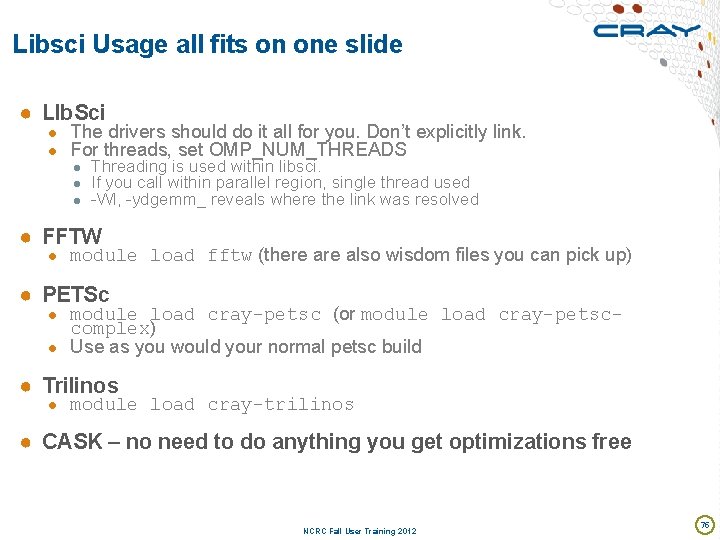
Libsci Usage all fits on one slide ● LIb. Sci ● The drivers should do it all for you. Don’t explicitly link. ● For threads, set OMP_NUM_THREADS ● Threading is used within libsci. ● If you call within parallel region, single thread used ● -Wl, -ydgemm_ reveals where the link was resolved ● FFTW ● module load fftw (there also wisdom files you can pick up) ● PETSc ● module load cray-petsc (or module load cray-petsc- complex) ● Use as you would your normal petsc build ● Trilinos ● module load cray-trilinos ● CASK – no need to do anything you get optimizations free NCRC Fall User Training 2012 75

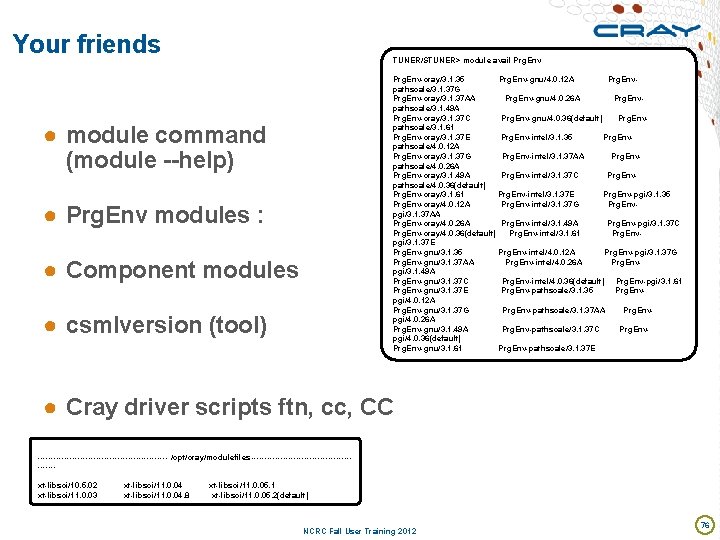
Your friends TUNER/STUNER> module avail Prg. Env-cray/3. 1. 35 Prg. Env-gnu/4. 0. 12 A Prg. Envpathscale/3. 1. 37 G Prg. Env-cray/3. 1. 37 AA Prg. Env-gnu/4. 0. 26 A Prg. Envpathscale/3. 1. 49 A Prg. Env-cray/3. 1. 37 C Prg. Env-gnu/4. 0. 36(default) Prg. Envpathscale/3. 1. 61 Prg. Env-cray/3. 1. 37 E Prg. Env-intel/3. 1. 35 Prg. Envpathscale/4. 0. 12 A Prg. Env-cray/3. 1. 37 G Prg. Env-intel/3. 1. 37 AA Prg. Envpathscale/4. 0. 26 A Prg. Env-cray/3. 1. 49 A Prg. Env-intel/3. 1. 37 C Prg. Envpathscale/4. 0. 36(default) Prg. Env-cray/3. 1. 61 Prg. Env-intel/3. 1. 37 E Prg. Env-pgi/3. 1. 35 Prg. Env-cray/4. 0. 12 A Prg. Env-intel/3. 1. 37 G Prg. Envpgi/3. 1. 37 AA Prg. Env-cray/4. 0. 26 A Prg. Env-intel/3. 1. 49 A Prg. Env-pgi/3. 1. 37 C Prg. Env-cray/4. 0. 36(default) Prg. Env-intel/3. 1. 61 Prg. Envpgi/3. 1. 37 E Prg. Env-gnu/3. 1. 35 Prg. Env-intel/4. 0. 12 A Prg. Env-pgi/3. 1. 37 G Prg. Env-gnu/3. 1. 37 AA Prg. Env-intel/4. 0. 26 A Prg. Envpgi/3. 1. 49 A Prg. Env-gnu/3. 1. 37 C Prg. Env-intel/4. 0. 36(default) Prg. Env-pgi/3. 1. 61 Prg. Env-gnu/3. 1. 37 E Prg. Env-pathscale/3. 1. 35 Prg. Envpgi/4. 0. 12 A Prg. Env-gnu/3. 1. 37 G Prg. Env-pathscale/3. 1. 37 AA Prg. Envpgi/4. 0. 26 A Prg. Env-gnu/3. 1. 49 A Prg. Env-pathscale/3. 1. 37 C Prg. Envpgi/4. 0. 36(default) Prg. Env-gnu/3. 1. 61 Prg. Env-pathscale/3. 1. 37 E ● module command (module --help) ● Prg. Env modules : ● Component modules ● csmlversion (tool) ● Cray driver scripts ftn, cc, CC ------------------------- /opt/cray/modulefiles ----------------------xt-libsci/10. 5. 02 xt-libsci/11. 0. 04 xt-libsci/11. 0. 05. 1 xt-libsci/11. 0. 03 xt-libsci/11. 0. 04. 8 xt-libsci/11. 0. 05. 2(default) NCRC Fall User Training 2012 76

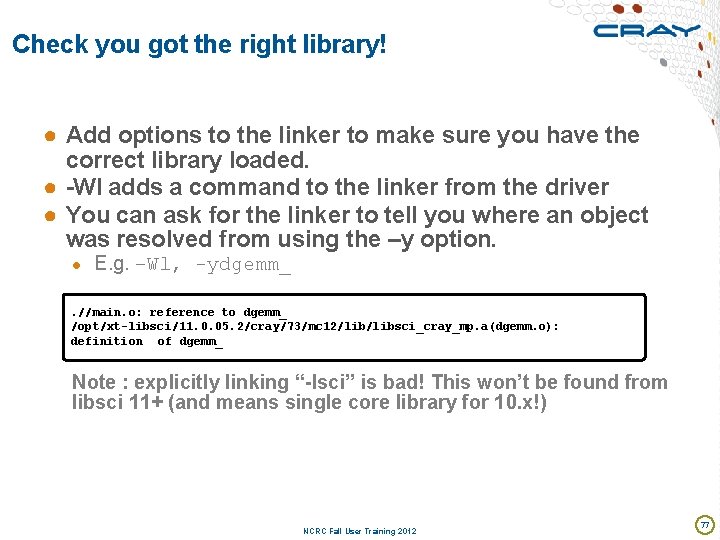
Check you got the right library! ● Add options to the linker to make sure you have the correct library loaded. ● -Wl adds a command to the linker from the driver ● You can ask for the linker to tell you where an object was resolved from using the –y option. ● E. g. –Wl, -ydgemm_ . //main. o: reference to dgemm_ /opt/xt-libsci/11. 0. 05. 2/cray/73/mc 12/libsci_cray_mp. a(dgemm. o): definition of dgemm_ Note : explicitly linking “-lsci” is bad! This won’t be found from libsci 11+ (and means single core library for 10. x!) NCRC Fall User Training 2012 77

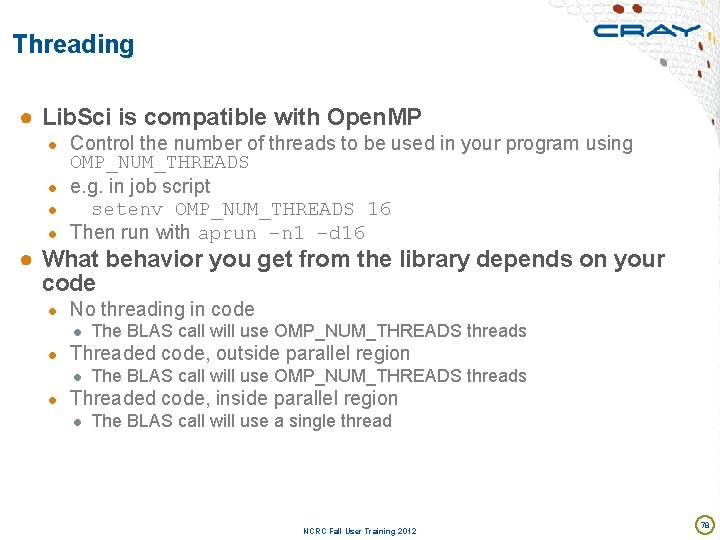
Threading ● Lib. Sci is compatible with Open. MP ● Control the number of threads to be used in your program using OMP_NUM_THREADS ● e. g. in job script ● setenv OMP_NUM_THREADS 16 ● Then run with aprun –n 1 –d 16 ● What behavior you get from the library depends on your code ● No threading in code ● The BLAS call will use OMP_NUM_THREADS threads ● Threaded code, outside parallel region ● The BLAS call will use OMP_NUM_THREADS threads ● Threaded code, inside parallel region ● The BLAS call will use a single thread NCRC Fall User Training 2012 78

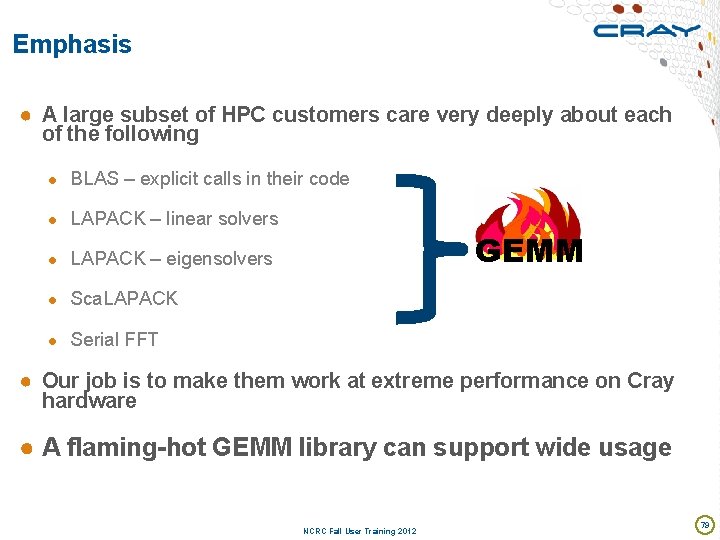
Emphasis ● A large subset of HPC customers care very deeply about each of the following ● BLAS – explicit calls in their code ● LAPACK – linear solvers GEMM ● LAPACK – eigensolvers ● Sca. LAPACK ● Serial FFT ● Our job is to make them work at extreme performance on Cray hardware ● A flaming-hot GEMM library can support wide usage NCRC Fall User Training 2012 79

Threaded LAPACK ● Threaded LAPACK works exactly the same as threaded BLAS ● Anywhere LAPACK uses BLAS, those BLAS can be threaded ● Some LAPACK routines are threaded at the higher level ● No special instructions NCRC Fall User Training 2012 80

Sca. LAPACK ● Sca. LAPACK in libsci is optimized for Gemini interconnect ● New collective communication procedures are added ● Default topologies are changed to use the new optimizations ● Much better strong scaling ● It also benefits from the optimizations in Cray. BLAS ● IRT can provide further improvements (see later) NCRC Fall User Training 2012 81

Iterative Refinement Toolkit ● Mixed precision can yield a big win on x 86 machines. ● SSE (and AVX) units issue double the number of single precision operations per cycle. ● On CPU, single precision is always 2 x as fast as double ● Accelerators sometimes have a bigger ratio ● Cell – 10 x ● Older NVIDIA cards – 7 x ● New NVIDIA cards (2 x ) ● Newer AMD cards ( > 2 x ) ● IRT is a suite of tools to help exploit single precision ● A library for direct solvers ● An automatic framework to use mixed precision under the covers NCRC Fall User Training 2012 82

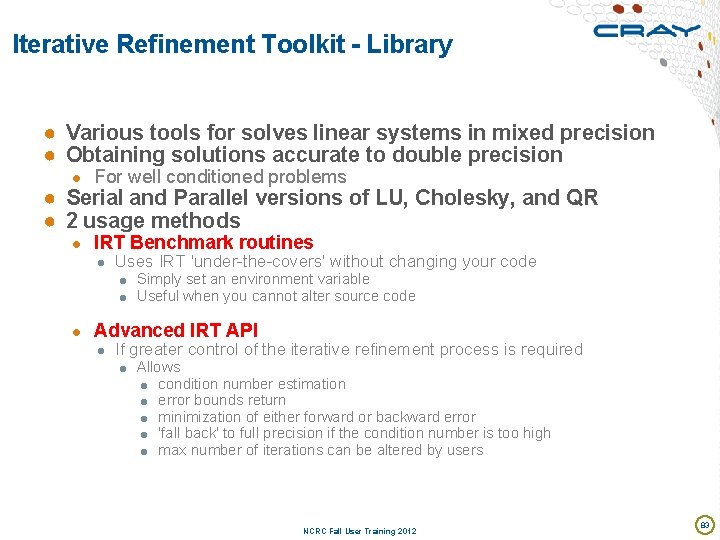
Iterative Refinement Toolkit - Library ● Various tools for solves linear systems in mixed precision ● Obtaining solutions accurate to double precision ● For well conditioned problems ● Serial and Parallel versions of LU, Cholesky, and QR ● 2 usage methods ● IRT Benchmark routines ● Uses IRT 'under-the-covers' without changing your code ● Simply set an environment variable ● Useful when you cannot alter source code ● Advanced IRT API ● If greater control of the iterative refinement process is required ● Allows ● condition number estimation ● error bounds return ● minimization of either forward or backward error ● 'fall back' to full precision if the condition number is too high ● max number of iterations can be altered by users NCRC Fall User Training 2012 83

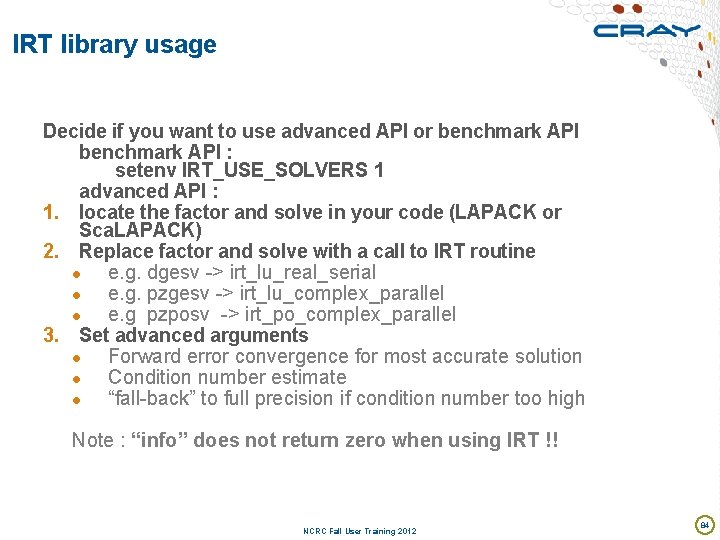
IRT library usage Decide if you want to use advanced API or benchmark API : setenv IRT_USE_SOLVERS 1 advanced API : 1. locate the factor and solve in your code (LAPACK or Sca. LAPACK) 2. Replace factor and solve with a call to IRT routine ● e. g. dgesv -> irt_lu_real_serial ● e. g. pzgesv -> irt_lu_complex_parallel ● e. g pzposv -> irt_po_complex_parallel 3. Set advanced arguments ● Forward error convergence for most accurate solution ● Condition number estimate ● “fall-back” to full precision if condition number too high Note : “info” does not return zero when using IRT !! NCRC Fall User Training 2012 84


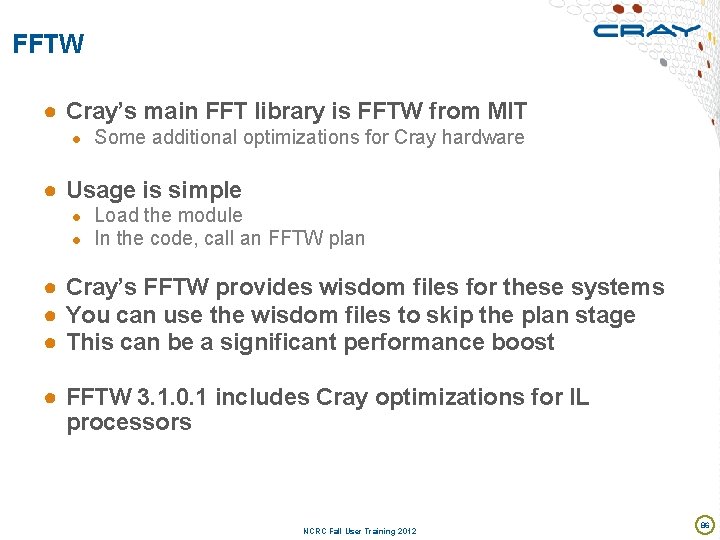
FFTW ● Cray’s main FFT library is FFTW from MIT ● Some additional optimizations for Cray hardware ● Usage is simple ● Load the module ● In the code, call an FFTW plan ● Cray’s FFTW provides wisdom files for these systems ● You can use the wisdom files to skip the plan stage ● This can be a significant performance boost ● FFTW 3. 1. 0. 1 includes Cray optimizations for IL processors NCRC Fall User Training 2012 86

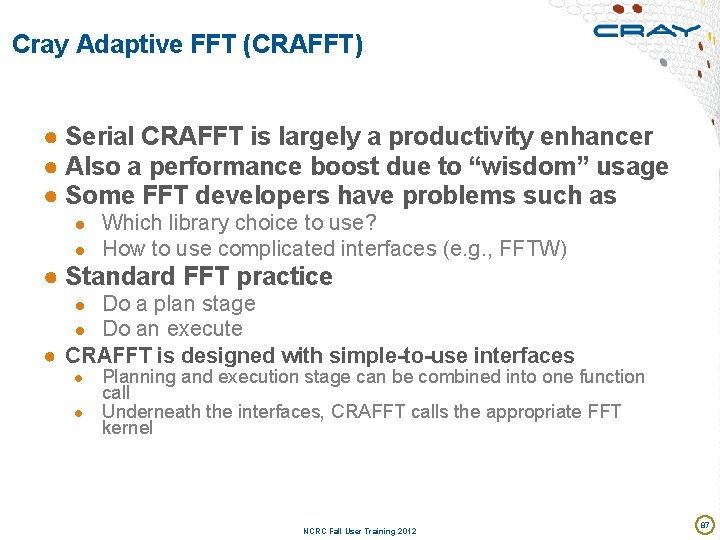
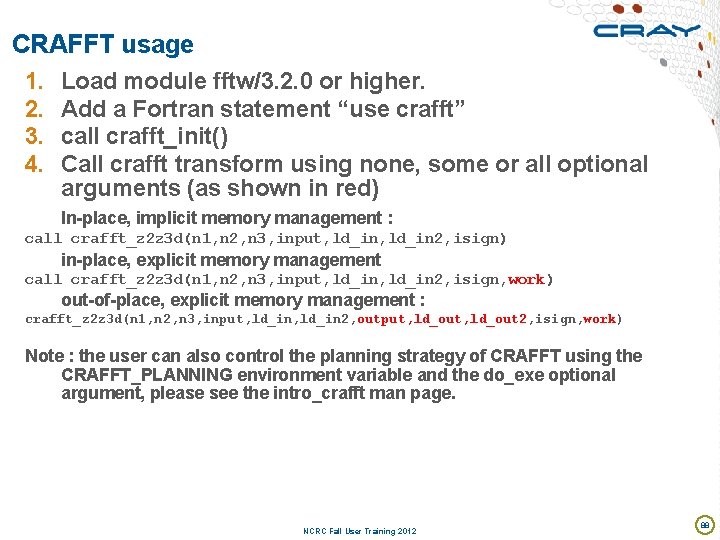
Cray Adaptive FFT (CRAFFT) ● Serial CRAFFT is largely a productivity enhancer ● Also a performance boost due to “wisdom” usage ● Some FFT developers have problems such as ● Which library choice to use? ● How to use complicated interfaces (e. g. , FFTW) ● Standard FFT practice ● Do a plan stage ● Do an execute ● CRAFFT is designed with simple-to-use interfaces Planning and execution stage can be combined into one function call ● Underneath the interfaces, CRAFFT calls the appropriate FFT kernel ● NCRC Fall User Training 2012 87

CRAFFT usage 1. 2. 3. 4. Load module fftw/3. 2. 0 or higher. Add a Fortran statement “use crafft” call crafft_init() Call crafft transform using none, some or all optional arguments (as shown in red) In-place, implicit memory management : call crafft_z 2 z 3 d(n 1, n 2, n 3, input, ld_in 2, isign) in-place, explicit memory management call crafft_z 2 z 3 d(n 1, n 2, n 3, input, ld_in 2, isign, work) out-of-place, explicit memory management : crafft_z 2 z 3 d(n 1, n 2, n 3, input, ld_in 2, output, ld_out 2, isign, work) Note : the user can also control the planning strategy of CRAFFT using the CRAFFT_PLANNING environment variable and the do_exe optional argument, please see the intro_crafft man page. NCRC Fall User Training 2012 88

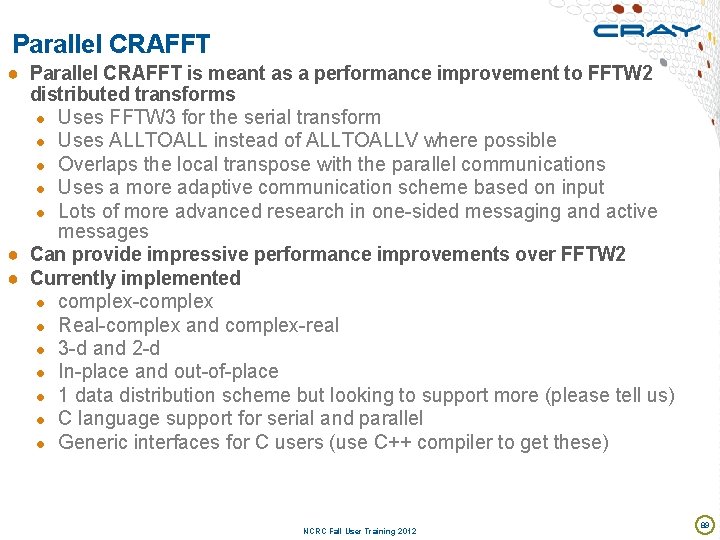
Parallel CRAFFT ● Parallel CRAFFT is meant as a performance improvement to FFTW 2 distributed transforms ● Uses FFTW 3 for the serial transform ● Uses ALLTOALL instead of ALLTOALLV where possible ● Overlaps the local transpose with the parallel communications ● Uses a more adaptive communication scheme based on input ● Lots of more advanced research in one-sided messaging and active messages ● Can provide impressive performance improvements over FFTW 2 ● Currently implemented ● complex-complex ● Real-complex and complex-real ● 3 -d and 2 -d ● In-place and out-of-place ● 1 data distribution scheme but looking to support more (please tell us) ● C language support for serial and parallel ● Generic interfaces for C users (use C++ compiler to get these) NCRC Fall User Training 2012 89

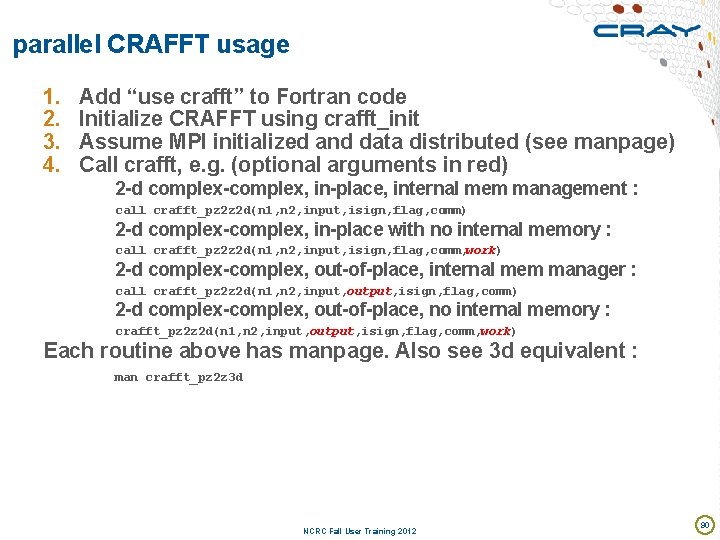
parallel CRAFFT usage 1. 2. 3. 4. Add “use crafft” to Fortran code Initialize CRAFFT using crafft_init Assume MPI initialized and data distributed (see manpage) Call crafft, e. g. (optional arguments in red) 2 -d complex-complex, in-place, internal mem management : call crafft_pz 2 z 2 d(n 1, n 2, input, isign, flag, comm) 2 -d complex-complex, in-place with no internal memory : call crafft_pz 2 z 2 d(n 1, n 2, input, isign, flag, comm, work) 2 -d complex-complex, out-of-place, internal mem manager : call crafft_pz 2 z 2 d(n 1, n 2, input, output, isign, flag, comm) 2 -d complex-complex, out-of-place, no internal memory : crafft_pz 2 z 2 d(n 1, n 2, input, output, isign, flag, comm, work) Each routine above has manpage. Also see 3 d equivalent : man crafft_pz 2 z 3 d NCRC Fall User Training 2012 90

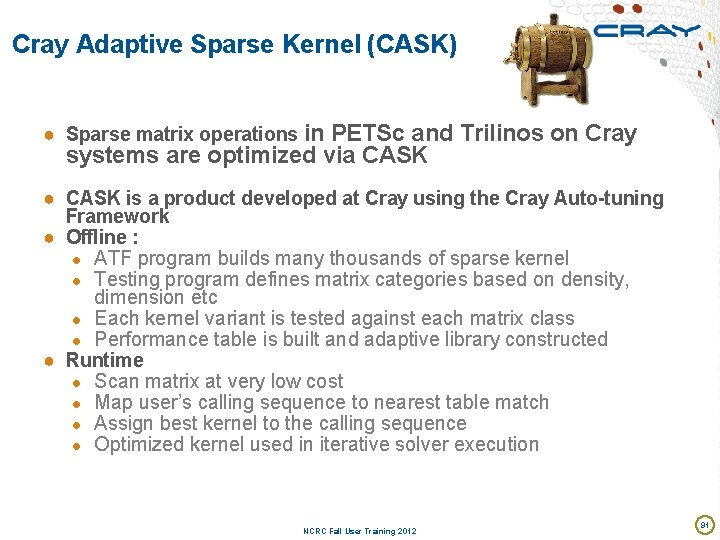
Cray Adaptive Sparse Kernel (CASK) ● Sparse matrix operations in PETSc and Trilinos on Cray systems are optimized via CASK ● CASK is a product developed at Cray using the Cray Auto-tuning Framework ● Offline : ● ATF program builds many thousands of sparse kernel ● Testing program defines matrix categories based on density, dimension etc ● Each kernel variant is tested against each matrix class ● Performance table is built and adaptive library constructed ● Runtime ● Scan matrix at very low cost ● Map user’s calling sequence to nearest table match ● Assign best kernel to the calling sequence ● Optimized kernel used in iterative solver execution NCRC Fall User Training 2012 91

Lib. Sci for Accelerators ● Provide basic libraries for accelerators, tuned for Cray ● Must be independent to Open. ACC, but fully compatible ● Multiple use case support ● Get the base use of accelerators with no code change ● Get extreme performance of GPU with or without code change ● Extra tools for support of complex code ● Incorporate the existing GPU libraries into libsci ● Provide additional performance and usability ● Maintain the Standard APIs where possible! NCRC Fall User Training 2012 92

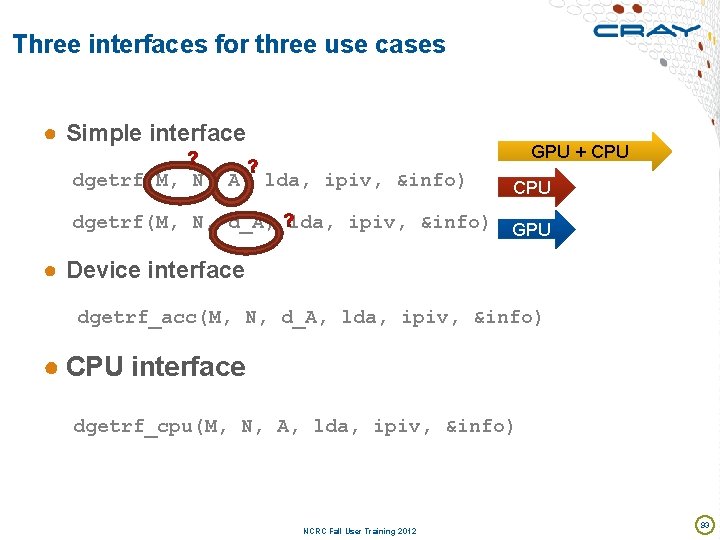
Three interfaces for three use cases ● Simple interface GPU + CPU dgetrf(M, N, A, lda, ipiv, &info) dgetrf(M, N, d_A, lda, ipiv, &info) CPU GPU ● Device interface dgetrf_acc(M, N, d_A, lda, ipiv, &info) ● CPU interface dgetrf_cpu(M, N, A, lda, ipiv, &info) NCRC Fall User Training 2012 93

Usage - Basics ● Supports Cray and GNU compilers. ● Fortran and C interfaces (column-major assumed) ● Load the module craype-accel-nvidia 35. ● Compile as normal (dynamic libraries used) ● To enable threading in the CPU library, set OMP_NUM_THREADS ● E. g. export OMP_NUM_THREADS=16 ● Assign 1 single MPI process per node ● Multiple processes cannot share the single GPU ● Execute your code as normal NCRC Fall User Training 2012 94

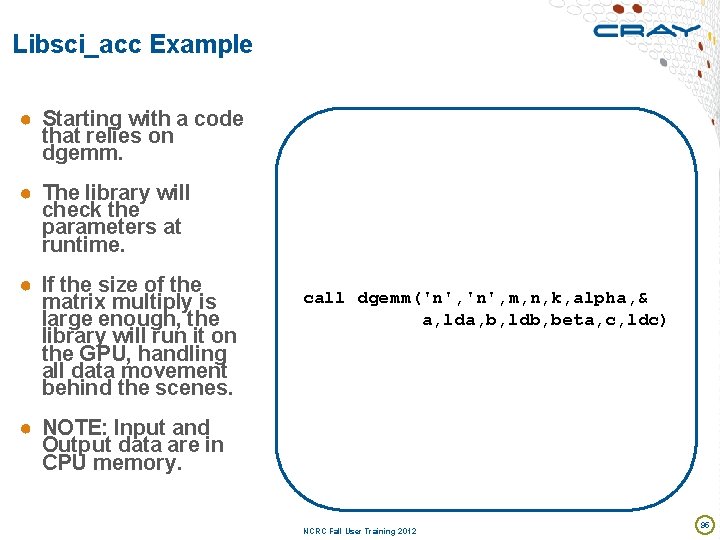
Libsci_acc Example ● Starting with a code that relies on dgemm. ● The library will check the parameters at runtime. ● If the size of the matrix multiply is large enough, the library will run it on the GPU, handling all data movement behind the scenes. call dgemm('n', m, n, k, alpha, & a, lda, b, ldb, beta, c, ldc) ● NOTE: Input and Output data are in CPU memory. NCRC Fall User Training 2012 95

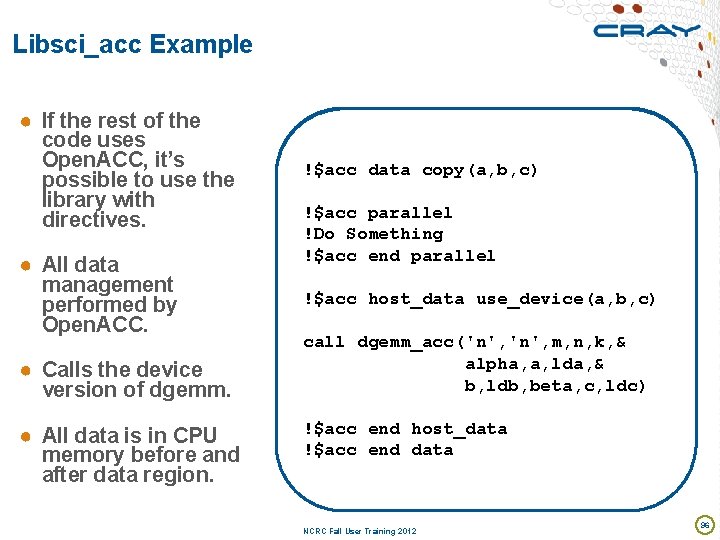
Libsci_acc Example ● If the rest of the code uses Open. ACC, it’s possible to use the library with directives. !$acc data copy(a, b, c) ● All data management performed by Open. ACC. !$acc host_data use_device(a, b, c) ● Calls the device version of dgemm. ● All data is in CPU memory before and after data region. !$acc parallel !Do Something !$acc end parallel call dgemm ('n', m, n, k, & call dgemm_acc('n', m, n, k, & alpha, a, lda, & b, ldb, beta, c, ldc) !$acc end host_data !$acc end data NCRC Fall User Training 2012 96

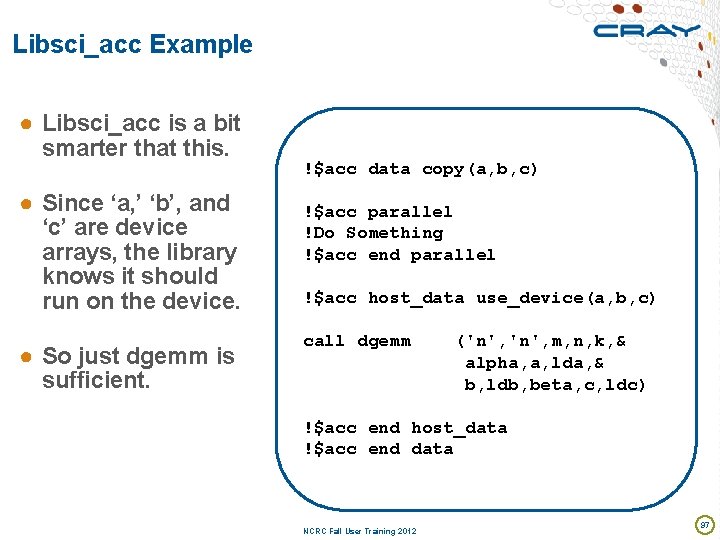
Libsci_acc Example ● Libsci_acc is a bit smarter that this. ● Since ‘a, ’ ‘b’, and ‘c’ are device arrays, the library knows it should run on the device. ● So just dgemm is sufficient. !$acc data copy(a, b, c) !$acc parallel !Do Something !$acc end parallel !$acc host_data use_device(a, b, c) call dgemm ('n', m, n, k, & call dgemm_acc('n', m, n, k, & alpha, a, lda, & b, ldb, beta, c, ldc) !$acc end host_data !$acc end data NCRC Fall User Training 2012 97


Tuning requests ● Cray. BLAS is an auto-tuned library ● Generally, excellent performance is possible for all shapes and sizes ● However, even the adaptive Cray. BLAS can be improved by tuning for exact sizes and shapes ● Send your specific tuning requirements to crayblas@cray. com ● Just send the routine name, and the list of calling sequences NCRC Fall User Training 2012 10 2

Cray Message Passing Toolkit NCRC Fall User Training 2012 10 3

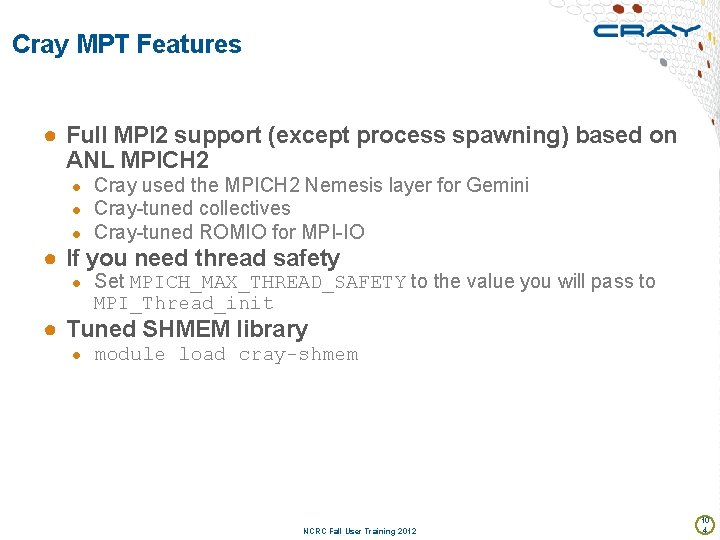
Cray MPT Features ● Full MPI 2 support (except process spawning) based on ANL MPICH 2 ● Cray used the MPICH 2 Nemesis layer for Gemini ● Cray-tuned collectives ● Cray-tuned ROMIO for MPI-IO ● If you need thread safety ● Set MPICH_MAX_THREAD_SAFETY to the value you will pass to MPI_Thread_init ● Tuned SHMEM library ● module load cray-shmem NCRC Fall User Training 2012 10 4


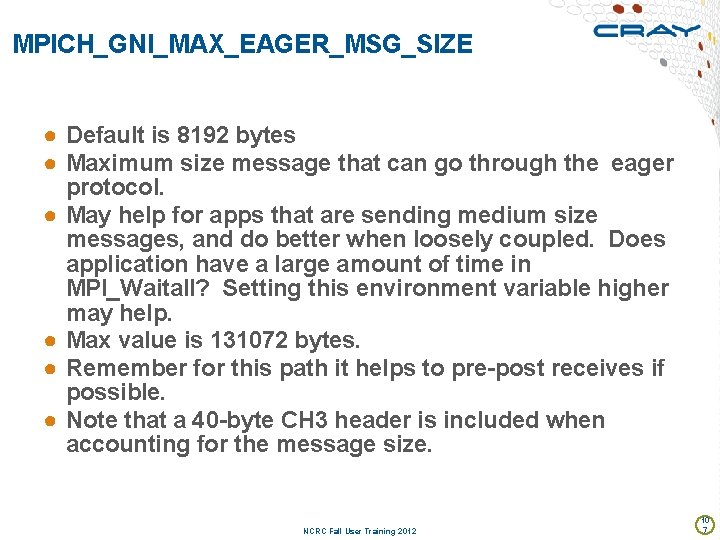
MPICH_GNI_MAX_EAGER_MSG_SIZE ● Default is 8192 bytes ● Maximum size message that can go through the eager protocol. ● May help for apps that are sending medium size messages, and do better when loosely coupled. Does application have a large amount of time in MPI_Waitall? Setting this environment variable higher may help. ● Max value is 131072 bytes. ● Remember for this path it helps to pre-post receives if possible. ● Note that a 40 -byte CH 3 header is included when accounting for the message size. NCRC Fall User Training 2012 10 7

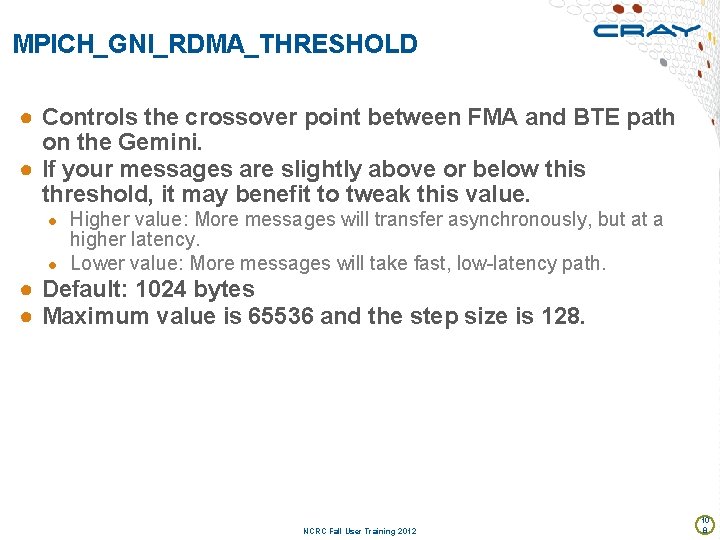
MPICH_GNI_RDMA_THRESHOLD ● Controls the crossover point between FMA and BTE path on the Gemini. ● If your messages are slightly above or below this threshold, it may benefit to tweak this value. ● Higher value: More messages will transfer asynchronously, but at a higher latency. ● Lower value: More messages will take fast, low-latency path. ● Default: 1024 bytes ● Maximum value is 65536 and the step size is 128. NCRC Fall User Training 2012 10 8

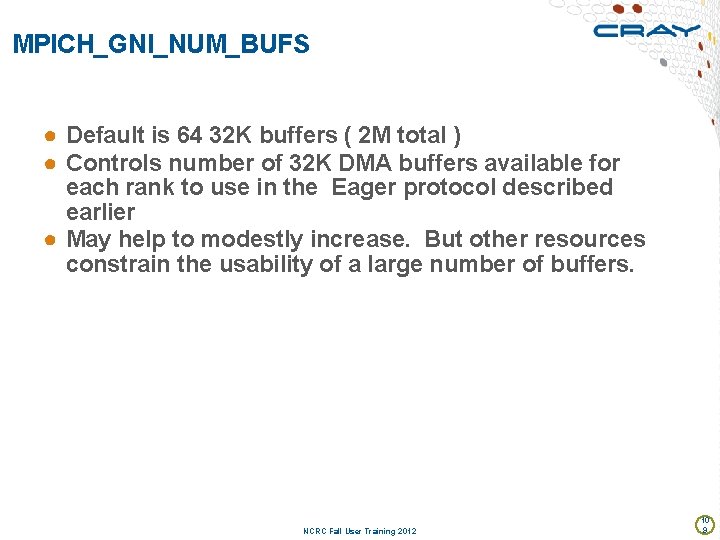
MPICH_GNI_NUM_BUFS ● Default is 64 32 K buffers ( 2 M total ) ● Controls number of 32 K DMA buffers available for each rank to use in the Eager protocol described earlier ● May help to modestly increase. But other resources constrain the usability of a large number of buffers. NCRC Fall User Training 2012 10 9

Cray Performance Tools NCRC Fall User Training 2012 11 0

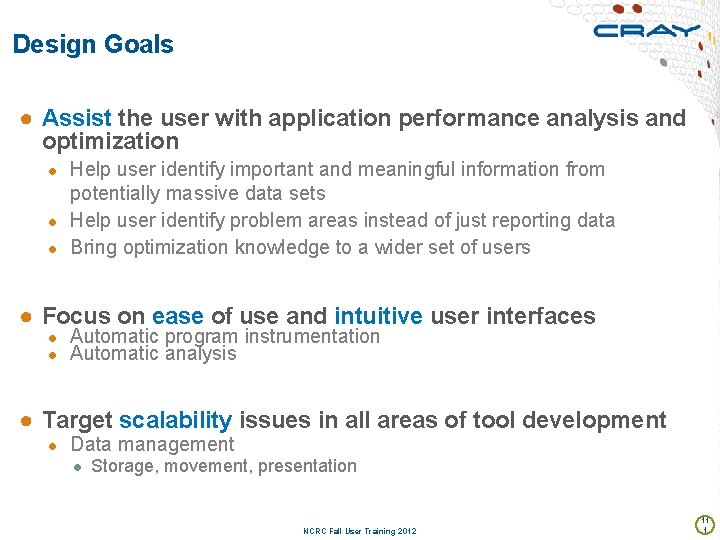
Design Goals ● Assist the user with application performance analysis and optimization ● Help user identify important and meaningful information from potentially massive data sets ● Help user identify problem areas instead of just reporting data ● Bring optimization knowledge to a wider set of users ● Focus on ease of use and intuitive user interfaces ● Automatic program instrumentation ● Automatic analysis ● Target scalability issues in all areas of tool development ● Data management ● Storage, movement, presentation NCRC Fall User Training 2012 11 1

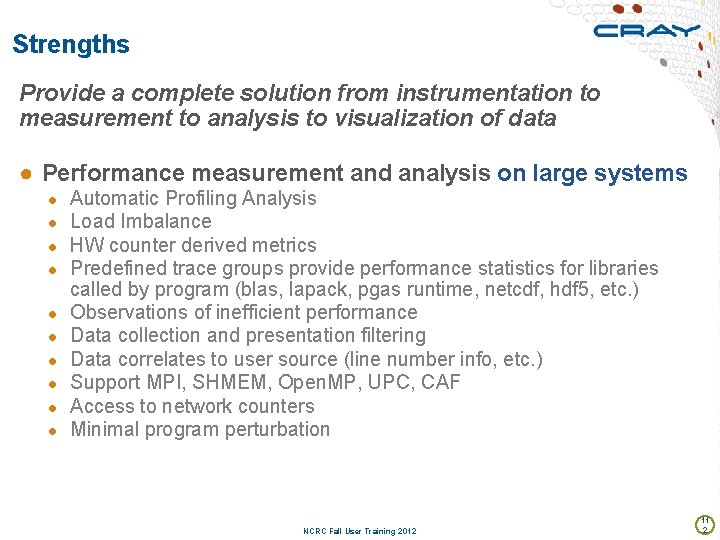
Strengths Provide a complete solution from instrumentation to measurement to analysis to visualization of data ● Performance measurement and analysis on large systems ● ● ● ● ● Automatic Profiling Analysis Load Imbalance HW counter derived metrics Predefined trace groups provide performance statistics for libraries called by program (blas, lapack, pgas runtime, netcdf, hdf 5, etc. ) Observations of inefficient performance Data collection and presentation filtering Data correlates to user source (line number info, etc. ) Support MPI, SHMEM, Open. MP, UPC, CAF Access to network counters Minimal program perturbation NCRC Fall User Training 2012 11 2

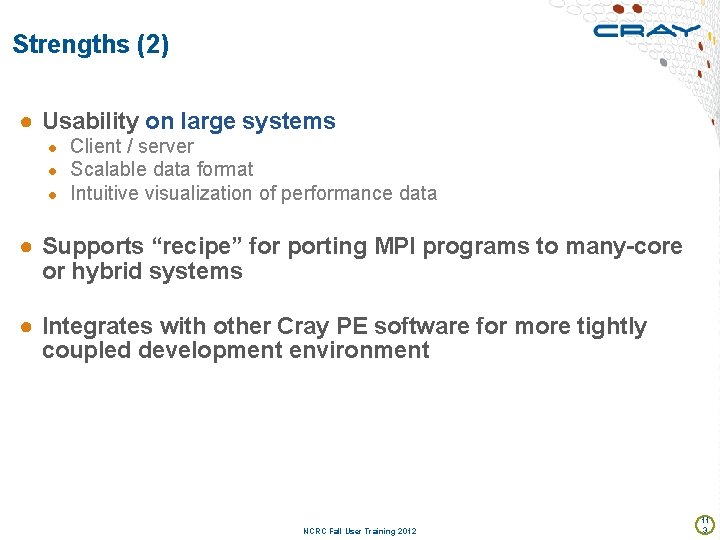
Strengths (2) ● Usability on large systems ● Client / server ● Scalable data format ● Intuitive visualization of performance data ● Supports “recipe” for porting MPI programs to many-core or hybrid systems ● Integrates with other Cray PE software for more tightly coupled development environment NCRC Fall User Training 2012 11 3

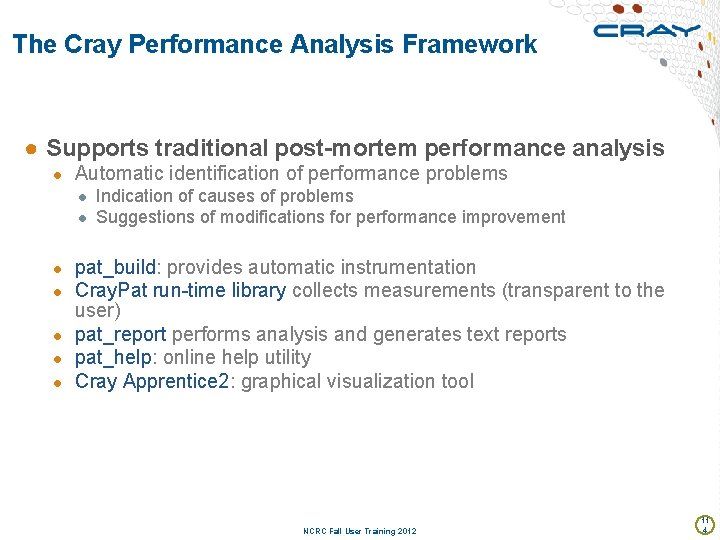
The Cray Performance Analysis Framework ● Supports traditional post-mortem performance analysis ● Automatic identification of performance problems ● Indication of causes of problems ● Suggestions of modifications for performance improvement ● pat_build: provides automatic instrumentation ● Cray. Pat run-time library collects measurements (transparent to the user) ● pat_report performs analysis and generates text reports ● pat_help: online help utility ● Cray Apprentice 2: graphical visualization tool NCRC Fall User Training 2012 11 4

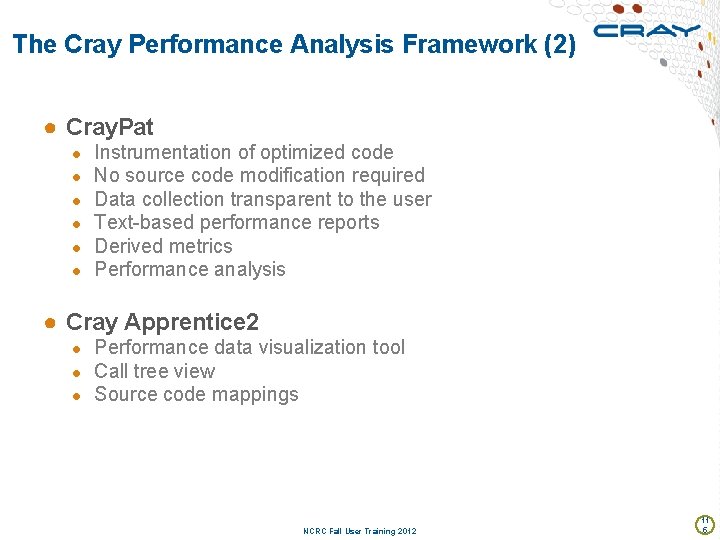
The Cray Performance Analysis Framework (2) ● Cray. Pat ● ● ● Instrumentation of optimized code No source code modification required Data collection transparent to the user Text-based performance reports Derived metrics Performance analysis ● Cray Apprentice 2 ● Performance data visualization tool ● Call tree view ● Source code mappings NCRC Fall User Training 2012 11 5

Steps to Using the Tools NCRC Fall User Training 2012

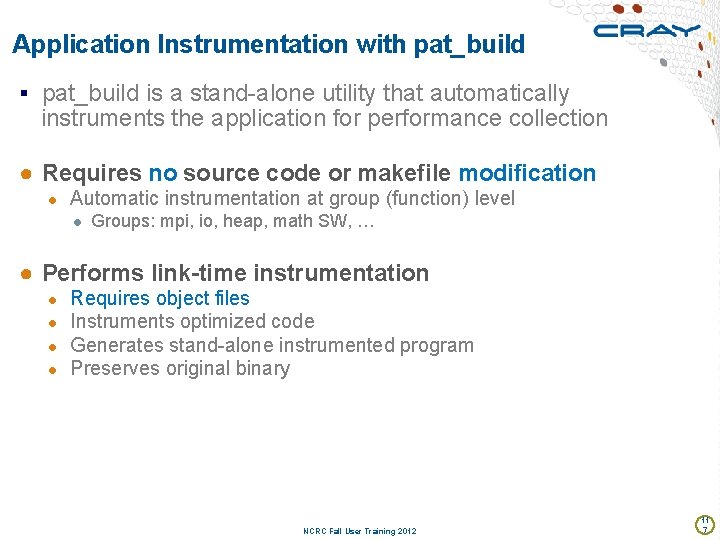
Application Instrumentation with pat_build § pat_build is a stand-alone utility that automatically instruments the application for performance collection ● Requires no source code or makefile modification ● Automatic instrumentation at group (function) level ● Groups: mpi, io, heap, math SW, … ● Performs link-time instrumentation ● ● Requires object files Instruments optimized code Generates stand-alone instrumented program Preserves original binary NCRC Fall User Training 2012 11 7

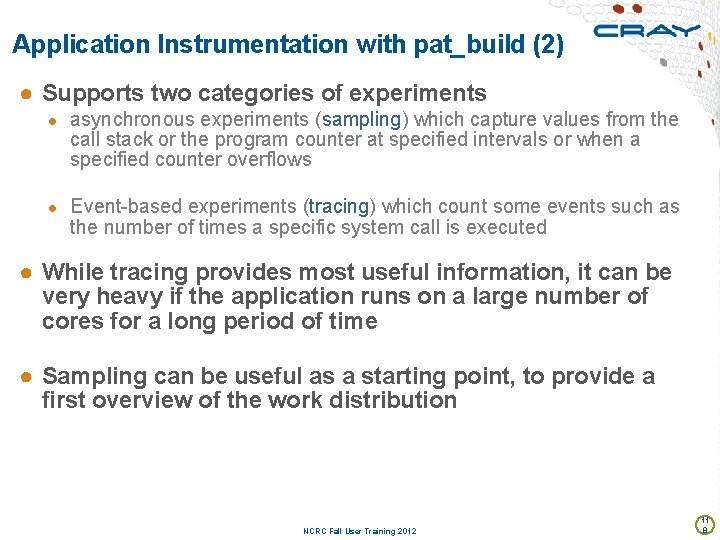
Application Instrumentation with pat_build (2) ● Supports two categories of experiments ● asynchronous experiments (sampling) which capture values from the call stack or the program counter at specified intervals or when a specified counter overflows ● Event-based experiments (tracing) which count some events such as the number of times a specific system call is executed ● While tracing provides most useful information, it can be very heavy if the application runs on a large number of cores for a long period of time ● Sampling can be useful as a starting point, to provide a first overview of the work distribution NCRC Fall User Training 2012 11 8

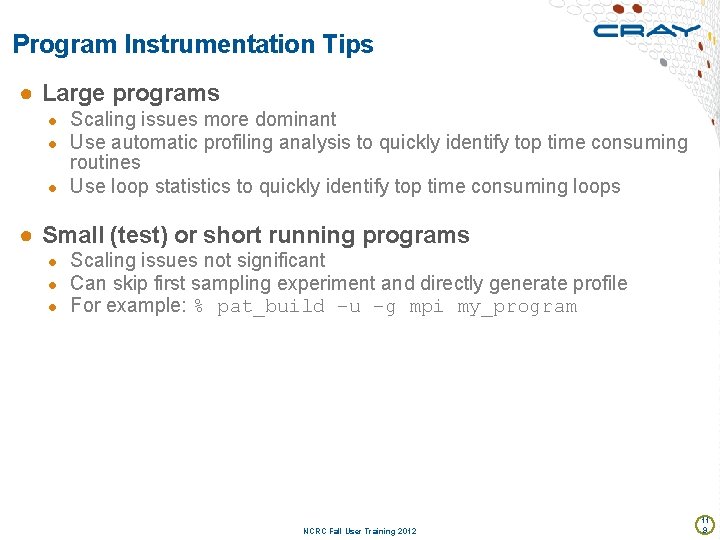
Program Instrumentation Tips ● Large programs ● Scaling issues more dominant ● Use automatic profiling analysis to quickly identify top time consuming routines ● Use loop statistics to quickly identify top time consuming loops ● Small (test) or short running programs ● Scaling issues not significant ● Can skip first sampling experiment and directly generate profile ● For example: % pat_build –u –g mpi my_program NCRC Fall User Training 2012 11 9

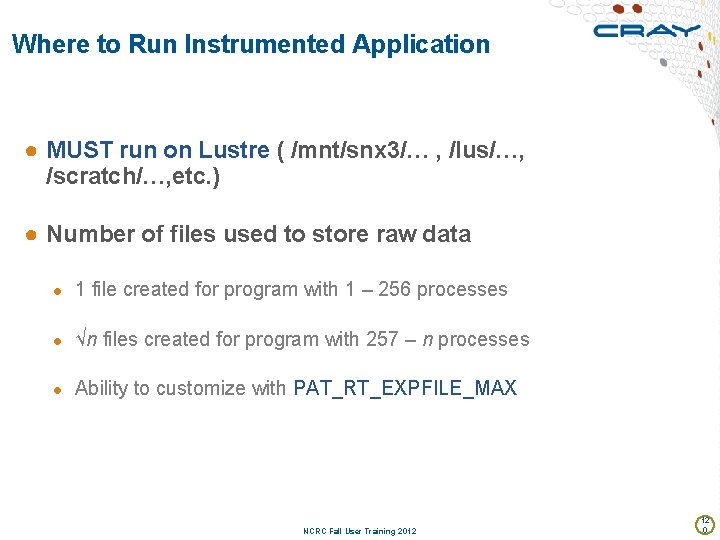
Where to Run Instrumented Application ● MUST run on Lustre ( /mnt/snx 3/… , /lus/…, /scratch/…, etc. ) ● Number of files used to store raw data ● 1 file created for program with 1 – 256 processes ● √n files created for program with 257 – n processes ● Ability to customize with PAT_RT_EXPFILE_MAX NCRC Fall User Training 2012 12 0

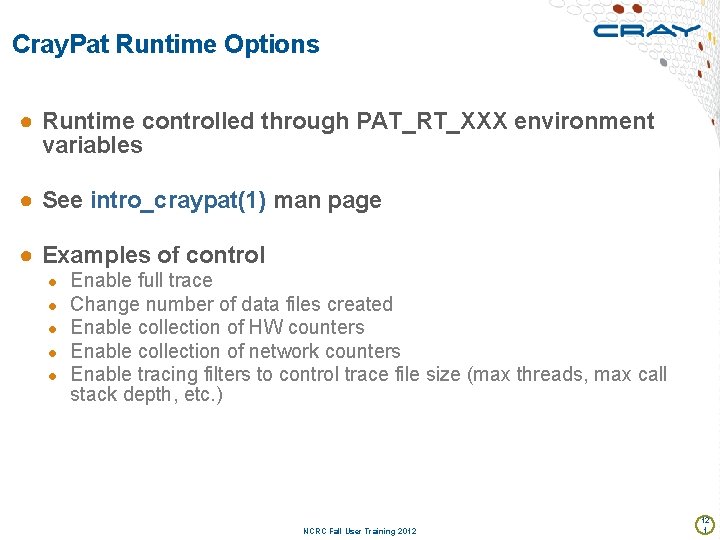
Cray. Pat Runtime Options ● Runtime controlled through PAT_RT_XXX environment variables ● See intro_craypat(1) man page ● Examples of control ● ● ● Enable full trace Change number of data files created Enable collection of HW counters Enable collection of network counters Enable tracing filters to control trace file size (max threads, max call stack depth, etc. ) NCRC Fall User Training 2012 12 1

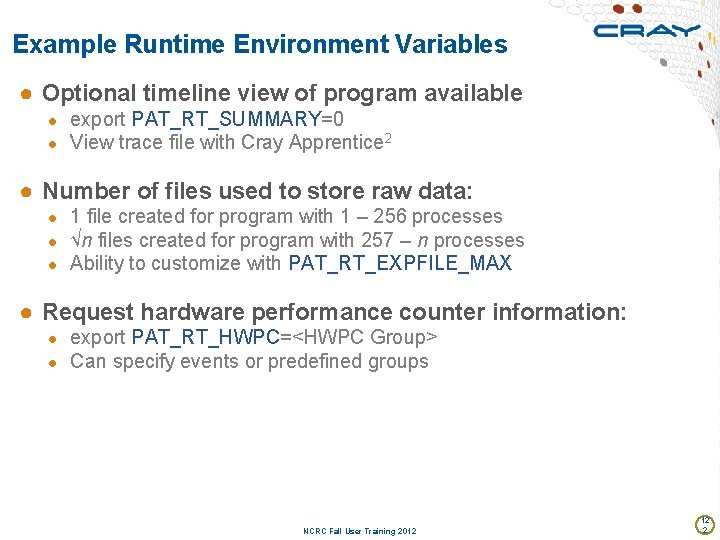
Example Runtime Environment Variables ● Optional timeline view of program available ● export PAT_RT_SUMMARY=0 ● View trace file with Cray Apprentice 2 ● Number of files used to store raw data: ● 1 file created for program with 1 – 256 processes ● √n files created for program with 257 – n processes ● Ability to customize with PAT_RT_EXPFILE_MAX ● Request hardware performance counter information: ● export PAT_RT_HWPC=<HWPC Group> ● Can specify events or predefined groups NCRC Fall User Training 2012 12 2

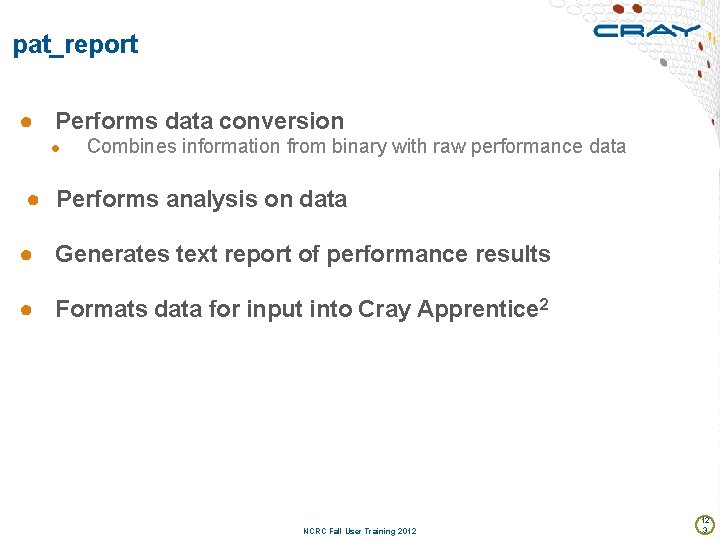
pat_report ● Performs data conversion ● Combines information from binary with raw performance data ● Performs analysis on data ● Generates text report of performance results ● Formats data for input into Cray Apprentice 2 NCRC Fall User Training 2012 12 3

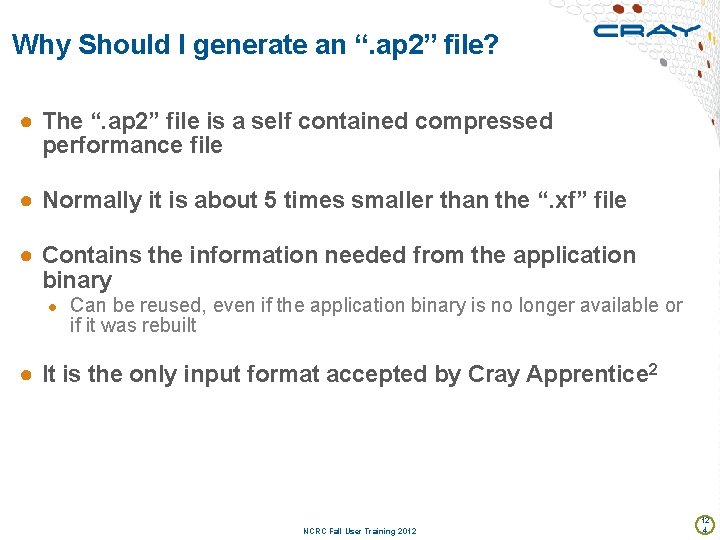
Why Should I generate an “. ap 2” file? ● The “. ap 2” file is a self contained compressed performance file ● Normally it is about 5 times smaller than the “. xf” file ● Contains the information needed from the application binary ● Can be reused, even if the application binary is no longer available or if it was rebuilt ● It is the only input format accepted by Cray Apprentice 2 NCRC Fall User Training 2012 12 4

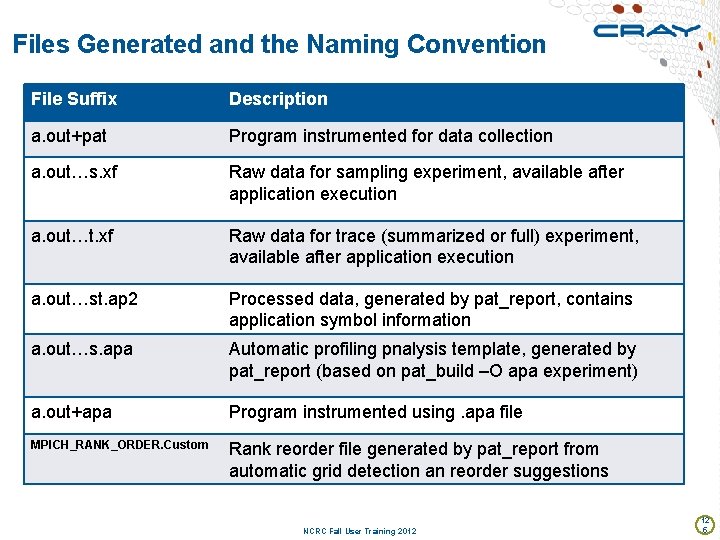
Files Generated and the Naming Convention File Suffix Description a. out+pat Program instrumented for data collection a. out…s. xf Raw data for sampling experiment, available after application execution a. out…t. xf Raw data for trace (summarized or full) experiment, available after application execution a. out…st. ap 2 Processed data, generated by pat_report, contains application symbol information a. out…s. apa Automatic profiling pnalysis template, generated by pat_report (based on pat_build –O apa experiment) a. out+apa Program instrumented using. apa file MPICH_RANK_ORDER. Custom Rank reorder file generated by pat_report from automatic grid detection an reorder suggestions NCRC Fall User Training 2012 12 5

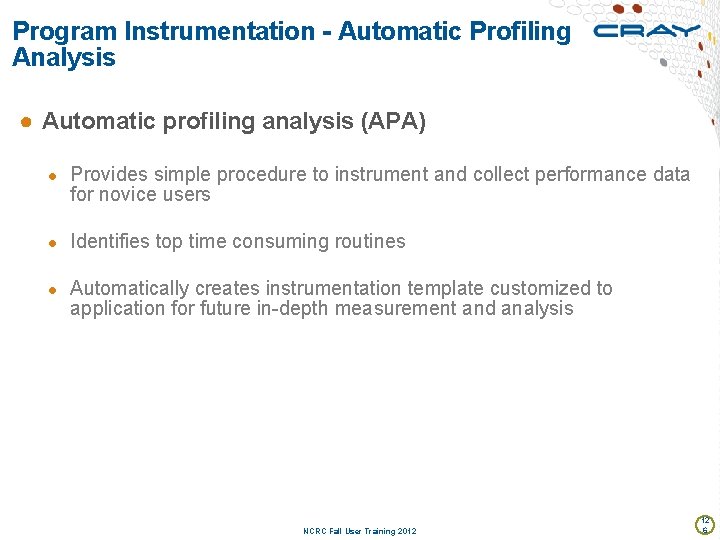
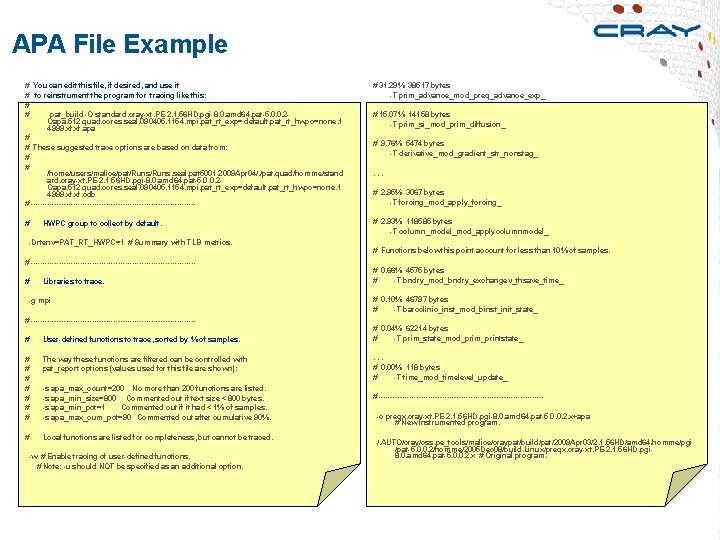
Program Instrumentation - Automatic Profiling Analysis ● Automatic profiling analysis (APA) ● Provides simple procedure to instrument and collect performance data for novice users ● Identifies top time consuming routines ● Automatically creates instrumentation template customized to application for future in-depth measurement and analysis NCRC Fall User Training 2012 12 6

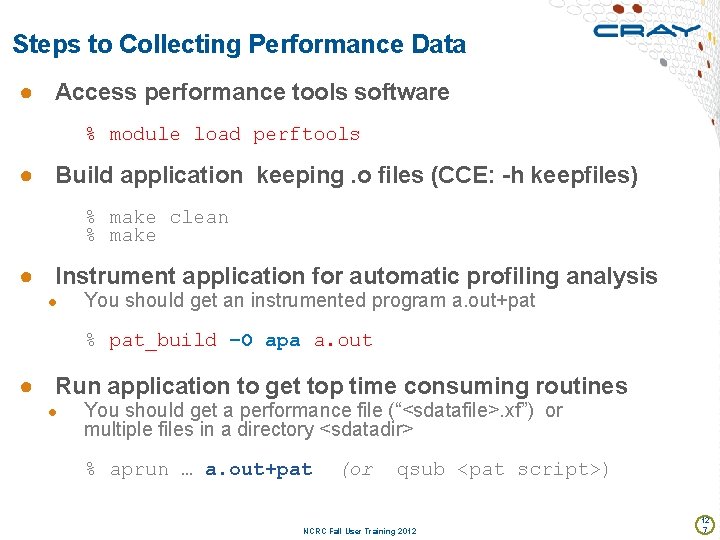
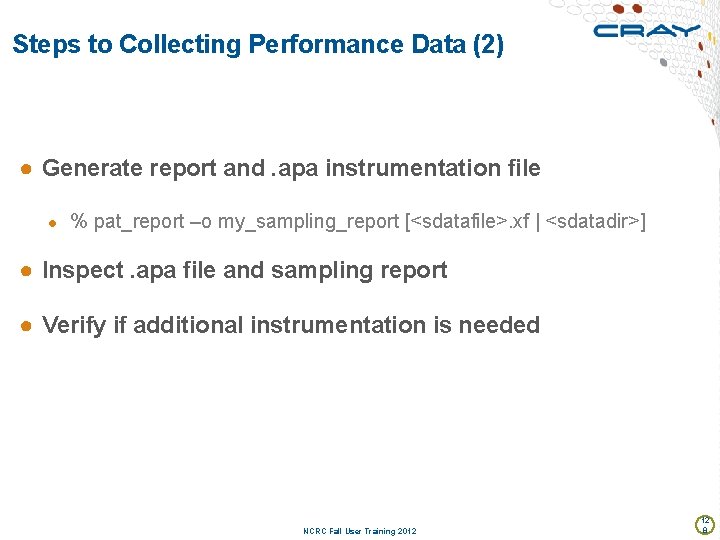
Steps to Collecting Performance Data ● Access performance tools software % module load perftools ● Build application keeping. o files (CCE: -h keepfiles) % make clean % make ● Instrument application for automatic profiling analysis ● You should get an instrumented program a. out+pat % pat_build –O apa a. out ● Run application to get top time consuming routines ● You should get a performance file (“<sdatafile>. xf”) or multiple files in a directory <sdatadir> % aprun … a. out+pat (or qsub <pat script>) NCRC Fall User Training 2012 12 7

Steps to Collecting Performance Data (2) ● Generate report and. apa instrumentation file ● % pat_report –o my_sampling_report [<sdatafile>. xf | <sdatadir>] ● Inspect. apa file and sampling report ● Verify if additional instrumentation is needed NCRC Fall User Training 2012 12 8

APA File Example # You can edit this file, if desired, and use it # to reinstrument the program for tracing like this: # # pat_build -O standard. cray-xt. PE-2. 1. 56 HD. pgi-8. 0. amd 64. pat-5. 0. 0. 2 Oapa. 512. quad. cores. seal. 090405. 1154. mpi. pat_rt_exp= default. pat_rt_hwpc=none. 1 4999. xf. apa # # These suggested trace options are based on data from: # # /home/users/malice/pat/Runs. seal. pat 5001. 2009 Apr 04/. /pat. quad/homme/stand ard. cray-xt. PE-2. 1. 56 HD. pgi-8. 0. amd 64. pat-5. 0. 0. 2 Oapa. 512. quad. cores. seal. 090405. 1154. mpi. pat_rt_exp=default. pat_rt_hwpc=none. 1 4999. xf. cdb # ----------------------------------- # 31. 29% 38517 bytes -T prim_advance_mod_preq_advance_exp_ # HWPC group to collect by default. # 2. 93% 118585 bytes -T column_model_mod_applycolumnmodel_ -Drtenv=PAT_RT_HWPC=1 # Summary with TLB metrics. # -----------------------------------# Libraries to trace. -g mpi # -----------------------------------# User-defined functions to trace, sorted by % of samples. # The way these functions are filtered can be controlled with # pat_report options (values used for this file are shown): # # -s apa_max_count=200 No more than 200 functions are listed. # -s apa_min_size=800 Commented out if text size < 800 bytes. # -s apa_min_pct=1 Commented out if it had < 1% of samples. # -s apa_max_cum_pct=90 Commented out after cumulative 90%. # Local functions are listed for completeness, but cannot be traced. -w # Enable tracing of user-defined functions. # Note: -u should NOT be specified as an additional option. # 15. 07% 14158 bytes -T prim_si_mod_prim_diffusion_ # 9. 76% 5474 bytes -T derivative_mod_gradient_str_nonstag_. . . # 2. 95% 3067 bytes -T forcing_mod_apply_forcing_ # Functions below this point account for less than 10% of samples. # 0. 66% 4575 bytes # -T bndry_mod_bndry_exchangev_thsave_time_ # 0. 10% 46797 bytes # -T baroclinic_inst_mod_binst_init_state_ # 0. 04% 62214 bytes # -T prim_state_mod_prim_printstate_. . . # 0. 00% 118 bytes # -T time_mod_timelevel_update_ # ----------------------------------- -o preqx. cray-xt. PE-2. 1. 56 HD. pgi-8. 0. amd 64. pat-5. 0. 0. 2. x+apa # New instrumented program. /. AUTO/cray/css. pe_tools/malice/craypat/build/pat/2009 Apr 03/2. 1. 56 HD/amd 64/homme/pgi /pat-5. 0. 0. 2/homme/2005 Dec 08/build. Linux/preqx. cray-xt. PE-2. 1. 56 HD. pgi 8. 0. amd 64. pat-5. 0. 0. 2. x # Original program.

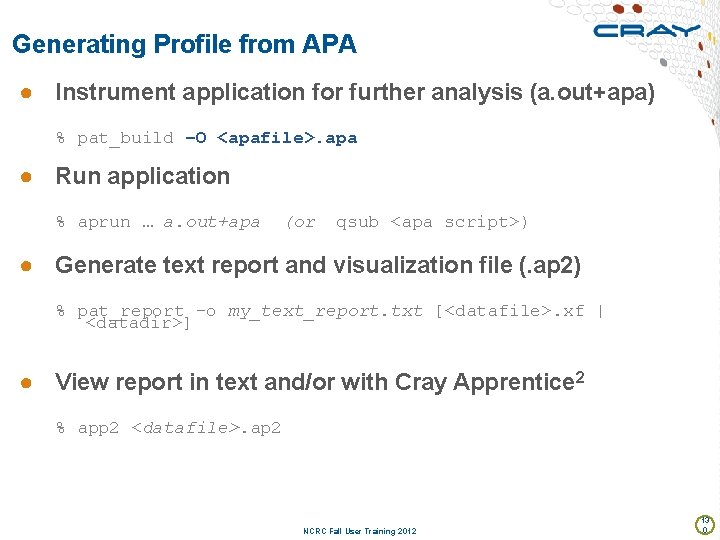
Generating Profile from APA ● Instrument application for further analysis (a. out+apa) % pat_build –O <apafile>. apa ● Run application % aprun … a. out+apa (or qsub <apa script>) ● Generate text report and visualization file (. ap 2) % pat_report –o my_text_report. txt [<datafile>. xf | <datadir>] ● View report in text and/or with Cray Apprentice 2 % app 2 <datafile>. ap 2 NCRC Fall User Training 2012 13 0

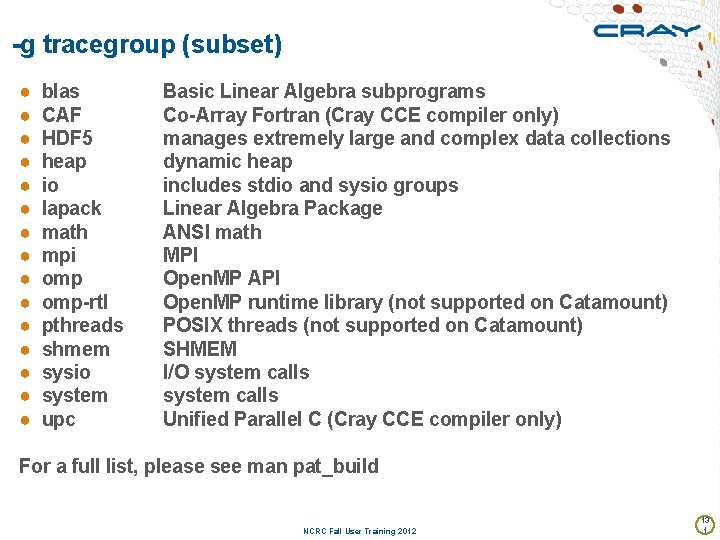
-g tracegroup (subset) ● ● ● ● blas CAF HDF 5 heap io lapack math mpi omp-rtl pthreads shmem sysio system upc Basic Linear Algebra subprograms Co-Array Fortran (Cray CCE compiler only) manages extremely large and complex data collections dynamic heap includes stdio and sysio groups Linear Algebra Package ANSI math MPI Open. MP API Open. MP runtime library (not supported on Catamount) POSIX threads (not supported on Catamount) SHMEM I/O system calls Unified Parallel C (Cray CCE compiler only) For a full list, please see man pat_build NCRC Fall User Training 2012 13 1

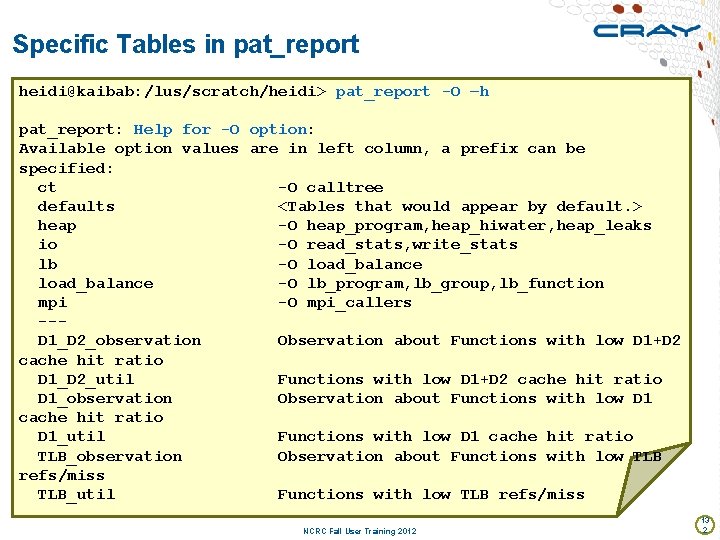
Specific Tables in pat_report heidi@kaibab: /lus/scratch/heidi> pat_report -O –h pat_report: Help for -O option: Available option values are in left column, a prefix can be specified: ct -O calltree defaults <Tables that would appear by default. > heap -O heap_program, heap_hiwater, heap_leaks io -O read_stats, write_stats lb -O load_balance -O lb_program, lb_group, lb_function mpi -O mpi_callers -- D 1_D 2_observation Observation about Functions with low D 1+D 2 cache hit ratio D 1_D 2_util Functions with low D 1+D 2 cache hit ratio D 1_observation Observation about Functions with low D 1 cache hit ratio D 1_util Functions with low D 1 cache hit ratio TLB_observation Observation about Functions with low TLB refs/miss TLB_util Functions with low TLB refs/miss NCRC Fall User Training 2012 13 2

MPI Rank Placement Suggestions NCRC Fall User Training 2012 13 3

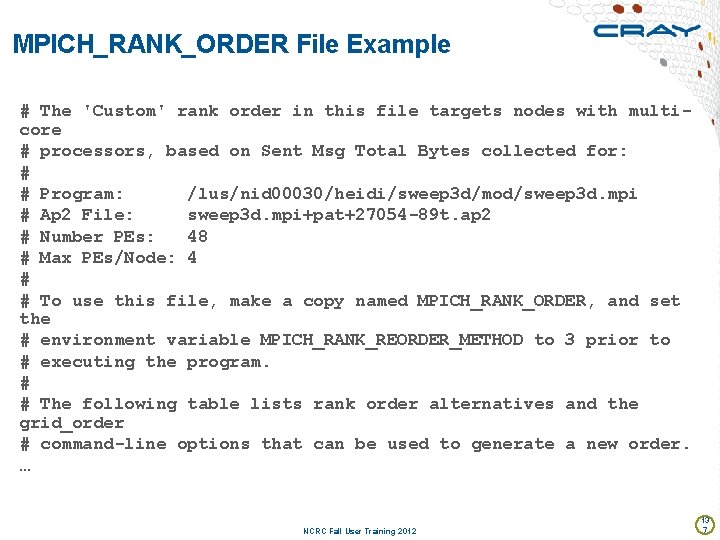
Automatic Communication Grid Detection ● Analyze runtime performance data to identify grids in a program to maximize on-node communication ● Example: nearest neighbor exchange in 2 dimensions ● Sweep 3 d uses a 2 -D grid for communication ● Determine whether or not a custom MPI rank order will produce a significant performance benefit ● Grid detection is helpful for programs with significant point-to-point communication ● Doesn’t interfere with MPI collective communication optimizations NCRC Fall User Training 2012 13 4

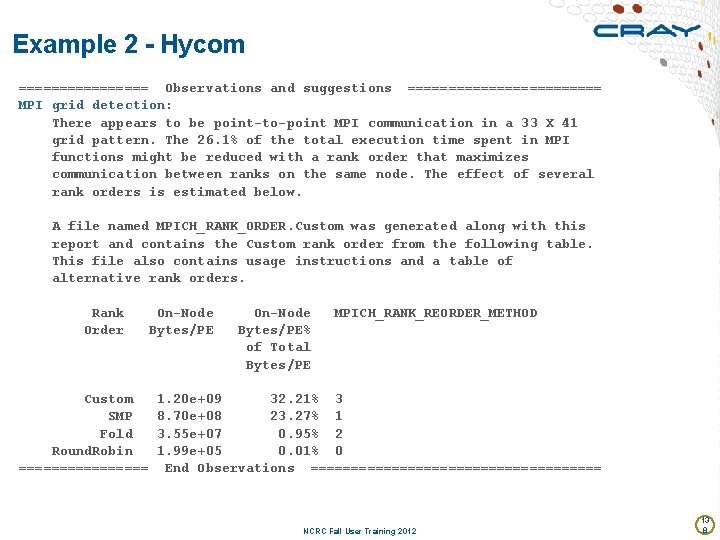
Automatic Grid Detection (cont’d) ● Tools produce a custom rank order if it’s beneficial based on grid size, grid order and cost metric ● Summarized findings in report ● Available if MPI functions traced (-g mpi) ● Describe how to re-run with custom rank order NCRC Fall User Training 2012 13 5

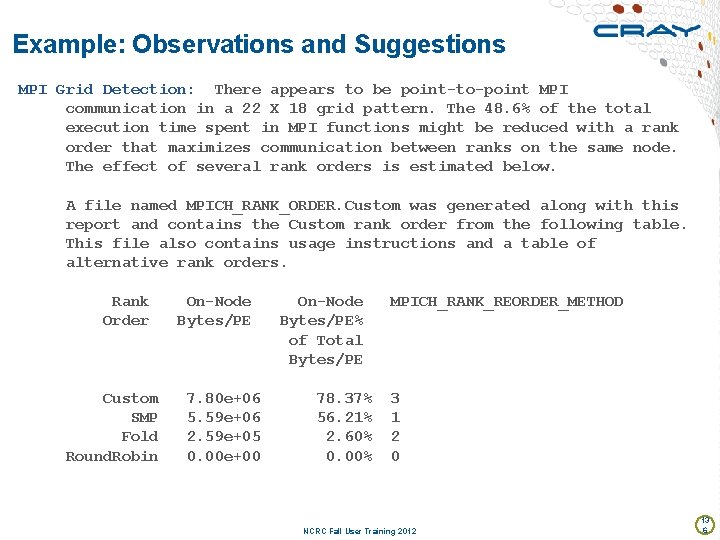
Example: Observations and Suggestions MPI Grid Detection: There appears to be point-to-point MPI communication in a 22 X 18 grid pattern. The 48. 6% of the total execution time spent in MPI functions might be reduced with a rank order that maximizes communication between ranks on the same node. The effect of several rank orders is estimated below. A file named MPICH_RANK_ORDER. Custom was generated along with this report and contains the Custom rank order from the following table. This file also contains usage instructions and a table of alternative rank orders. Rank On-Node MPICH_RANK_REORDER_METHOD Order Bytes/PE% of Total Bytes/PE Custom 7. 80 e+06 78. 37% 3 SMP 5. 59 e+06 56. 21% 1 Fold 2. 59 e+05 2. 60% 2 Round. Robin 0. 00 e+00 0. 00% 0 NCRC Fall User Training 2012 13 6

MPICH_RANK_ORDER File Example # The 'Custom' rank order in this file targets nodes with multicore # processors, based on Sent Msg Total Bytes collected for: # # Program: /lus/nid 00030/heidi/sweep 3 d/mod/sweep 3 d. mpi # Ap 2 File: sweep 3 d. mpi+pat+27054 -89 t. ap 2 # Number PEs: 48 # Max PEs/Node: 4 # # To use this file, make a copy named MPICH_RANK_ORDER, and set the # environment variable MPICH_RANK_REORDER_METHOD to 3 prior to # executing the program. # # The following table lists rank order alternatives and the grid_order # command-line options that can be used to generate a new order. … NCRC Fall User Training 2012 13 7

Example 2 - Hycom ======== Observations and suggestions ============ MPI grid detection: There appears to be point-to-point MPI communication in a 33 X 41 grid pattern. The 26. 1% of the total execution time spent in MPI functions might be reduced with a rank order that maximizes communication between ranks on the same node. The effect of several rank orders is estimated below. A file named MPICH_RANK_ORDER. Custom was generated along with this report and contains the Custom rank order from the following table. This file also contains usage instructions and a table of alternative rank orders. Rank On-Node MPICH_RANK_REORDER_METHOD Order Bytes/PE% of Total Bytes/PE Custom 1. 20 e+09 32. 21% 3 SMP 8. 70 e+08 23. 27% 1 Fold 3. 55 e+07 0. 95% 2 Round. Robin 1. 99 e+05 0. 01% 0 ======== End Observations ================== NCRC Fall User Training 2012 13 8

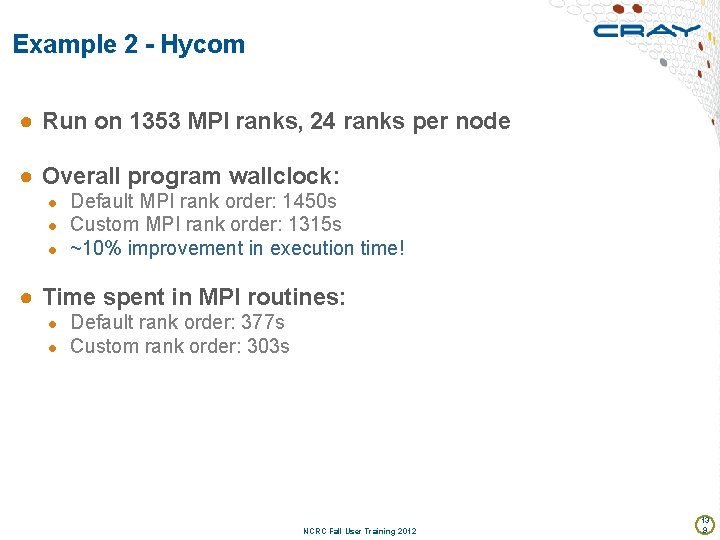
Example 2 - Hycom ● Run on 1353 MPI ranks, 24 ranks per node ● Overall program wallclock: ● Default MPI rank order: 1450 s ● Custom MPI rank order: 1315 s ● ~10% improvement in execution time! ● Time spent in MPI routines: ● Default rank order: 377 s ● Custom rank order: 303 s NCRC Fall User Training 2012 13 9

Loop Work Estimates NCRC Fall User Training 2012 14 0

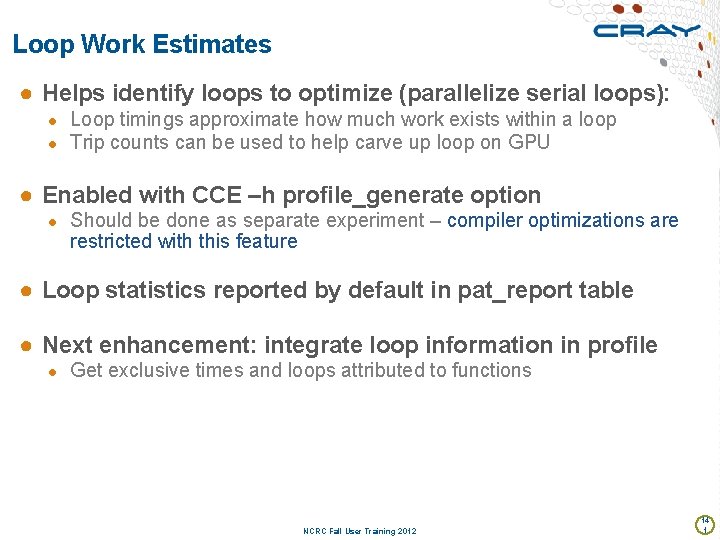
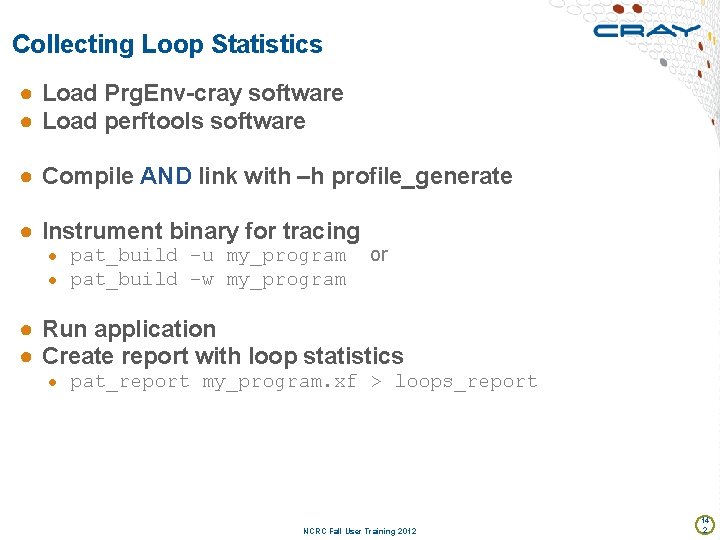
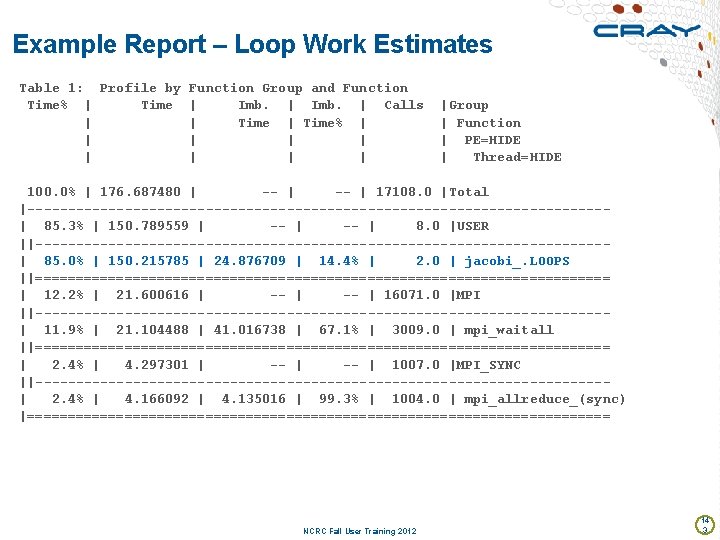
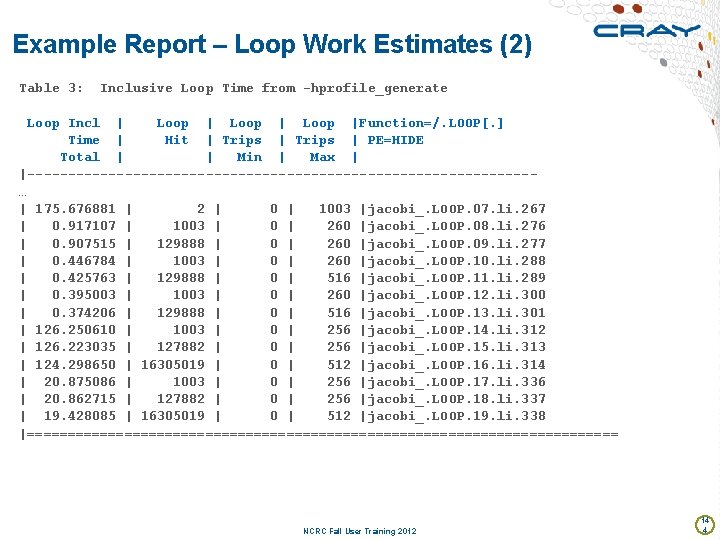
Loop Work Estimates ● Helps identify loops to optimize (parallelize serial loops): ● Loop timings approximate how much work exists within a loop ● Trip counts can be used to help carve up loop on GPU ● Enabled with CCE –h profile_generate option ● Should be done as separate experiment – compiler optimizations are restricted with this feature ● Loop statistics reported by default in pat_report table ● Next enhancement: integrate loop information in profile ● Get exclusive times and loops attributed to functions NCRC Fall User Training 2012 14 1

Collecting Loop Statistics ● Load Prg. Env-cray software ● Load perftools software ● Compile AND link with –h profile_generate ● Instrument binary for tracing ● pat_build –u my_program ● pat_build –w my_program or ● Run application ● Create report with loop statistics ● pat_report my_program. xf > loops_report NCRC Fall User Training 2012 14 2

Example Report – Loop Work Estimates Table 1: Profile by Function Group and Function Time% | Time | Imb. | Calls |Group | | Time% | | Function | | | PE=HIDE | | | Thread=HIDE 100. 0% | 176. 687480 | -- | 17108. 0 |Total |------------------------------------| 85. 3% | 150. 789559 | -- | 8. 0 |USER ||-----------------------------------| 85. 0% | 150. 215785 | 24. 876709 | 14. 4% | 2. 0 | jacobi_. LOOPS ||==================================== | 12. 2% | 21. 600616 | -- | 16071. 0 |MPI ||-----------------------------------| 11. 9% | 21. 104488 | 41. 016738 | 67. 1% | 3009. 0 | mpi_waitall ||==================================== | 2. 4% | 4. 297301 | -- | 1007. 0 |MPI_SYNC ||-----------------------------------| 2. 4% | 4. 166092 | 4. 135016 | 99. 3% | 1004. 0 | mpi_allreduce_(sync) |==================================== NCRC Fall User Training 2012 14 3

Example Report – Loop Work Estimates (2) Table 3: Inclusive Loop Time from -hprofile_generate Loop Incl | Loop |Function=/. LOOP[. ] Time | Hit | Trips | PE=HIDE Total | Min | Max | |-------------------------------… | 175. 676881 | 2 | 0 | 1003 |jacobi_. LOOP. 07. li. 267 | 0. 917107 | 1003 | 0 | 260 |jacobi_. LOOP. 08. li. 276 | 0. 907515 | 129888 | 0 | 260 |jacobi_. LOOP. 09. li. 277 | 0. 446784 | 1003 | 0 | 260 |jacobi_. LOOP. 10. li. 288 | 0. 425763 | 129888 | 0 | 516 |jacobi_. LOOP. 11. li. 289 | 0. 395003 | 1003 | 0 | 260 |jacobi_. LOOP. 12. li. 300 | 0. 374206 | 129888 | 0 | 516 |jacobi_. LOOP. 13. li. 301 | 126. 250610 | 1003 | 0 | 256 |jacobi_. LOOP. 14. li. 312 | 126. 223035 | 127882 | 0 | 256 |jacobi_. LOOP. 15. li. 313 | 124. 298650 | 16305019 | 0 | 512 |jacobi_. LOOP. 16. li. 314 | 20. 875086 | 1003 | 0 | 256 |jacobi_. LOOP. 17. li. 336 | 20. 862715 | 127882 | 0 | 256 |jacobi_. LOOP. 18. li. 337 | 19. 428085 | 16305019 | 0 | 512 |jacobi_. LOOP. 19. li. 338 |===================================== NCRC Fall User Training 2012 14 4

Cray Performance Tools ● There’s a lot more to cover about Cray. PAT and Apprentice 2 than we have time for today. ● See OLCF website for help and talks from previous workshops. ● Contact your liaison or me for help if you need it. NCRC Fall User Training 2012 14 5

Cray Debugging Tools STAT ATP NCRC Fall User Training 2012 14 6

Stack Trace Analysis Tool (STAT) My application hangs! NCRC Fall User Training 2012 14 7

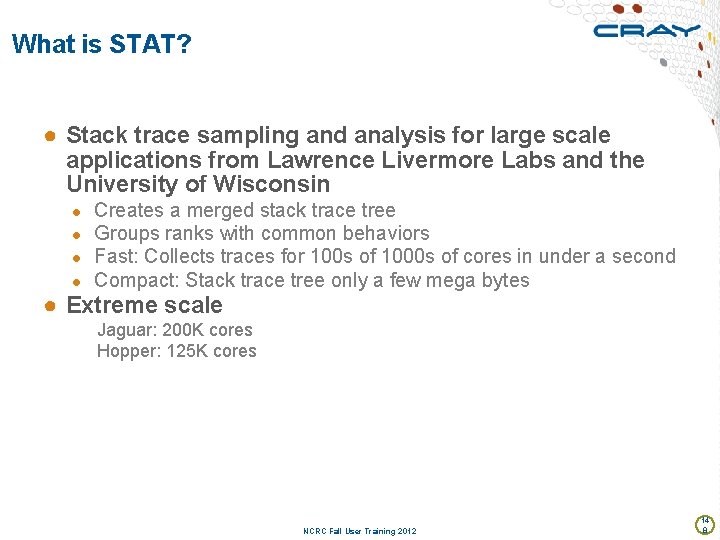
What is STAT? ● Stack trace sampling and analysis for large scale applications from Lawrence Livermore Labs and the University of Wisconsin ● ● Creates a merged stack trace tree Groups ranks with common behaviors Fast: Collects traces for 100 s of 1000 s of cores in under a second Compact: Stack trace tree only a few mega bytes ● Extreme scale Jaguar: 200 K cores Hopper: 125 K cores NCRC Fall User Training 2012 14 8

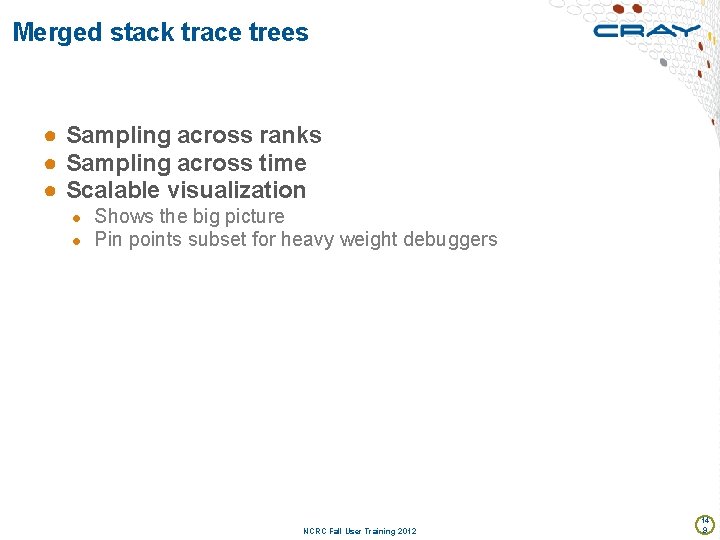
Merged stack trace trees ● Sampling across ranks ● Sampling across time ● Scalable visualization ● Shows the big picture ● Pin points subset for heavy weight debuggers NCRC Fall User Training 2012 14 9

Stack Trace Merge Example NCRC Fall User Training 2012 15 0

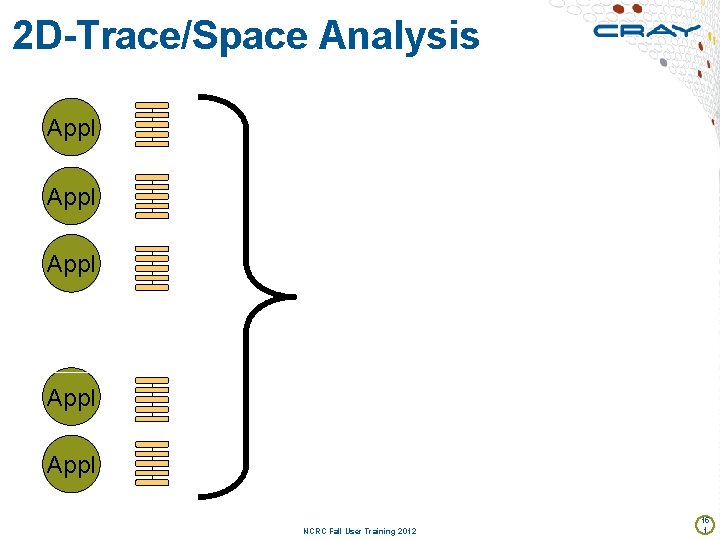
2 D-Trace/Space Analysis Appl … Appl NCRC Fall User Training 2012 15 1

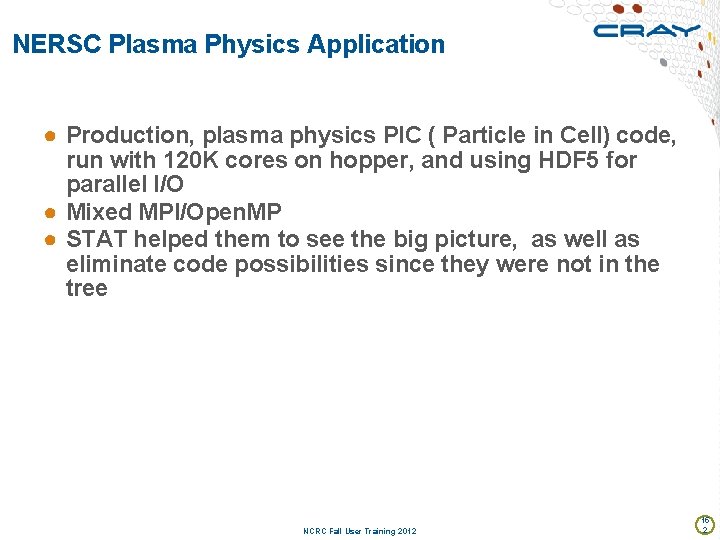
NERSC Plasma Physics Application ● Production, plasma physics PIC ( Particle in Cell) code, run with 120 K cores on hopper, and using HDF 5 for parallel I/O ● Mixed MPI/Open. MP ● STAT helped them to see the big picture, as well as eliminate code possibilities since they were not in the tree NCRC Fall User Training 2012 15 2

NCRC Fall User Training 2012 15 3

NCRC Fall User Training 2012 15 4

NCRC Fall User Training 2012 15 5

STAT 1. 2. 1. 1 ● module load stat ● man STAT ● STAT <pid_of_aprun> ● Creates STAT_results/<app_name>/<merged_st_file> ● statview <merged_st_file> ● STATGUI ● Scaling no longer limited by number file descriptors NCRC Fall User Training 2012 15 6

Abnormal Termination Processing (ATP) My application crashes! NCRC Fall User Training 2012 15 7

The Problem Being Solved ● Applications on Cray systems use hundreds of thousands of processes ● On a crash one, many, or all of them might trap ● No one wants that many core files ● No one wants that many stack backtraces ● They are too slow and too big. ● They are too much to comprehend NCRC Fall User Training 2012 15 8

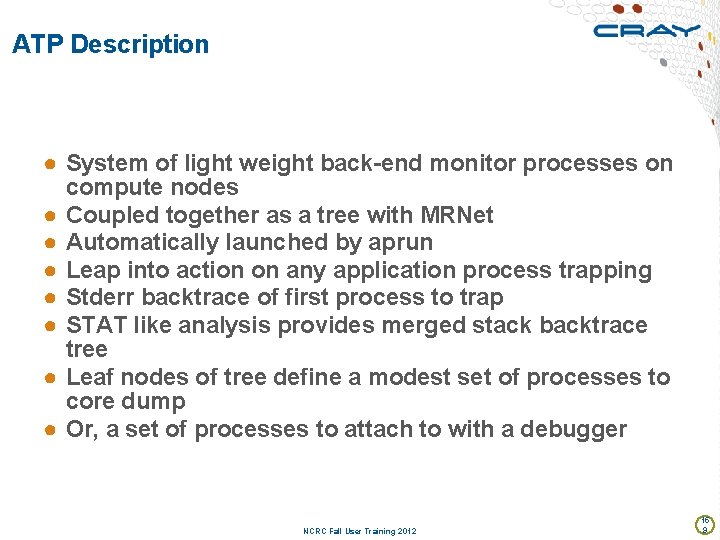
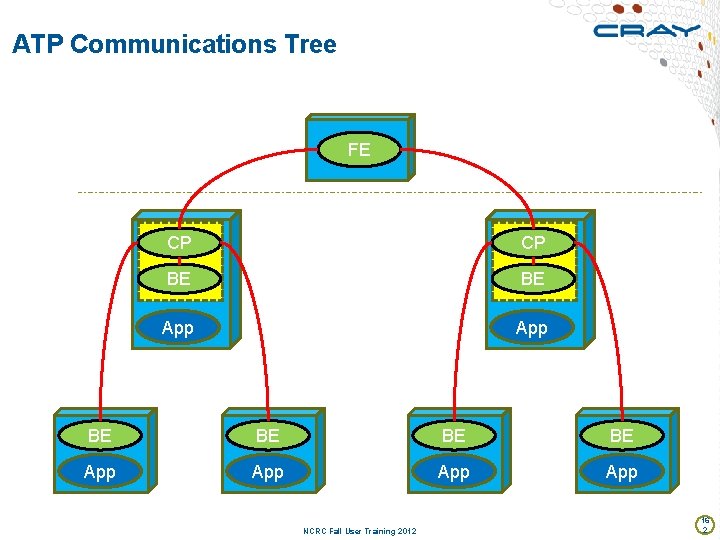
ATP Description ● System of light weight back-end monitor processes on compute nodes ● Coupled together as a tree with MRNet ● Automatically launched by aprun ● Leap into action on any application process trapping ● Stderr backtrace of first process to trap ● STAT like analysis provides merged stack backtrace tree ● Leaf nodes of tree define a modest set of processes to core dump ● Or, a set of processes to attach to with a debugger NCRC Fall User Training 2012 15 9

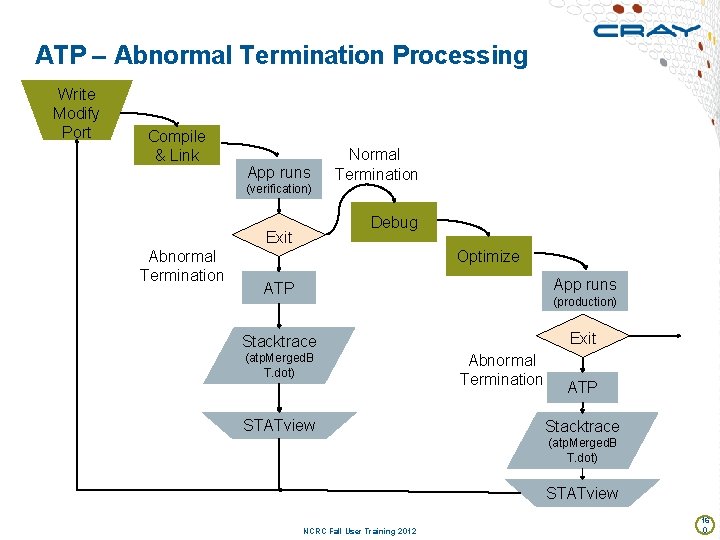
ATP – Abnormal Termination Processing Write Modify Port Compile & Link App runs (verification) Debug Exit Abnormal Termination Normal Termination Optimize ATP App runs Stacktrace Exit (production) (atp. Merged. B T. dot) STATview Abnormal Termination ATP Stacktrace (atp. Merged. B T. dot) STATview NCRC Fall User Training 2012 16 0

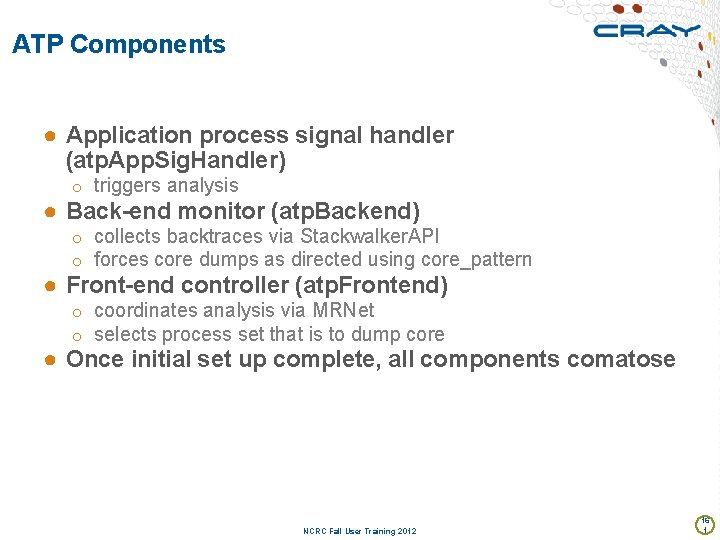
ATP Components ● Application process signal handler (atp. App. Sig. Handler) o triggers analysis ● Back-end monitor (atp. Backend) o collects backtraces via Stackwalker. API o forces core dumps as directed using core_pattern ● Front-end controller (atp. Frontend) o coordinates analysis via MRNet o selects process set that is to dump core ● Once initial set up complete, all components comatose NCRC Fall User Training 2012 16 1

ATP Communications Tree Front-end FE Back-end CP CP … BE BE App … App BE BE App NCRC Fall User Training 2012 … BE App 16 2

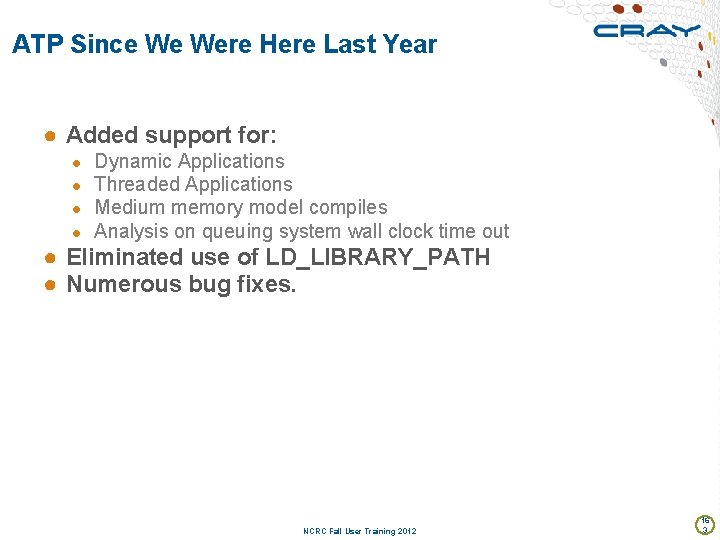
ATP Since We Were Here Last Year ● Added support for: ● ● Dynamic Applications Threaded Applications Medium memory model compiles Analysis on queuing system wall clock time out ● Eliminated use of LD_LIBRARY_PATH ● Numerous bug fixes. NCRC Fall User Training 2012 16 3

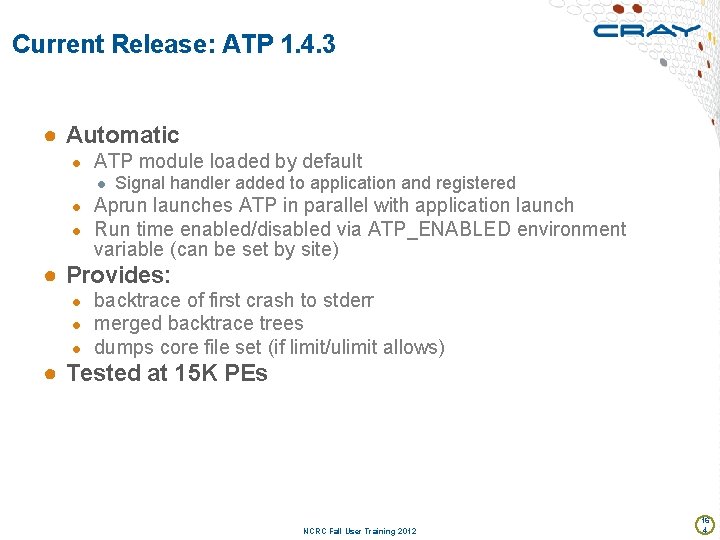
Current Release: ATP 1. 4. 3 ● Automatic ● ATP module loaded by default ● Signal handler added to application and registered ● Aprun launches ATP in parallel with application launch ● Run time enabled/disabled via ATP_ENABLED environment variable (can be set by site) ● Provides: ● backtrace of first crash to stderr ● merged backtrace trees ● dumps core file set (if limit/ulimit allows) ● Tested at 15 K PEs NCRC Fall User Training 2012 16 4