IPEDS Peer Analysis System Advanced Module The place
![IPEDS Peer Analysis System Advanced Module The place to go for IPEDS data: http: IPEDS Peer Analysis System Advanced Module The place to go for IPEDS data: http:](https://slidetodoc.com/presentation_image_h2/93f2b39236fa06cdaf1b191efd60ec6c/image-1.jpg)
![Session Agenda ■ Data availability and issues ■ Important data concepts ■ Review of Session Agenda ■ Data availability and issues ■ Important data concepts ■ Review of](https://slidetodoc.com/presentation_image_h2/93f2b39236fa06cdaf1b191efd60ec6c/image-2.jpg)
![Data Available in the Peer Analysis System ■ 1980, 1984, 1985 HEGIS data ■ Data Available in the Peer Analysis System ■ 1980, 1984, 1985 HEGIS data ■](https://slidetodoc.com/presentation_image_h2/93f2b39236fa06cdaf1b191efd60ec6c/image-3.jpg)
![Availability Caveats ■ Not all data are available for all years ■ New surveys Availability Caveats ■ Not all data are available for all years ■ New surveys](https://slidetodoc.com/presentation_image_h2/93f2b39236fa06cdaf1b191efd60ec6c/image-4.jpg)
![Data Availability by Year Data Availability by Year](https://slidetodoc.com/presentation_image_h2/93f2b39236fa06cdaf1b191efd60ec6c/image-5.jpg)
![Data Issues ■ Changes in finance reporting standards began in 1997 and have been Data Issues ■ Changes in finance reporting standards began in 1997 and have been](https://slidetodoc.com/presentation_image_h2/93f2b39236fa06cdaf1b191efd60ec6c/image-6.jpg)
![More Data Issues ■ Some data required in alternate years, but some schools submit More Data Issues ■ Some data required in alternate years, but some schools submit](https://slidetodoc.com/presentation_image_h2/93f2b39236fa06cdaf1b191efd60ec6c/image-7.jpg)
![And More Data Issues… ■ Until submitting new variables is mandatory, not all schools And More Data Issues… ■ Until submitting new variables is mandatory, not all schools](https://slidetodoc.com/presentation_image_h2/93f2b39236fa06cdaf1b191efd60ec6c/image-8.jpg)
![Important Data Concepts 1. Collection year vs. data year 2. Imputation and perturbation 3. Important Data Concepts 1. Collection year vs. data year 2. Imputation and perturbation 3.](https://slidetodoc.com/presentation_image_h2/93f2b39236fa06cdaf1b191efd60ec6c/image-9.jpg)
![1. Collection Year vs. Data Year ■ Collection year: academic year in which the 1. Collection Year vs. Data Year ■ Collection year: academic year in which the](https://slidetodoc.com/presentation_image_h2/93f2b39236fa06cdaf1b191efd60ec6c/image-10.jpg)
![Status by Survey Component Status by Survey Component](https://slidetodoc.com/presentation_image_h2/93f2b39236fa06cdaf1b191efd60ec6c/image-11.jpg)
![Master Variables List Selection The surveys and the years for which data are available Master Variables List Selection The surveys and the years for which data are available](https://slidetodoc.com/presentation_image_h2/93f2b39236fa06cdaf1b191efd60ec6c/image-12.jpg)
![2. Disclosure Protection ■ NCES is required by law to protect against disclosure of 2. Disclosure Protection ■ NCES is required by law to protect against disclosure of](https://slidetodoc.com/presentation_image_h2/93f2b39236fa06cdaf1b191efd60ec6c/image-13.jpg)
![Perturbation ■ Random alteration of data in cells with small number of observations ■ Perturbation ■ Random alteration of data in cells with small number of observations ■](https://slidetodoc.com/presentation_image_h2/93f2b39236fa06cdaf1b191efd60ec6c/image-14.jpg)
![Data Sharing ■ Data that an institution puts into IPEDS ─ ─ ─ ■ Data Sharing ■ Data that an institution puts into IPEDS ─ ─ ─ ■](https://slidetodoc.com/presentation_image_h2/93f2b39236fa06cdaf1b191efd60ec6c/image-15.jpg)
![This pop-up window precedes any data access. You must agree to the terms in This pop-up window precedes any data access. You must agree to the terms in](https://slidetodoc.com/presentation_image_h2/93f2b39236fa06cdaf1b191efd60ec6c/image-16.jpg)
![Imputation ■ IPEDS data are imputed for total nonresponse and item nonresponse ─ Various Imputation ■ IPEDS data are imputed for total nonresponse and item nonresponse ─ Various](https://slidetodoc.com/presentation_image_h2/93f2b39236fa06cdaf1b191efd60ec6c/image-17.jpg)
![3. Data Release Stages ■ Pre-release: login at collection level ─ Data are reviewed 3. Data Release Stages ■ Pre-release: login at collection level ─ Data are reviewed](https://slidetodoc.com/presentation_image_h2/93f2b39236fa06cdaf1b191efd60ec6c/image-18.jpg)
![4. Structure of IPEDS Data Files ■ Single-record files contain one line of data 4. Structure of IPEDS Data Files ■ Single-record files contain one line of data](https://slidetodoc.com/presentation_image_h2/93f2b39236fa06cdaf1b191efd60ec6c/image-19.jpg)
![Single-Record File Single-Record File](https://slidetodoc.com/presentation_image_h2/93f2b39236fa06cdaf1b191efd60ec6c/image-20.jpg)
![Multiple-Record File Multiple-Record File](https://slidetodoc.com/presentation_image_h2/93f2b39236fa06cdaf1b191efd60ec6c/image-21.jpg)
![Qualifying Variables ■ When choosing variables from multiplerecord files, the user must first specify Qualifying Variables ■ When choosing variables from multiplerecord files, the user must first specify](https://slidetodoc.com/presentation_image_h2/93f2b39236fa06cdaf1b191efd60ec6c/image-22.jpg)
![For example, in order to select Hispanic students, you must specify which Hispanic students. For example, in order to select Hispanic students, you must specify which Hispanic students.](https://slidetodoc.com/presentation_image_h2/93f2b39236fa06cdaf1b191efd60ec6c/image-23.jpg)
![Then select Hispanic men and Hispanic women. Then select Hispanic men and Hispanic women.](https://slidetodoc.com/presentation_image_h2/93f2b39236fa06cdaf1b191efd60ec6c/image-24.jpg)
![The resulting PAS file will contain a value for each possible combination: The resulting PAS file will contain a value for each possible combination:](https://slidetodoc.com/presentation_image_h2/93f2b39236fa06cdaf1b191efd60ec6c/image-25.jpg)
![5. Frequently Used/Derived Variables ■ Permanent “calculated variables ─ frequently used “institution” variables, e. 5. Frequently Used/Derived Variables ■ Permanent “calculated variables ─ frequently used “institution” variables, e.](https://slidetodoc.com/presentation_image_h2/93f2b39236fa06cdaf1b191efd60ec6c/image-26.jpg)
![The Peer Analysis System is the fastest way to capture IPEDS data for your The Peer Analysis System is the fastest way to capture IPEDS data for your](https://slidetodoc.com/presentation_image_h2/93f2b39236fa06cdaf1b191efd60ec6c/image-27.jpg)
![Analysis Strategy ■ Select a group of colleges and universities ■ Identify variables for Analysis Strategy ■ Select a group of colleges and universities ■ Identify variables for](https://slidetodoc.com/presentation_image_h2/93f2b39236fa06cdaf1b191efd60ec6c/image-28.jpg)
![3 Steps to Peer Analysis: 1. Identify a Linch. Pin institution • the institution 3 Steps to Peer Analysis: 1. Identify a Linch. Pin institution • the institution](https://slidetodoc.com/presentation_image_h2/93f2b39236fa06cdaf1b191efd60ec6c/image-29.jpg)
![Comparison Group ■ Three methods of construction ─ Select by name or Unit. ID Comparison Group ■ Three methods of construction ─ Select by name or Unit. ID](https://slidetodoc.com/presentation_image_h2/93f2b39236fa06cdaf1b191efd60ec6c/image-30.jpg)
![Types of Analyses = Reports & Stats ■ Ranking report ─ One variable, with Types of Analyses = Reports & Stats ■ Ranking report ─ One variable, with](https://slidetodoc.com/presentation_image_h2/93f2b39236fa06cdaf1b191efd60ec6c/image-31.jpg)
![Master Variables List ■ Stores all variables used in a session ■ Accessible through Master Variables List ■ Stores all variables used in a session ■ Accessible through](https://slidetodoc.com/presentation_image_h2/93f2b39236fa06cdaf1b191efd60ec6c/image-32.jpg)
![Calculated Variables ■ Three types: ─ Summation ─ Difference ─ Ratio ■ Can be Calculated Variables ■ Three types: ─ Summation ─ Difference ─ Ratio ■ Can be](https://slidetodoc.com/presentation_image_h2/93f2b39236fa06cdaf1b191efd60ec6c/image-33.jpg)
![Support During Your Session ■ Session Summary ─ via Main Menu ■ On-line User Support During Your Session ■ Session Summary ─ via Main Menu ■ On-line User](https://slidetodoc.com/presentation_image_h2/93f2b39236fa06cdaf1b191efd60ec6c/image-34.jpg)
![Log On to the Peer Analysis System http: //nces. ed. gov/ipeds Log On to the Peer Analysis System http: //nces. ed. gov/ipeds](https://slidetodoc.com/presentation_image_h2/93f2b39236fa06cdaf1b191efd60ec6c/image-35.jpg)
![Select the Peer Analysis System Select the Peer Analysis System](https://slidetodoc.com/presentation_image_h2/93f2b39236fa06cdaf1b191efd60ec6c/image-36.jpg)
![Login at the Institution level, which includes early release data with missing values not Login at the Institution level, which includes early release data with missing values not](https://slidetodoc.com/presentation_image_h2/93f2b39236fa06cdaf1b191efd60ec6c/image-37.jpg)
![1. Enter User ID (an IPEDS Unit. ID) 2. Enter Password (same Unit. ID) 1. Enter User ID (an IPEDS Unit. ID) 2. Enter Password (same Unit. ID)](https://slidetodoc.com/presentation_image_h2/93f2b39236fa06cdaf1b191efd60ec6c/image-38.jpg)
![You can use your own institution as Linch. Pin, or select another school that You can use your own institution as Linch. Pin, or select another school that](https://slidetodoc.com/presentation_image_h2/93f2b39236fa06cdaf1b191efd60ec6c/image-39.jpg)
![Session Summary identifies the Linch. Pin institution with no institutions in the comparison group Session Summary identifies the Linch. Pin institution with no institutions in the comparison group](https://slidetodoc.com/presentation_image_h2/93f2b39236fa06cdaf1b191efd60ec6c/image-40.jpg)
![Research Question ■ What is the average first-year tuition discount rate for private schools Research Question ■ What is the average first-year tuition discount rate for private schools](https://slidetodoc.com/presentation_image_h2/93f2b39236fa06cdaf1b191efd60ec6c/image-41.jpg)
![Calculation Strategy Michael Duggan and Rebecca Matthews developed the following strategy: Freshman discount rate Calculation Strategy Michael Duggan and Rebecca Matthews developed the following strategy: Freshman discount rate](https://slidetodoc.com/presentation_image_h2/93f2b39236fa06cdaf1b191efd60ec6c/image-42.jpg)
![Variables Required ■ For gross tuition revenue generated by new freshmen: ─ Tuition rate Variables Required ■ For gross tuition revenue generated by new freshmen: ─ Tuition rate](https://slidetodoc.com/presentation_image_h2/93f2b39236fa06cdaf1b191efd60ec6c/image-43.jpg)
![IPEDS Survey Sources Constraint: The most recent financial aid data is 2003 -04, so IPEDS Survey Sources Constraint: The most recent financial aid data is 2003 -04, so](https://slidetodoc.com/presentation_image_h2/93f2b39236fa06cdaf1b191efd60ec6c/image-44.jpg)
![Define Comparison Group ■ From Institutional Characteristics, 2003, add ─ State abbreviation ─ Sector Define Comparison Group ■ From Institutional Characteristics, 2003, add ─ State abbreviation ─ Sector](https://slidetodoc.com/presentation_image_h2/93f2b39236fa06cdaf1b191efd60ec6c/image-45.jpg)
![Build Master Variables List ■ From Institutional Characteristics and Student Charges, 2003, add: ─ Build Master Variables List ■ From Institutional Characteristics and Student Charges, 2003, add: ─](https://slidetodoc.com/presentation_image_h2/93f2b39236fa06cdaf1b191efd60ec6c/image-46.jpg)
![■ From Enrollments, 2003, from Total entering class: Fall 2003, add ─ Full-time first-time ■ From Enrollments, 2003, from Total entering class: Fall 2003, add ─ Full-time first-time](https://slidetodoc.com/presentation_image_h2/93f2b39236fa06cdaf1b191efd60ec6c/image-47.jpg)
![■ From Student Financial Aid, 2004, from Student counts and financial aid, academic year ■ From Student Financial Aid, 2004, from Student counts and financial aid, academic year](https://slidetodoc.com/presentation_image_h2/93f2b39236fa06cdaf1b191efd60ec6c/image-48.jpg)
![Run Institutions Data Report ■ Select Reports and Stats, Institutions Data Report ■ From Run Institutions Data Report ■ Select Reports and Stats, Institutions Data Report ■ From](https://slidetodoc.com/presentation_image_h2/93f2b39236fa06cdaf1b191efd60ec6c/image-49.jpg)
![…and it looks like this …and it looks like this](https://slidetodoc.com/presentation_image_h2/93f2b39236fa06cdaf1b191efd60ec6c/image-50.jpg)
![Do Calculations in Excel ■ Total Tuition and Fees (tuition x number in freshman Do Calculations in Excel ■ Total Tuition and Fees (tuition x number in freshman](https://slidetodoc.com/presentation_image_h2/93f2b39236fa06cdaf1b191efd60ec6c/image-51.jpg)
![Create an Attractive Report ■ Add a report title ■ Adjust column widths and Create an Attractive Report ■ Add a report title ■ Adjust column widths and](https://slidetodoc.com/presentation_image_h2/93f2b39236fa06cdaf1b191efd60ec6c/image-52.jpg)
![-Total Tuition Revenue -Total Grant Aid - Freshman Discount Rate Add a title, modify -Total Tuition Revenue -Total Grant Aid - Freshman Discount Rate Add a title, modify](https://slidetodoc.com/presentation_image_h2/93f2b39236fa06cdaf1b191efd60ec6c/image-53.jpg)
![Research Questions ■ What percent of “core” expenditures (as defined by NCES) is represented Research Questions ■ What percent of “core” expenditures (as defined by NCES) is represented](https://slidetodoc.com/presentation_image_h2/93f2b39236fa06cdaf1b191efd60ec6c/image-54.jpg)
![Define Comparison Group ■ Add by Variable ■ From Institutional Characteristics, 2004, add ─ Define Comparison Group ■ Add by Variable ■ From Institutional Characteristics, 2004, add ─](https://slidetodoc.com/presentation_image_h2/93f2b39236fa06cdaf1b191efd60ec6c/image-55.jpg)
![Query Form Query Form](https://slidetodoc.com/presentation_image_h2/93f2b39236fa06cdaf1b191efd60ec6c/image-56.jpg)
![Comparison Group Comparison Group](https://slidetodoc.com/presentation_image_h2/93f2b39236fa06cdaf1b191efd60ec6c/image-57.jpg)
![Add to Master Variables List ■ From Finance, 2004, from Frequently used financial indicators Add to Master Variables List ■ From Finance, 2004, from Frequently used financial indicators](https://slidetodoc.com/presentation_image_h2/93f2b39236fa06cdaf1b191efd60ec6c/image-58.jpg)
![■ ‘Core expenses, total dollar’ must be calculated for 2002 and 2003. According to ■ ‘Core expenses, total dollar’ must be calculated for 2002 and 2003. According to](https://slidetodoc.com/presentation_image_h2/93f2b39236fa06cdaf1b191efd60ec6c/image-59.jpg)
![■ From Finance, 2002 and 2003, from Public institutions - GASB 34/35: Fiscal year ■ From Finance, 2002 and 2003, from Public institutions - GASB 34/35: Fiscal year](https://slidetodoc.com/presentation_image_h2/93f2b39236fa06cdaf1b191efd60ec6c/image-60.jpg)
![Calculated Variables ■ Create two summation variables ─ Core Expenses 2003 ─ Core Expenses Calculated Variables ■ Create two summation variables ─ Core Expenses 2003 ─ Core Expenses](https://slidetodoc.com/presentation_image_h2/93f2b39236fa06cdaf1b191efd60ec6c/image-61.jpg)
![Recursive Calculated Variables ■ Create two ratio variables: ─ Instruction as a Percent of Recursive Calculated Variables ■ Create two ratio variables: ─ Instruction as a Percent of](https://slidetodoc.com/presentation_image_h2/93f2b39236fa06cdaf1b191efd60ec6c/image-62.jpg)
![Check to see if the columns are in chronological order, and fix them if Check to see if the columns are in chronological order, and fix them if](https://slidetodoc.com/presentation_image_h2/93f2b39236fa06cdaf1b191efd60ec6c/image-63.jpg)
![Create an Attractive Report ■ Add a report title ■ Adjust column widths and Create an Attractive Report ■ Add a report title ■ Adjust column widths and](https://slidetodoc.com/presentation_image_h2/93f2b39236fa06cdaf1b191efd60ec6c/image-64.jpg)
![](https://slidetodoc.com/presentation_image_h2/93f2b39236fa06cdaf1b191efd60ec6c/image-65.jpg)
![](https://slidetodoc.com/presentation_image_h2/93f2b39236fa06cdaf1b191efd60ec6c/image-66.jpg)
![Research Questions ■ How many schools offer doctorates in Exercise Science? ■ How many Research Questions ■ How many schools offer doctorates in Exercise Science? ■ How many](https://slidetodoc.com/presentation_image_h2/93f2b39236fa06cdaf1b191efd60ec6c/image-67.jpg)
![Build Master Variables List From 2003, 2004, 2005 Completions: ■ Qualifying variables: ─ CIP Build Master Variables List From 2003, 2004, 2005 Completions: ■ Qualifying variables: ─ CIP](https://slidetodoc.com/presentation_image_h2/93f2b39236fa06cdaf1b191efd60ec6c/image-68.jpg)
![Comparison Group Strategy Because Exercise Science is a relatively small degree-producing program, you want Comparison Group Strategy Because Exercise Science is a relatively small degree-producing program, you want](https://slidetodoc.com/presentation_image_h2/93f2b39236fa06cdaf1b191efd60ec6c/image-69.jpg)
![Define Comparison Group From Master Variables List: ■ Select only Exercise Sci doctorates, 2002 Define Comparison Group From Master Variables List: ■ Select only Exercise Sci doctorates, 2002](https://slidetodoc.com/presentation_image_h2/93f2b39236fa06cdaf1b191efd60ec6c/image-70.jpg)
![■ Select only Exercise Sci doctorates, 2003 -04 ─ Go to the query form; ■ Select only Exercise Sci doctorates, 2003 -04 ─ Go to the query form;](https://slidetodoc.com/presentation_image_h2/93f2b39236fa06cdaf1b191efd60ec6c/image-71.jpg)
![■ Select only Exercise Sci doctorates, 2004 -05 ─ Go to the query form; ■ Select only Exercise Sci doctorates, 2004 -05 ─ Go to the query form;](https://slidetodoc.com/presentation_image_h2/93f2b39236fa06cdaf1b191efd60ec6c/image-72.jpg)
![Your sample contains 34 schools that awarded one or more doctorates in Exercise Science Your sample contains 34 schools that awarded one or more doctorates in Exercise Science](https://slidetodoc.com/presentation_image_h2/93f2b39236fa06cdaf1b191efd60ec6c/image-73.jpg)
![Run Institutions Data Report ■ Select Reports and Stats, Institutions Data Report ■ From Run Institutions Data Report ■ Select Reports and Stats, Institutions Data Report ■ From](https://slidetodoc.com/presentation_image_h2/93f2b39236fa06cdaf1b191efd60ec6c/image-74.jpg)
![Your raw data file should look like this. Note that some schools did not Your raw data file should look like this. Note that some schools did not](https://slidetodoc.com/presentation_image_h2/93f2b39236fa06cdaf1b191efd60ec6c/image-75.jpg)
![Create an Attractive Report ■ Add a report title ■ Adjust column widths and Create an Attractive Report ■ Add a report title ■ Adjust column widths and](https://slidetodoc.com/presentation_image_h2/93f2b39236fa06cdaf1b191efd60ec6c/image-76.jpg)
![You can print these results and distribute them! You can print these results and distribute them!](https://slidetodoc.com/presentation_image_h2/93f2b39236fa06cdaf1b191efd60ec6c/image-77.jpg)
![Questions? Comments? Feedback? Questions? Comments? Feedback?](https://slidetodoc.com/presentation_image_h2/93f2b39236fa06cdaf1b191efd60ec6c/image-78.jpg)
- Slides: 78
![IPEDS Peer Analysis System Advanced Module The place to go for IPEDS data http IPEDS Peer Analysis System Advanced Module The place to go for IPEDS data: http:](https://slidetodoc.com/presentation_image_h2/93f2b39236fa06cdaf1b191efd60ec6c/image-1.jpg)
IPEDS Peer Analysis System Advanced Module The place to go for IPEDS data: http: //nces. ed. gov/ipeds
![Session Agenda Data availability and issues Important data concepts Review of Session Agenda ■ Data availability and issues ■ Important data concepts ■ Review of](https://slidetodoc.com/presentation_image_h2/93f2b39236fa06cdaf1b191efd60ec6c/image-2.jpg)
Session Agenda ■ Data availability and issues ■ Important data concepts ■ Review of Peer Analysis System ─ Basics ─ Advanced features ■ Research Questions with PAS ─ Average freshman tuition discount ─ Expenditure comparison ─ Schools offering a specific degree
![Data Available in the Peer Analysis System 1980 1984 1985 HEGIS data Data Available in the Peer Analysis System ■ 1980, 1984, 1985 HEGIS data ■](https://slidetodoc.com/presentation_image_h2/93f2b39236fa06cdaf1b191efd60ec6c/image-3.jpg)
Data Available in the Peer Analysis System ■ 1980, 1984, 1985 HEGIS data ■ 1986 – 2004 IPEDS data ■ Selected HEGIS data not in the PAS are available at through the International Archive of Education Data housed at the University of Michigan.
![Availability Caveats Not all data are available for all years New surveys Availability Caveats ■ Not all data are available for all years ■ New surveys](https://slidetodoc.com/presentation_image_h2/93f2b39236fa06cdaf1b191efd60ec6c/image-4.jpg)
Availability Caveats ■ Not all data are available for all years ■ New surveys have been added over time ■ Some data fields have been discontinued ■ New data fields have been added ■ Definitions may change
![Data Availability by Year Data Availability by Year](https://slidetodoc.com/presentation_image_h2/93f2b39236fa06cdaf1b191efd60ec6c/image-5.jpg)
Data Availability by Year
![Data Issues Changes in finance reporting standards began in 1997 and have been Data Issues ■ Changes in finance reporting standards began in 1997 and have been](https://slidetodoc.com/presentation_image_h2/93f2b39236fa06cdaf1b191efd60ec6c/image-6.jpg)
Data Issues ■ Changes in finance reporting standards began in 1997 and have been phased in over a period of time. Now, most privates use FASB and most publics use GASB. However, there is still great variability in Finance data that makes inter-institutional comparisons problematic.
![More Data Issues Some data required in alternate years but some schools submit More Data Issues ■ Some data required in alternate years, but some schools submit](https://slidetodoc.com/presentation_image_h2/93f2b39236fa06cdaf1b191efd60ec6c/image-7.jpg)
More Data Issues ■ Some data required in alternate years, but some schools submit for all years: ─ Enrollment by age: odd years ─ Residence of first-year students: even years ─ Fall staff: odd years Be very careful working with data from the years when submission is not required.
![And More Data Issues Until submitting new variables is mandatory not all schools And More Data Issues… ■ Until submitting new variables is mandatory, not all schools](https://slidetodoc.com/presentation_image_h2/93f2b39236fa06cdaf1b191efd60ec6c/image-8.jpg)
And More Data Issues… ■ Until submitting new variables is mandatory, not all schools submit data for them. ■ Continuing education is defined differently by different schools. ■ NCES began allowing schools to enter their own FTE values for 2002 -03 data year
![Important Data Concepts 1 Collection year vs data year 2 Imputation and perturbation 3 Important Data Concepts 1. Collection year vs. data year 2. Imputation and perturbation 3.](https://slidetodoc.com/presentation_image_h2/93f2b39236fa06cdaf1b191efd60ec6c/image-9.jpg)
Important Data Concepts 1. Collection year vs. data year 2. Imputation and perturbation 3. Release sequence of IPEDS data 4. Structure of IPEDS data files 5. Frequently used/derived variables
![1 Collection Year vs Data Year Collection year academic year in which the 1. Collection Year vs. Data Year ■ Collection year: academic year in which the](https://slidetodoc.com/presentation_image_h2/93f2b39236fa06cdaf1b191efd60ec6c/image-10.jpg)
1. Collection Year vs. Data Year ■ Collection year: academic year in which the data are collected by NCES during the fall, winter, and spring collection cycle ■ Data year: academic year the data represent, which may be prior to the collection year
![Status by Survey Component Status by Survey Component](https://slidetodoc.com/presentation_image_h2/93f2b39236fa06cdaf1b191efd60ec6c/image-11.jpg)
Status by Survey Component
![Master Variables List Selection The surveys and the years for which data are available Master Variables List Selection The surveys and the years for which data are available](https://slidetodoc.com/presentation_image_h2/93f2b39236fa06cdaf1b191efd60ec6c/image-12.jpg)
Master Variables List Selection The surveys and the years for which data are available are displayed on the Master Variables List Selection screen.
![2 Disclosure Protection NCES is required by law to protect against disclosure of 2. Disclosure Protection ■ NCES is required by law to protect against disclosure of](https://slidetodoc.com/presentation_image_h2/93f2b39236fa06cdaf1b191efd60ec6c/image-13.jpg)
2. Disclosure Protection ■ NCES is required by law to protect against disclosure of individually identifiable information collected in the IPEDS surveys ■ Impacts four IPEDS data files: ─Graduation Rates ─Student Financial Aid ─Salaries ─Fall Staff
![Perturbation Random alteration of data in cells with small number of observations Perturbation ■ Random alteration of data in cells with small number of observations ■](https://slidetodoc.com/presentation_image_h2/93f2b39236fa06cdaf1b191efd60ec6c/image-14.jpg)
Perturbation ■ Random alteration of data in cells with small number of observations ■ Protects the confidentiality of individually identifiable data ■ Occurs during migration of data from data collection system to the PAS ■ It’s unpopular—but the alternative is data suppression
![Data Sharing Data that an institution puts into IPEDS Data Sharing ■ Data that an institution puts into IPEDS ─ ─ ─ ■](https://slidetodoc.com/presentation_image_h2/93f2b39236fa06cdaf1b191efd60ec6c/image-15.jpg)
Data Sharing ■ Data that an institution puts into IPEDS ─ ─ ─ ■ Data IN the IPEDS data collection system ─ ─ ─ ■ Belong to the institution May be shared BUT, may be subject to FERPA Technically belong to NCES Are subject to NCES confidentiality requirements May NOT be shared Data in the IPEDS Peer Analysis System ─ ─ ─ Have been perturbed Protect individually identifiable information May be shared
![This popup window precedes any data access You must agree to the terms in This pop-up window precedes any data access. You must agree to the terms in](https://slidetodoc.com/presentation_image_h2/93f2b39236fa06cdaf1b191efd60ec6c/image-16.jpg)
This pop-up window precedes any data access. You must agree to the terms in order to proceed with your analysis.
![Imputation IPEDS data are imputed for total nonresponse and item nonresponse Various Imputation ■ IPEDS data are imputed for total nonresponse and item nonresponse ─ Various](https://slidetodoc.com/presentation_image_h2/93f2b39236fa06cdaf1b191efd60ec6c/image-17.jpg)
Imputation ■ IPEDS data are imputed for total nonresponse and item nonresponse ─ Various methods used such as prior year adjusted values, nearest neighbor, group means ■ Imputation allows files to be used for national totals ■ Imputed values appear on final data files ■ Web data input has dramatically reduced the need to impute data values
![3 Data Release Stages Prerelease login at collection level Data are reviewed 3. Data Release Stages ■ Pre-release: login at collection level ─ Data are reviewed](https://slidetodoc.com/presentation_image_h2/93f2b39236fa06cdaf1b191efd60ec6c/image-18.jpg)
3. Data Release Stages ■ Pre-release: login at collection level ─ Data are reviewed and perturbed ─ Locked institutions are migrated to PAS ─ Data available for peer comparisons only ■ Early release: login at institution level ─ All institutions are migrated to PAS ─ Data available for peer comparisons only ■ Final release: login at guest level ─ Data are imputed and fully adjudicated ─ No restrictions on data use
![4 Structure of IPEDS Data Files Singlerecord files contain one line of data 4. Structure of IPEDS Data Files ■ Single-record files contain one line of data](https://slidetodoc.com/presentation_image_h2/93f2b39236fa06cdaf1b191efd60ec6c/image-19.jpg)
4. Structure of IPEDS Data Files ■ Single-record files contain one line of data for each institution—for example, data in the Institutional Characteristics survey ■ Multiple-record files contain several lines of data for each institution—for example, data by race/ethnicity and gender in the Enrollment survey
![SingleRecord File Single-Record File](https://slidetodoc.com/presentation_image_h2/93f2b39236fa06cdaf1b191efd60ec6c/image-20.jpg)
Single-Record File
![MultipleRecord File Multiple-Record File](https://slidetodoc.com/presentation_image_h2/93f2b39236fa06cdaf1b191efd60ec6c/image-21.jpg)
Multiple-Record File
![Qualifying Variables When choosing variables from multiplerecord files the user must first specify Qualifying Variables ■ When choosing variables from multiplerecord files, the user must first specify](https://slidetodoc.com/presentation_image_h2/93f2b39236fa06cdaf1b191efd60ec6c/image-22.jpg)
Qualifying Variables ■ When choosing variables from multiplerecord files, the user must first specify the qualifying variables ■ The user’s choice tells PAS which records to select for the analysis
![For example in order to select Hispanic students you must specify which Hispanic students For example, in order to select Hispanic students, you must specify which Hispanic students.](https://slidetodoc.com/presentation_image_h2/93f2b39236fa06cdaf1b191efd60ec6c/image-23.jpg)
For example, in order to select Hispanic students, you must specify which Hispanic students. All Hispanic students? Full-time Hispanic students? Undergraduate Hispanic students? Level of student is the qualifying variable that lets you to choose. Here, choose Full-time students total and Part-time students total.
![Then select Hispanic men and Hispanic women Then select Hispanic men and Hispanic women.](https://slidetodoc.com/presentation_image_h2/93f2b39236fa06cdaf1b191efd60ec6c/image-24.jpg)
Then select Hispanic men and Hispanic women.
![The resulting PAS file will contain a value for each possible combination The resulting PAS file will contain a value for each possible combination:](https://slidetodoc.com/presentation_image_h2/93f2b39236fa06cdaf1b191efd60ec6c/image-25.jpg)
The resulting PAS file will contain a value for each possible combination:
![5 Frequently UsedDerived Variables Permanent calculated variables frequently used institution variables e 5. Frequently Used/Derived Variables ■ Permanent “calculated variables ─ frequently used “institution” variables, e.](https://slidetodoc.com/presentation_image_h2/93f2b39236fa06cdaf1b191efd60ec6c/image-26.jpg)
5. Frequently Used/Derived Variables ■ Permanent “calculated variables ─ frequently used “institution” variables, e. g. , total enrollment, tuition and fees ─ data feedback report variables ─ College Affordability Index variables ■ Developed by NCES from existing IPEDS survey variables ■ Available beginning in 2002
![The Peer Analysis System is the fastest way to capture IPEDS data for your The Peer Analysis System is the fastest way to capture IPEDS data for your](https://slidetodoc.com/presentation_image_h2/93f2b39236fa06cdaf1b191efd60ec6c/image-27.jpg)
The Peer Analysis System is the fastest way to capture IPEDS data for your analyses! Review of strategies
![Analysis Strategy Select a group of colleges and universities Identify variables for Analysis Strategy ■ Select a group of colleges and universities ■ Identify variables for](https://slidetodoc.com/presentation_image_h2/93f2b39236fa06cdaf1b191efd60ec6c/image-28.jpg)
Analysis Strategy ■ Select a group of colleges and universities ■ Identify variables for years of interest and retrieve those data for the group of schools ■ Generate reports useful for policy analysis, peer comparisons, assessment, administrative decision-making, etc.
![3 Steps to Peer Analysis 1 Identify a Linch Pin institution the institution 3 Steps to Peer Analysis: 1. Identify a Linch. Pin institution • the institution](https://slidetodoc.com/presentation_image_h2/93f2b39236fa06cdaf1b191efd60ec6c/image-29.jpg)
3 Steps to Peer Analysis: 1. Identify a Linch. Pin institution • the institution you want to compare with others 2. Construct a comparison group 3. Prepare your analysis • generate reports, files, statistics, graphs
![Comparison Group Three methods of construction Select by name or Unit ID Comparison Group ■ Three methods of construction ─ Select by name or Unit. ID](https://slidetodoc.com/presentation_image_h2/93f2b39236fa06cdaf1b191efd60ec6c/image-30.jpg)
Comparison Group ■ Three methods of construction ─ Select by name or Unit. ID ─ Select by variable (shared characteristics) ─ Auto peer group ■ Peer groups can be saved to your hard drive for later use as files with a ‘uid’ extension
![Types of Analyses Reports Stats Ranking report One variable with Types of Analyses = Reports & Stats ■ Ranking report ─ One variable, with](https://slidetodoc.com/presentation_image_h2/93f2b39236fa06cdaf1b191efd60ec6c/image-31.jpg)
Types of Analyses = Reports & Stats ■ Ranking report ─ One variable, with values sorted high to low ■ Institutions Data report ─ Multiple variables, perhaps from multiple files ■ Statistical Summary report ─ Basic descriptive statistics, with optional graphs ■ Report Templates ─ Prepackaged formats ■ Forms Facsimile ─ Survey data, presented in survey grid format
![Master Variables List Stores all variables used in a session Accessible through Master Variables List ■ Stores all variables used in a session ■ Accessible through](https://slidetodoc.com/presentation_image_h2/93f2b39236fa06cdaf1b191efd60ec6c/image-32.jpg)
Master Variables List ■ Stores all variables used in a session ■ Accessible through Main Menu Session Summary ■ Lists can be saved to your hard drive with an. mvl extension
![Calculated Variables Three types Summation Difference Ratio Can be Calculated Variables ■ Three types: ─ Summation ─ Difference ─ Ratio ■ Can be](https://slidetodoc.com/presentation_image_h2/93f2b39236fa06cdaf1b191efd60ec6c/image-33.jpg)
Calculated Variables ■ Three types: ─ Summation ─ Difference ─ Ratio ■ Can be built from IPEDS variables ■ Can be built from calculated variables ■ Can be saved to your hard drive as part of a Master Variables List
![Support During Your Session Session Summary via Main Menu Online User Support During Your Session ■ Session Summary ─ via Main Menu ■ On-line User](https://slidetodoc.com/presentation_image_h2/93f2b39236fa06cdaf1b191efd60ec6c/image-34.jpg)
Support During Your Session ■ Session Summary ─ via Main Menu ■ On-line User Manual ─ can be printed ■ Help buttons ─ available on most pages ■ Info buttons ─ define variable characteristics
![Log On to the Peer Analysis System http nces ed govipeds Log On to the Peer Analysis System http: //nces. ed. gov/ipeds](https://slidetodoc.com/presentation_image_h2/93f2b39236fa06cdaf1b191efd60ec6c/image-35.jpg)
Log On to the Peer Analysis System http: //nces. ed. gov/ipeds
![Select the Peer Analysis System Select the Peer Analysis System](https://slidetodoc.com/presentation_image_h2/93f2b39236fa06cdaf1b191efd60ec6c/image-36.jpg)
Select the Peer Analysis System
![Login at the Institution level which includes early release data with missing values not Login at the Institution level, which includes early release data with missing values not](https://slidetodoc.com/presentation_image_h2/93f2b39236fa06cdaf1b191efd60ec6c/image-37.jpg)
Login at the Institution level, which includes early release data with missing values not yet imputed.
![1 Enter User ID an IPEDS Unit ID 2 Enter Password same Unit ID 1. Enter User ID (an IPEDS Unit. ID) 2. Enter Password (same Unit. ID)](https://slidetodoc.com/presentation_image_h2/93f2b39236fa06cdaf1b191efd60ec6c/image-38.jpg)
1. Enter User ID (an IPEDS Unit. ID) 2. Enter Password (same Unit. ID) 3. Click the Login button You can use your institution’s Unit. ID or choose another. Find other Unit. IDs using IPEDS Cool.
![You can use your own institution as Linch Pin or select another school that You can use your own institution as Linch. Pin, or select another school that](https://slidetodoc.com/presentation_image_h2/93f2b39236fa06cdaf1b191efd60ec6c/image-39.jpg)
You can use your own institution as Linch. Pin, or select another school that you want as the focus of your analysis
![Session Summary identifies the Linch Pin institution with no institutions in the comparison group Session Summary identifies the Linch. Pin institution with no institutions in the comparison group](https://slidetodoc.com/presentation_image_h2/93f2b39236fa06cdaf1b191efd60ec6c/image-40.jpg)
Session Summary identifies the Linch. Pin institution with no institutions in the comparison group and no variables in the Master Variables List. Click on Main Menu whenever you want to see a Session Summary or to access your Master Variables List.
![Research Question What is the average firstyear tuition discount rate for private schools Research Question ■ What is the average first-year tuition discount rate for private schools](https://slidetodoc.com/presentation_image_h2/93f2b39236fa06cdaf1b191efd60ec6c/image-41.jpg)
Research Question ■ What is the average first-year tuition discount rate for private schools in California? Most private institutions allocate some of their own resources to fund scholarships to attract new students. In the aggregate, these scholarships reduce the institution’s average tuition.
![Calculation Strategy Michael Duggan and Rebecca Matthews developed the following strategy Freshman discount rate Calculation Strategy Michael Duggan and Rebecca Matthews developed the following strategy: Freshman discount rate](https://slidetodoc.com/presentation_image_h2/93f2b39236fa06cdaf1b191efd60ec6c/image-42.jpg)
Calculation Strategy Michael Duggan and Rebecca Matthews developed the following strategy: Freshman discount rate is the ratio of institutional grant aid to gross tuition revenue for the full-time first-time cohort.
![Variables Required For gross tuition revenue generated by new freshmen Tuition rate Variables Required ■ For gross tuition revenue generated by new freshmen: ─ Tuition rate](https://slidetodoc.com/presentation_image_h2/93f2b39236fa06cdaf1b191efd60ec6c/image-43.jpg)
Variables Required ■ For gross tuition revenue generated by new freshmen: ─ Tuition rate ─ Number of freshmen in cohort ■ For total institutional grant aid awarded to new freshmen: ─ Number of freshmen awarded institutional aid ─ Average amount of institutional aid awarded
![IPEDS Survey Sources Constraint The most recent financial aid data is 2003 04 so IPEDS Survey Sources Constraint: The most recent financial aid data is 2003 -04, so](https://slidetodoc.com/presentation_image_h2/93f2b39236fa06cdaf1b191efd60ec6c/image-44.jpg)
IPEDS Survey Sources Constraint: The most recent financial aid data is 2003 -04, so all variables should be selected for this year.
![Define Comparison Group From Institutional Characteristics 2003 add State abbreviation Sector Define Comparison Group ■ From Institutional Characteristics, 2003, add ─ State abbreviation ─ Sector](https://slidetodoc.com/presentation_image_h2/93f2b39236fa06cdaf1b191efd60ec6c/image-45.jpg)
Define Comparison Group ■ From Institutional Characteristics, 2003, add ─ State abbreviation ─ Sector of institution ■ To apply this exercise to public institutions, you would have to know the percentages of in-state and out-of-state students for each school.
![Build Master Variables List From Institutional Characteristics and Student Charges 2003 add Build Master Variables List ■ From Institutional Characteristics and Student Charges, 2003, add: ─](https://slidetodoc.com/presentation_image_h2/93f2b39236fa06cdaf1b191efd60ec6c/image-46.jpg)
Build Master Variables List ■ From Institutional Characteristics and Student Charges, 2003, add: ─ Published in-state tuition and fees 2003 -04 from Price of attendance of full-time, first-time undergraduate students (charges for full academic yr)
![From Enrollments 2003 from Total entering class Fall 2003 add Fulltime firsttime ■ From Enrollments, 2003, from Total entering class: Fall 2003, add ─ Full-time first-time](https://slidetodoc.com/presentation_image_h2/93f2b39236fa06cdaf1b191efd60ec6c/image-47.jpg)
■ From Enrollments, 2003, from Total entering class: Fall 2003, add ─ Full-time first-time degree/certificate-seeking undergraduate (current years GRS cohort)
![From Student Financial Aid 2004 from Student counts and financial aid academic year ■ From Student Financial Aid, 2004, from Student counts and financial aid, academic year](https://slidetodoc.com/presentation_image_h2/93f2b39236fa06cdaf1b191efd60ec6c/image-48.jpg)
■ From Student Financial Aid, 2004, from Student counts and financial aid, academic year 2003 -04, from Financial Aid: Full-Time First-Time Degree/Certificate-Seeking Undergraduates, add ─ Number receiving institutional grant aid ─ Average amount of institutional grant aid received
![Run Institutions Data Report Select Reports and Stats Institutions Data Report From Run Institutions Data Report ■ Select Reports and Stats, Institutions Data Report ■ From](https://slidetodoc.com/presentation_image_h2/93f2b39236fa06cdaf1b191efd60ec6c/image-49.jpg)
Run Institutions Data Report ■ Select Reports and Stats, Institutions Data Report ■ From your Master Variables List, select all four variables ■ Specify long variable names ■ Download your results in csv format and save as an Excel file
![and it looks like this …and it looks like this](https://slidetodoc.com/presentation_image_h2/93f2b39236fa06cdaf1b191efd60ec6c/image-50.jpg)
…and it looks like this
![Do Calculations in Excel Total Tuition and Fees tuition x number in freshman Do Calculations in Excel ■ Total Tuition and Fees (tuition x number in freshman](https://slidetodoc.com/presentation_image_h2/93f2b39236fa06cdaf1b191efd60ec6c/image-51.jpg)
Do Calculations in Excel ■ Total Tuition and Fees (tuition x number in freshman cohort) ■ Total Institutional Grant Aid (number receiving grant aid x average award) ■ Average Freshman Discount Rate (Institutional Grant Aid / Total Tuition & Fees)
![Create an Attractive Report Add a report title Adjust column widths and Create an Attractive Report ■ Add a report title ■ Adjust column widths and](https://slidetodoc.com/presentation_image_h2/93f2b39236fa06cdaf1b191efd60ec6c/image-52.jpg)
Create an Attractive Report ■ Add a report title ■ Adjust column widths and column titles ■ Sort from high to low on average freshman discount rate
![Total Tuition Revenue Total Grant Aid Freshman Discount Rate Add a title modify -Total Tuition Revenue -Total Grant Aid - Freshman Discount Rate Add a title, modify](https://slidetodoc.com/presentation_image_h2/93f2b39236fa06cdaf1b191efd60ec6c/image-53.jpg)
-Total Tuition Revenue -Total Grant Aid - Freshman Discount Rate Add a title, modify the headings, and format the numbers. It’s a report!
![Research Questions What percent of core expenditures as defined by NCES is represented Research Questions ■ What percent of “core” expenditures (as defined by NCES) is represented](https://slidetodoc.com/presentation_image_h2/93f2b39236fa06cdaf1b191efd60ec6c/image-54.jpg)
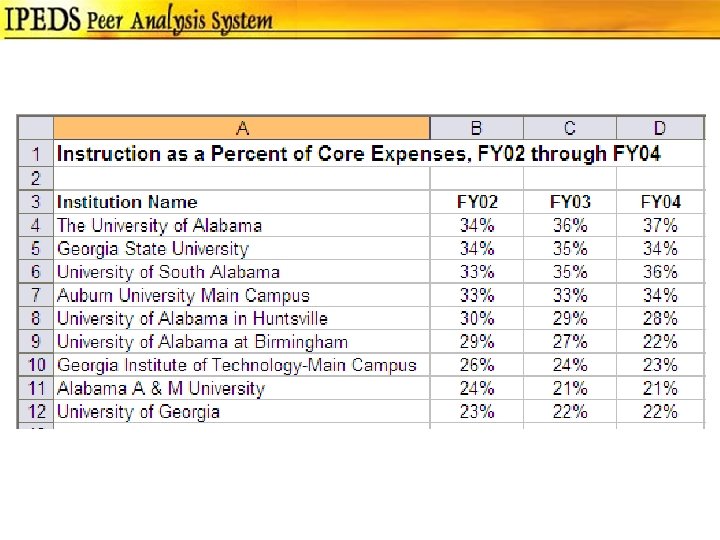
Research Questions ■ What percent of “core” expenditures (as defined by NCES) is represented by instruction? ■ Have these percentages changed between 2002 and 2004? Answer these questions for four-year public doctoral/research institutions in Georgia and Alabama.
![Define Comparison Group Add by Variable From Institutional Characteristics 2004 add Define Comparison Group ■ Add by Variable ■ From Institutional Characteristics, 2004, add ─](https://slidetodoc.com/presentation_image_h2/93f2b39236fa06cdaf1b191efd60ec6c/image-55.jpg)
Define Comparison Group ■ Add by Variable ■ From Institutional Characteristics, 2004, add ─ State abbreviation ─ Sector of institution ─ Carnegie Classification code
![Query Form Query Form](https://slidetodoc.com/presentation_image_h2/93f2b39236fa06cdaf1b191efd60ec6c/image-56.jpg)
Query Form
![Comparison Group Comparison Group](https://slidetodoc.com/presentation_image_h2/93f2b39236fa06cdaf1b191efd60ec6c/image-57.jpg)
Comparison Group
![Add to Master Variables List From Finance 2004 from Frequently used financial indicators Add to Master Variables List ■ From Finance, 2004, from Frequently used financial indicators](https://slidetodoc.com/presentation_image_h2/93f2b39236fa06cdaf1b191efd60ec6c/image-58.jpg)
Add to Master Variables List ■ From Finance, 2004, from Frequently used financial indicators for all institutions: Fiscal year 2004, add ─ Core expenses, total dollar from Public institutions - GASB 34/35: Fiscal year 2004, add ─ Instruction - current year total
![Core expenses total dollar must be calculated for 2002 and 2003 According to ■ ‘Core expenses, total dollar’ must be calculated for 2002 and 2003. According to](https://slidetodoc.com/presentation_image_h2/93f2b39236fa06cdaf1b191efd60ec6c/image-59.jpg)
■ ‘Core expenses, total dollar’ must be calculated for 2002 and 2003. According to the info button for 2004, these are the components:
![From Finance 2002 and 2003 from Public institutions GASB 3435 Fiscal year ■ From Finance, 2002 and 2003, from Public institutions - GASB 34/35: Fiscal year](https://slidetodoc.com/presentation_image_h2/93f2b39236fa06cdaf1b191efd60ec6c/image-60.jpg)
■ From Finance, 2002 and 2003, from Public institutions - GASB 34/35: Fiscal year 2002 and 2003, from Expenses and other deductions, add current year totals for those 11 variables:
![Calculated Variables Create two summation variables Core Expenses 2003 Core Expenses Calculated Variables ■ Create two summation variables ─ Core Expenses 2003 ─ Core Expenses](https://slidetodoc.com/presentation_image_h2/93f2b39236fa06cdaf1b191efd60ec6c/image-61.jpg)
Calculated Variables ■ Create two summation variables ─ Core Expenses 2003 ─ Core Expenses 2002 using the 11 components for each year ■ Create a ratio variable ─ Instruction as a Percent of Core, 2004 • Instruction – current year total as numerator • Core Expenses for 2004 as denominator
![Recursive Calculated Variables Create two ratio variables Instruction as a Percent of Recursive Calculated Variables ■ Create two ratio variables: ─ Instruction as a Percent of](https://slidetodoc.com/presentation_image_h2/93f2b39236fa06cdaf1b191efd60ec6c/image-62.jpg)
Recursive Calculated Variables ■ Create two ratio variables: ─ Instruction as a Percent of Core, 2003 ─ Instruction as a Percent of Core, 2002 using the same technique Why would you create a recursive variable instead of doing the calculation in Excel? So you can save it in a Multiple Variables List for use in the future!
![Check to see if the columns are in chronological order and fix them if Check to see if the columns are in chronological order, and fix them if](https://slidetodoc.com/presentation_image_h2/93f2b39236fa06cdaf1b191efd60ec6c/image-63.jpg)
Check to see if the columns are in chronological order, and fix them if they aren’t.
![Create an Attractive Report Add a report title Adjust column widths and Create an Attractive Report ■ Add a report title ■ Adjust column widths and](https://slidetodoc.com/presentation_image_h2/93f2b39236fa06cdaf1b191efd60ec6c/image-64.jpg)
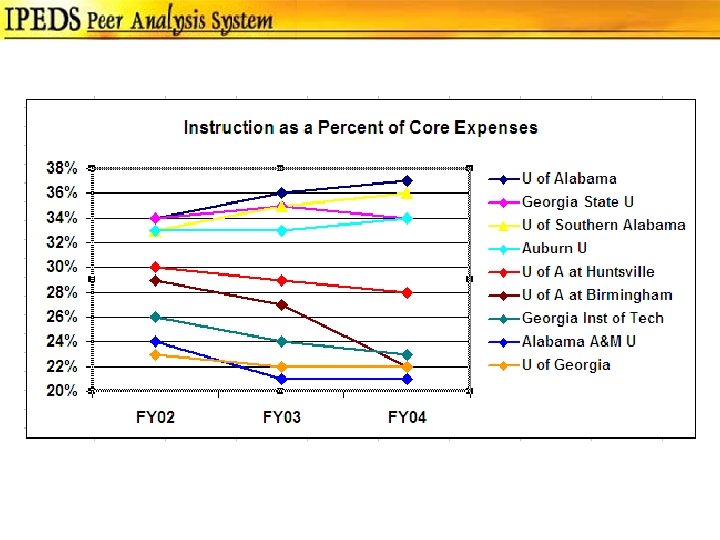
Create an Attractive Report ■ Add a report title ■ Adjust column widths and column titles ■ Order columns by year ■ Sort from high to low on ‘Instruction as a Percent of Core, 2002’ ■ Create a graph to illustrate changes over three years
![](https://slidetodoc.com/presentation_image_h2/93f2b39236fa06cdaf1b191efd60ec6c/image-65.jpg)
![](https://slidetodoc.com/presentation_image_h2/93f2b39236fa06cdaf1b191efd60ec6c/image-66.jpg)
![Research Questions How many schools offer doctorates in Exercise Science How many Research Questions ■ How many schools offer doctorates in Exercise Science? ■ How many](https://slidetodoc.com/presentation_image_h2/93f2b39236fa06cdaf1b191efd60ec6c/image-67.jpg)
Research Questions ■ How many schools offer doctorates in Exercise Science? ■ How many doctorates in Exercise Science do they award? The Enrollment survey does not collect data by program, but Completions contains degrees awarded. Look at degrees awarded over a three-year period because not all schools with the program may award degrees every year.
![Build Master Variables List From 2003 2004 2005 Completions Qualifying variables CIP Build Master Variables List From 2003, 2004, 2005 Completions: ■ Qualifying variables: ─ CIP](https://slidetodoc.com/presentation_image_h2/93f2b39236fa06cdaf1b191efd60ec6c/image-68.jpg)
Build Master Variables List From 2003, 2004, 2005 Completions: ■ Qualifying variables: ─ CIP Code: 31. 0505, Kinesiology and Exercise Science ─ Award Level: Doctor’s degree ─ First or Second major: First major ■ Variable: ─ Grand total
![Comparison Group Strategy Because Exercise Science is a relatively small degreeproducing program you want Comparison Group Strategy Because Exercise Science is a relatively small degree-producing program, you want](https://slidetodoc.com/presentation_image_h2/93f2b39236fa06cdaf1b191efd60ec6c/image-69.jpg)
Comparison Group Strategy Because Exercise Science is a relatively small degree-producing program, you want to include in your sample all schools that awarded doctorates during a three-year period. That is, you want all schools that awarded doctorate in 2002 -03 OR in 200304 OR in 2004 -05, not just those that awarded doctorates in all three years—or only in 2004 -05.
![Define Comparison Group From Master Variables List Select only Exercise Sci doctorates 2002 Define Comparison Group From Master Variables List: ■ Select only Exercise Sci doctorates, 2002](https://slidetodoc.com/presentation_image_h2/93f2b39236fa06cdaf1b191efd60ec6c/image-70.jpg)
Define Comparison Group From Master Variables List: ■ Select only Exercise Sci doctorates, 2002 -03 ─ Go to the query form; ─ Specify all schools with >0 degrees ─ 28 schools in comparison group ─ Accept and Continue ─ Add by Variable (from the Master Variables List)
![Select only Exercise Sci doctorates 2003 04 Go to the query form ■ Select only Exercise Sci doctorates, 2003 -04 ─ Go to the query form;](https://slidetodoc.com/presentation_image_h2/93f2b39236fa06cdaf1b191efd60ec6c/image-71.jpg)
■ Select only Exercise Sci doctorates, 2003 -04 ─ Go to the query form; ─ Specify all schools with >0 degrees ─ 28 schools in comparison group ─ Combine the two sets and eliminate duplicates ─ 31 schools in comparison group ─ Add by Variable (from the Master Variables List)
![Select only Exercise Sci doctorates 2004 05 Go to the query form ■ Select only Exercise Sci doctorates, 2004 -05 ─ Go to the query form;](https://slidetodoc.com/presentation_image_h2/93f2b39236fa06cdaf1b191efd60ec6c/image-72.jpg)
■ Select only Exercise Sci doctorates, 2004 -05 ─ Go to the query form; ─ Specify all schools with >0 degrees ─ 29 schools in comparison group ─ Combine the two sets and eliminate duplicates ─ 34 schools in comparison group ─ Examine the final list
![Your sample contains 34 schools that awarded one or more doctorates in Exercise Science Your sample contains 34 schools that awarded one or more doctorates in Exercise Science](https://slidetodoc.com/presentation_image_h2/93f2b39236fa06cdaf1b191efd60ec6c/image-73.jpg)
Your sample contains 34 schools that awarded one or more doctorates in Exercise Science during one or more of the three years.
![Run Institutions Data Report Select Reports and Stats Institutions Data Report From Run Institutions Data Report ■ Select Reports and Stats, Institutions Data Report ■ From](https://slidetodoc.com/presentation_image_h2/93f2b39236fa06cdaf1b191efd60ec6c/image-74.jpg)
Run Institutions Data Report ■ Select Reports and Stats, Institutions Data Report ■ From your Master Variables List, select all three years of Completions data ■ Specify long variable names ■ Download your results in csv format and save as an Excel file
![Your raw data file should look like this Note that some schools did not Your raw data file should look like this. Note that some schools did not](https://slidetodoc.com/presentation_image_h2/93f2b39236fa06cdaf1b191efd60ec6c/image-75.jpg)
Your raw data file should look like this. Note that some schools did not award doctorates each year.
![Create an Attractive Report Add a report title Adjust column widths and Create an Attractive Report ■ Add a report title ■ Adjust column widths and](https://slidetodoc.com/presentation_image_h2/93f2b39236fa06cdaf1b191efd60ec6c/image-76.jpg)
Create an Attractive Report ■ Add a report title ■ Adjust column widths and column titles ■ Create a column for 3 -year total ■ Sort from high to low on total degrees ■ Sum total degrees produced each year
![You can print these results and distribute them You can print these results and distribute them!](https://slidetodoc.com/presentation_image_h2/93f2b39236fa06cdaf1b191efd60ec6c/image-77.jpg)
You can print these results and distribute them!
![Questions Comments Feedback Questions? Comments? Feedback?](https://slidetodoc.com/presentation_image_h2/93f2b39236fa06cdaf1b191efd60ec6c/image-78.jpg)
Questions? Comments? Feedback?
Bitcoin: a peer-to-peer electronic cash system
Annotazioni sulla verifica effettuata peer to peer
Peer-to-peer
Tim beamer
Peer to peer transactional replication
Gambar topologi peer to peer
Esempio registro peer to peer compilato
Esempi di peer to peer compilati 2021
Relazione finale tutor tirocinio esempio
Peer to peer l
Peer to peer merupakan jenis jaringan… *
Features of peer to peer network and client server network
Programmazione e sviluppo condiviso compilato
Peer-to-peer communication in osi model
Peer p
Addresss look up
Peer-to-peer o que é
Peer to peer computing environment
Peer to peer intervention
Peer-to-peer o que é
Peer to peer network hardware
Peer to peer chat application in java
Skype reviews pros and cons
Jaringan peer to peer diistilahkan dengan
Examples of preposition of place
C device module module 1
Millions billions trillions chart
A repeating disturbance that transfers energy
A disturbance that transfers energy from place to place
Good morning children
Hình ảnh bộ gõ cơ thể búng tay
Frameset trong html5
Bổ thể
Tỉ lệ cơ thể trẻ em
Voi kéo gỗ như thế nào
Tư thế worm breton là gì
Chúa sống lại
Các môn thể thao bắt đầu bằng tiếng đua
Thế nào là hệ số cao nhất
Các châu lục và đại dương trên thế giới
Cong thức tính động năng
Trời xanh đây là của chúng ta thể thơ
Mật thư tọa độ 5x5
101012 bằng
Phản ứng thế ankan
Các châu lục và đại dương trên thế giới
Thơ thất ngôn tứ tuyệt đường luật
Quá trình desamine hóa có thể tạo ra
Một số thể thơ truyền thống
Cái miệng nó xinh thế chỉ nói điều hay thôi
Vẽ hình chiếu vuông góc của vật thể sau
Thế nào là sự mỏi cơ
đặc điểm cơ thể của người tối cổ
V cc
Vẽ hình chiếu đứng bằng cạnh của vật thể
Fecboak
Thẻ vin
đại từ thay thế
điện thế nghỉ
Tư thế ngồi viết
Diễn thế sinh thái là
Các loại đột biến cấu trúc nhiễm sắc thể
Bảng số nguyên tố lớn hơn 1000
Tư thế ngồi viết
Lời thề hippocrates
Thiếu nhi thế giới liên hoan
ưu thế lai là gì
Sự nuôi và dạy con của hổ
Sự nuôi và dạy con của hươu
Sơ đồ cơ thể người
Từ ngữ thể hiện lòng nhân hậu
Thế nào là mạng điện lắp đặt kiểu nổi
Advanced higher art understanding standards
Advanced topics in software analysis and testing
Memory forensics training
Centre for advanced spatial analysis
Advanced sensitivity analysis
Advanced algorithm design