Annexure 1 Performance Review Meeting Performance of the


 Director/")
 Director/")


 Number of")


 DGHGampa")
 Rate According to Staff")
 Rate")
 Rate According to Staff Category")
 Rate According to")
 Rate")


 Topic 1 st Qtr")
 Topic 1 st")
 Topic 1 st Qtr")
 Topic 1 st Qtr")
 Topic")


 Number")

")


file system Problems identified Difficulties in managing inward patients with")


 Half burning of clinical waste b) Visible dark black")


 ? Crowded medical clinic - created an appointment system with given time frame")


- Slides: 122
Annexure 1 Performance Review Meeting Performance of the Institution 2018 RDHS-Gampaha_________ Directorate of Healthcare Quality & Safety - Version 6 (Last updated on 30. 01. 2018)
Quality Management Unit Gampaha-RDHS area
Map of Gampaha district
Gampaha-RDHS-area • DGH-Gampaha • DGH-Negombo • BH-Wathupitiwala • BH-Mirigama • BH-Kiribathgoda • DH-Minuwangoda
Institutional Description-DGH-Gampaha v. Head of the Institution Designation Name Contact No Director/ Medical Superintendent (MS) Dr. Saman Pathirana 0718081374 Deputy Director Dr. Priyantha Illepuruma 0718456328 Email (Personal) ileperuma 2004@gmail. com v. Staff at QMU Designation Name Permanent / Temporary Contact No Email (Personal) MO-Q Dr. K. P. Udeni Dhammika Permanent 0718194024 uddhammika@gmail. com RHO-Quality A M L S Amarakoon Temporary 0714493543 amarakoonshirani@gmail. com v. Official Email address – • Hospital Email-dghgam@gmail. com • QMU Email -qualitydgh@gmail. com Display Only Directorate of Healthcare Quality & Safety - Version 6 (Last updated on 30. 01. 2018)
Institutional Description-DGH-Negombo v. Head of the Institution Designation Name Contact No Director/ Medical Superintendent (MS) Dr. (Mrs) Sujeewa Rathnayaka 0710783945 Email (Personal) Deputy Director v. Staff at QMU Designatio n Name MO-Q MO Dr. C. Kumara Permanent/ Temporary Contact No Email (Personal) Temporary 077 4461503 hmckumara 62@gmail. com DO v. Official Email address – • Hospital Email-dghgam@gmail. com • QMU Email -quality@gmail. com Display Only Directorate of Healthcare Quality & Safety - Version 6 (Last updated on 30. 01. 2018)
Institutional Description-BH-Wathupitiwala v. Head of the Institution Designation Name Contact No Director/ Medical Superintendent (MS) Dr Nalin Ariyarathne 0773350373 Deputy Director Dr. Dhammika Kumara 0704444200 Email (Personal) v. Staff at QMU Designation Name Permanent/ Temporary Contact No MO-Q Dr. Kelum Amarasinghe Permanent 0710362650 No-Q Ms. dhamika perera permanent 0716 -887112 v. Official Email address – • Hospital Email-msbwwp@yahoo. com • QMU Email Display Only Directorate of Healthcare Quality & Safety - Version 6 (Last updated on 30. 01. 2018) Email (Personal) pereradhamimika@gmail. com
Institutional Description-BH-Mirigama v. Head of the Institution Designation Name Contact No Email (Personal) Director/ Medical Superintendent (MS) Dr. Jayantha Abeyaratna 0332274261 bhmirigama@gmail. com Deputy Director v. Staff at QMU Designation Name Permanent/ Temporary Contact No Email (Personal) MO-Q Dr. chaminda Premaratna temporay 0332273261 chamindapremaratna@yahoo. c om Do-Planning Mrs. Buwaneka Mrs. Sonalika temporary 0332273261 v. Official Email address – • Hospital Email • QMU Email Directorate of Healthcare Quality & Safety - Version 6 (Last updated on 30. 01. 2018)
Institutional Description-BH-Kiribathgoda v. Head of the Institution Designation Name Contact No Email (Personal) Director/ Medical Superintendent (MS) Dr. K. T. H. N. A. PEERIS 0777356314 Deputy Director v. Staff at QMU Designation Name Permanent/ Temporary Contact No Email (Personal) MO-Q Dr. K. M. M perera Permanent 077 -2096632 kmaheshmperere@yahoo. com v. Official Email address – • Hospital Email bhkiribathgoda@yahoo. com • QMU Email -bhkiribathgoda@yahoo. com Display Only Directorate of Healthcare Quality & Safety - Version 6 (Last updated on 30. 01. 2018)
Institutional Descriptionv. Head of the Institution D. H. minuwangoda Designation Name Director/ Medical Superintendent (MS) Dr. Chandraguptha Ranasingha Contact No Email (Personal) 0712878558 chguptha@hotmail. com Deputy Director v. Staff at QMU Designation Name Permanent/ Temporary Contact No Email (Personal) Medical Officer Dr. W. M. N. Mahakumbur a Permanent 071 -8403667 niranjamahakumbura@yahoo. c om Nursing Officer M. N. Basnayaka Permanent 071 -8313382 nilupamabasnayaka@gmail. com v. Official Email address – • Hospital Email- bhminuwangoda@yahoo. com • QMU Email –qmuminuw@gmail. com Display Only Directorate of Healthcare Quality & Safety - Version 6 (Last updated on 30. 01. 2018)
Staff Training plan 2019 -B. H. kiri Directorate of Healthcare Quality & Safety - Version 7 (Last updated on 07. 11. 2018)
Directorate of Healthcare Quality & Safety - Version 6 (Last updated on 30. 01. 2018)
Categories of Staff-DGH-Gampaha Staff Category Approved Carder 1. Total number of Consultants (inclusive of Microbiologists and Surgeons) 2. Surgeons 3. Microbiologists 4. Total number of MO (including MO QMU/MO Public Health/MO Planning/MO Microbiology/ MO OPD) 5. MO QMU 6. MO Public Health 7. MO Planning 8. MO Microbiology 9. MO OPD 10. SGNO 11. Paramedical staff 12. NO(inclusive of Sister –In –Charge, infection control unit) 13. NO Infection Control Unit 14. Health Assistants Directorate of Healthcare Quality & Safety - Version 6 (Last updated on 30. 01. 2018) Display Only Number Available 29 29 02 01 247 25 04 60 407 224 1 1 1 01 25 04 60 392 221 1 194
Categories of Staff-BH-Wathupitiwala Staff Category Approved Carder 1. Total number of Consultants (inclusive of Microbiologists and Surgeons) 2. Surgeons 3. Microbiologists 4. Total number of MO (including MO QMU/MO Public Health/MO Planning/MO Microbiology/ MO OPD) 5. MO QMU 6. MO Public Health 7. MO Planning 8. MO Microbiology 9. MO OPD 10. SGNO 11. Paramedical staff 12. NO(inclusive of Sister –In –Charge, infection control unit) 13. NO Infection Control Unit 14. Health Assistants Directorate of Healthcare Quality & Safety - Version 6 (Last updated on 30. 01. 2018) Display Only Number Available 17 02 01 202 01 01 01 same m. o. 01 18 03 46 324 02 149
Categories of Staff-BH-Mirigama Staff Category Approved Carder 1. Total number of Consultants (inclusive of 06 Microbiologists and Surgeons) 2. Surgeons 01 3. Microbiologists 0 4. Total number of MO (including MO QMU/MO 35 Public Health/MO Planning/MO Microbiology/ MO OPD) 5. MO QMU 6. MO Public Health 7. MO Planning 8. MO Microbiology 0 9. MO OPD 10. SGNO 01 11. Paramedical staff 11 12. NO(inclusive of Sister –In –Charge, infection 53 control unit) 13. NO Infection Control Unit 01 14. Health Assistants 58 Display Only Directorate of Healthcare Quality & Safety - Version 6 Number Available 03 0 35 01 01 04 01 09 58 01 54
Categories of Staff-BH-Kiribathgoda Staff Category Approved Carder 1. Total number of Consultants (inclusive of 05 Microbiologists and Surgeons) 2. Surgeons 00 3. Microbiologists 00 4. Total number of MO (including MO QMU/MO 40 Public Health/MO Planning/MO Microbiology/ MO OPD) 5. MO QMU 01 6. MO Public Health 01 7. MO Planning 01 8. MO Microbiology 00 9. MO OPD 05 10. SGNO 01 11. Paramedical staff 20 12. NO(inclusive of Sister –In –Charge, infection control unit) 40 13. NO Infection Control Unit 01 14. Health Assistants Directorate of Healthcare Quality & Safety - 35 Version 6 (Last updated on 30. 01. 2018) Display Only Number Available 04 00 00 33 01 00 00 00 03 01 08 37 01 27
Categories of Staff-DGH-Negombo Staff Category Approved Carder 1. Total number of Consultants (inclusive of 30 Microbiologists and Surgeons) 2. Surgeons 02 3. Microbiologists 01 4. Total number of MO (including MO QMU/MO 240 Public Health/MO Planning/MO Microbiology/ MO OPD) 5. MO QMU 01 6. MO Public Health 01 7. MO Planning 01 8. MO Microbiology 02 9. MO OPD 18 10. SGNO 03 11. Paramedical staff 83 12. NO(inclusive of Sister –In –Charge, infection control unit) 399 13. NO Infection Control Unit 02 14. Health Assistants Directorate of Healthcare Quality & Safety - 210 Version 6 (Last updated on 30. 01. 2018) Display Only Number Available 30 02 01 225 01 01 01 03 24 03 59 355 02 181
Categories of Staff-D. H. Minu Staff Category 1. Total number of Consultants (inclusive of Microbiologists and Surgeons) 2. Surgeons 3. Microbiologists 4. Microbio. Total number of MO (including MO QMU/MO Public Health/MO Planning/MO logy/ MO OPD) 5. MO QMU 6. MO Public Health 7. MO Planning 8. MO Microbiology 9. MO OPD 10. SGNO 11. Paramedical staff 12. NO(inclusive of Sister –In –Charge, infection control unit) 13. NO Infection Control Unit 14. Health Assistants Directorate of Healthcare Quality & Safety – Version 6 (Last updated on 30. 01. 2018) Display Only Approved Carder Number Available - 03 26 26 - 01 12 75 01 50 10 01 69 01 37
Statistics – 2018 Indicator DGH-Gam DGHB. H. Wathu Negambo B. H. Meeri B. H. Kiri D. H. Minu Bed Strength 864 742 600 180 97 560 Number of Days in the Quarter 365 365 365 99353 79919 19237 22209 19297 Total Number of Admissions in the year 95978 In-patient Days for the Period 190142 124341 41981 32336 25113 Average Percentage of Bed Occupancy Rate 61. 07% 56. 77% 63. 89% 91. 45% 49% Average Length of Stay 2. 43 1. 76 2. 22 1. 6 2 Average Turnover 27. 3 117. 13 93. 66 55. 1 3 3 Have your Institution establish a process to identify readmissions yes Yes. (paed wd) No yes Yes No Readmission Rate* of Healthcare Quality & Safety - Version 6 *Readmission: an unplanned admission to. Directorate the same or different health (Last updated on 30. 01. 2018)
Statistics Related to OPD Performance Indicator Number of OPD Patients DGH-Gam DGHNegambo B. H. Wathu 306475 253022 B. H. Meeri B. H. Kiri 142576 261764 143702 D. H. Minuw angoda 155645 Number of MOs in the OPD 12 24 19 04 07 03 30 36. 5 101 71. 2 142 Number of Patients per Medical Officer in the OPD per Day 70. 85 Directorate of Healthcare Quality & Safety - Version 6 (Last updated on 30. 01. 2018)
Statistics Related to OPD Performance Average Waiting Time* of a Patient at the OPD -2018 Indicator Value (min) DGHGam(4 th quarter) Average Waiting time for Registration (a) Average Waiting time for Consultation (b) Average time for Consultation (c) Average waiting time OPD with Laboratory Investigations (a+b+c+d 1+e+d 2+f+g+h) B. H. Wathu B. H. Meeri B. H. Kiri D. H. Minu 25. 9 min 15 minut es 3 min 10 min 3 min 25 min 7. 4 min 05 minut es 33 min 11 min 14 min 5 min 03 minut es 03 min 4 min 03 min 15 mis to 1 hr 1. 5 hr 15 -20 minutes 24 min 80 minutes 2 hr 55 min Average time for Laboratory Investigations (e) Average waiting time for Pharmacy (g) DGHNegambo 25. 01 min 40 63 min Average waiting time OPD without minutes 63. 31 Laboratory Investigations Directorate of Healthcare Quality & Safety - Version 6 (Last updated on 30. 01. 2018) (a+b+c+f+g+h) 30 min 45 min 120 min Not data collected 30 min 20 min 170 min Not data collected 50 min 59 min
Statistics Related to Clinic Performance -2018 Type of Clinic Total number for the Year Medicine 6922 2 General Surgery 1362 0 Paediatric 5308 Obstetrics DGH DG BH BH H Wath Kiri Gam Neg u 8034 Gynecology 6365 Any other (Please Mention Waiting Time (min) BH Mee riga ma DH DGH Min Gam uwa ngod a 1031 9 5965 8 2824 5322 1 2 6635 9717 2174 9 NA NA 5244 3184 1383 1789 8506 5586 NA 331 NA 4070 4670 NA 597 NA 663 NA DGH Neg BH Wat hu ND ND ND BH Mee riga ma DH Minu wan goda ND ND ND ND ND ND Directorate of Healthcare Quality & Safety - Version 6 (Last updated on 30. 01. 2018) BH Kiri
Statistics Related to Clinic Performance -2018 Type of Clinic Total number for the Year DGH-Gam Orthopedic Cardiology DGH-Negom. B. H. Wathu B. H. Meeri BH-kiri. DH Minuwango da NA NA 2610 Recently started NA NA NA 14770 12373 ND NA 1057 NA 15594 9420 ND NA NA 372 17876 13561 ND NA ND 2865 9550 5586 ND ND 17876 2304 ND ND 36536 21352 ND 7855 6838 13288 ENT Skin Psychiatry Antenatal Baby clinics Dental Directorate of Healthcare Quality & Safety - Version 6 (Last 11034 updated on 30. 01. 2018) NA
Statistics Related to Clinic Performance-2018 Type of Clinic Family planing Total number for the Quarter DGHGam DGHB. H. Wath B. H. Me Negomb B. H. Kiri u er o Waiting Time (min) DH. Minuw DGHan Gam 1759 ND ND 349 39858 ND 36450 ND NA 400 6849 ND ND ND NA NA DH DGHB. H. Me B. H. W B. H. Kiri Minuw N eri an ND ND Eye OMF NA ND NA NA ND ND NA Child obesity ND ND NA NA Anesthesia ND ND 344 ND NA NA ND ND NA NA Diabetic clinic 5570 ND 2477 NA NA NA 45 mi n ND NA NA NA ND 47 NA NA NA ND ND NA NA NA/pl an to start NA ND ND ND 454 ND ND Nutrition NCD 3603 2321 ND Directorate of Healthcare Quality & Safety - Version 6 (Last updated on 30. 01. 2018) ND ND ND
Statistics Related to Surgical Performance –DGHGampaha 2018 Indicator Guide Major Surgeries 1) Number of Major Surgeries Performed 2) Number of Checklists* attached 3) Number of Checklists* completed Please state only if the check-lists (All 3 columns) are duly completed (can cross check through random checks by the QMU) Minor Surgeries 1) Number of Minor Surgeries Performed 2) Number of checklists* attached 3) Number of Checklists* completed Post-Surgical Infection Rate Please state only if the check-lists (All 3 columns) are duly completed (can cross check through random checks by the QMU) 1 st Q 2 nd Q 3 rd Q 4 th Q TOTAL 202 252 261 282 997 200 250 261 282 993 100 125 130 140 495 1897 2568 2314 2481 9260 300 350 400 1350 - - - Directorate of Healthcare Quality & Safety - Version 7 (Last updated on 07. 11. 2018)
Statistics Related to Surgical Performance – B. H. wathu 2018 Indicator Guide 1 st Q 2 nd Q 3 rd Q 4 th Q TOTAL Major Surgeries 1) Number of Major Surgeries Performed 594 486 525 568 2173 409 273 341 446 1469 00 212 216 121 549 1843 1996 1921 1968 7728 00 00 00 2) Number of Checklists* attached 3) Number of Checklists* completed Please state only if the check-lists (All 3 columns) are duly completed (can cross check through random checks by the QMU) Minor Surgeries 1) Number of Minor Surgeries Performed 2) Number of checklists* attached 3) Number of Checklists* completed Post-Surgical Infection Rate (Except LSCS) Please state only if the check-lists (All 3 columns) are duly completed (can cross check through random checks by the QMU)
Statistics Related to Surgical Performance Negombo-2018 Indicator Guide 1 st Q 2 nd Q 3 rd Q 4 th Q Major Surgeries 1) Number of Major Surgeries Performed 602 560 735 536 2433 Not Calculated Not calculated Not Calculated 2287 2286 1528 8586 Not Calculated Not Calculated Not Calculated 2) Number of Checklists* attached 3) Number of Checklists* completed Minor Surgeries 1) Number of Minor Surgeries Performed 2485 2) Number of checklists* attached 3) Number of Checklists* completed Post-Surgical Infection Rate (Except LSCS) Directorate of Healthcare Quality & Safety - Version 7 (Last updated on 07. 11. 2018) TOTAL
Statistics Related to Obstetric Performance -2018 Indicator Total Number of Deliveries Total Number of Normal Vaginal Deliveries (Including Instrumental Deliveries) Total Number of Caesarean Sections (LSCS) Caesarean Section (LSCS) Rate Post-Partum Infection Rate Number of Maternal Deaths Neonatal Mortality Rate (NMR) DGH B. H Gampah Negam Wathup a bo itiwala 4104 BH Meeri BH Kiri DH Minuw angoda 4087 4260 6 NA 11 2432 2723 6 NA 11 1655 1320 NA 40% 30. 98% NA 2644 1460 35. 525% 0. 095% 1 - Not Calculated calculated N/A NA Nil NA - - N/A 4. 438 3. 3 Directorate of Healthcare Quality & Safety - Version 6 (Last updated on 30. 01. 2018)
Post LSCS -Surgical Site Infection Rate-2018 Indicator Post Caesarean Surgical Site Infection Rate(TOTAL) DGHGampa 0. 82 DGHNegam 1. 057% BHWathu 0. 75% BHMeeri BH-Kiri DH Minuwan NA NA NA Post Caesarean Surgical Site Infection Rate(Elective) Post Caesarean Surgical Site Infection Rate (Emergency) 0. 29 1. 45% ND NA NA NA 0 0. 65% ND NA NA NA Directorate of Healthcare Quality & Safety - Version 6 (Last updated on 30. 01. 2018)
Statistics Related to Infection Control –DGHGam 2018 Hand Hygiene Compliance(HHC) Rate According to Staff Category Unit Medical Officers’ 1 st Q 2 nd Q Nursing Officers’ Minor Staff 3 rd Q 4 th Q 1 st Q 2 nd Q 3 rd Q 4 th Q ICU 51. 7% 55% 59. 7 51. 9 % % 54. 7 % 57. 8 % 61. 79 % 60. 93 % 40% 36. 3 % 40% 42. 1 % PBU 64. 8% 67. 3 % 65. 5 67. 8 % % 70. 5 % 77. 3 % 69. 4 % 77. 17 % 33. 3 % 50% 41. 6 % 46% Medical Ward 22. 2% 31. 6 % 19. 1 26. 2 % % 34. 3 % 37. 8 % 31. 7 % 40. 5 % 22. 2 % 27. 3 % 20% 22% Surgical Ward 20. 7% 27. 3 % 21. 7 24. 3 % 2% 26. 8 % 27. 2 % 29. 5 % 30. 4 % 11. 8 % 18. 1 % 19. 4 % Other wards(Materni ty) 42. 3% 43. 3 % 50% 46. 8 % 52. 5 % 83. 3 % 60. 4 % 6. 3% 16. 6 % 66. 7 % 58. 3 % Pediatrics 50% 58. 3 41. 2 % % 46. 8 % 52. 5 % 83. 3 % 60. 42 % 9. 3% 16. 6 % 16. 7 % 20% 53. 3 %
Statistics Related to Infection Control – B. H. wathu 2018 Hand Hygiene Compliance(HHC) Rate According to Staff Category Unit Medical Officers’ Nursing Officers’ 1 st Q 2 nd Q 61. 06 3 rd Q 4 th Q - - Medical Ward - Surgical Ward ICU PBU LR 89. 2 82. 3 Minor Staff 2 nd Q 3 rd Q 4 th Q 1 st Q 2 nd Q 3 rd Q 4 th Q 85. 48 - - - 15. 38 - - 51. 28 - - - - -- - - 92. 8 92. 7 67. 6 Guide : • To be done by the Ward Liaison Nurse Infection Control/ NO Infection Control Unit • Mention the unit and Healthcare Professional category where the audit carried out Total HHC for the unit= Total Correct Moments x 100% Total Observed Moments Directorate of Healthcare Quality & Safety - Version 6 (Last updated on 30. 01. 2018)
Statistics Related to Infection Control-Minuwan -2018 Hand Hygiene Compliance(HHC) Rate According to Staff Category Unit Medical Officers’ 1 st Q Nursing Officers’ Minor Staff 2 nd Q 3 rd Q 4 th Q 1 st Q 2 nd Q 3 rd Q 4 th Q ICU - - - PBU - - - Medical Ward - 20 22. 5 33. 3 40 46. 6 56. 6 30 32 41. 3 Surgical Ward - 10 12. 5 14 40 50 52. 2 20 22. 5 Other - 40 50 45 60 65 32 38 40 53. 3 Guide : • To be done by the Ward Liaison Nurse Infection Control/ NO Infection Control Unit • Mention the unit and Healthcare Professional category where the audit carried out Total HHC for the unit= Total Correct Moments x 100% Total Observed Moments Directorate of Healthcare Quality & Safety - Version 6 (Last updated on 30. 01. 2018) Refer the “Guideline Hand Hygiene Compliance – Introduction of Hand Hygiene Tools”
Statistics Related to Infection Control –DGH Negombo 2018 Hand Hygiene Compliance(HHC) Rate According to Staff Category Unit Medical Officers’ 1 st Q Nursing Officers’ Minor Staff 2 nd Q 3 rd Q 4 th Q 1 st Q 2 nd Q 3 rd Q 4 th Q ICU 55% 59. 8 % 68. 7 72% % 73% 79. 4 % 74% 78% 40% 49% 41% 45% PBU 58% 67. 8 3% 70% 68% 80. 2 % 88. 8 % 86% 89% 48% 47. 5 % 50% 56% Medical Ward 53. 5% 58. 2 % 64% 57% 68% 72% 70% 72% 41. 7 % 39% 45% Surgical Ward 52. 4% 61% 60% 64% 70. 43 % 76. 25 % 74% 77% 37. 3 % 42. 2 % 47% 49% Other 50% 59% 50% 64% 63. 7 % 59% 60% 43% 44. 25 % 50% 58% 54. 8 % Guide : • To be done by the Ward Liaison Nurse Infection Control/ NO Infection Control Unit Directorate of Healthcare Quality & Safety - Version 7 • Mention the unit and Healthcare Professional category where the audit carried out (Last updated on 07. 11. 2018)
Statistics Related to Infection Control – B. H. Kiri 2018 Hand Hygiene Compliance(HHC) Rate According to Staff Category Unit Medical Officers’ 1 st Q 2 nd Q 3 rd Q 4 th Q Nursing Officers’ Minor Staff 1 st Q 2 nd Q 3 rd Q 4 th Q ICU PBU Medical Ward Surgical Wards/A & E 90% 98% 95% 80% Guide : • To be done by the Ward Liaison Nurse Infection Control/ NO Infection Control Unit • Mention the unit and Healthcare Professional category where the audit carried out Total HHC for the unit= Total Correct Moments x 100% Total Observed Moments Directorate of Healthcare Quality & Safety - Version 7 (Last updated on 07. 11. 2018) Refer the “Guideline Hand Hygiene Compliance – Introduction of Hand Hygiene Tools” 70%
Statistics Related to Infection Control -2018 Hospital Acquired Infection Rate-2018 Indicator Staphylococcus aureus Bacteraemia Rate per 10, 000 patient days MRSA Bacteraemia Rate per 10, 000 patient days Hospital onset MRSA Bacteraemia Rate per 10, 000 patient days Proportion of MRSA: Staphylococcus aureus in blood cultures(expressed as percentage) DGH Gam DGH Negambo BH Wathu BH Meeri BH Kiri DH Minu 0. 25(4 th) 2. 49 ND NA NA 0. 25 1. 44 ND NA NA - ND NA NA 58% ND NA NA 0. 207 NA NA 1: 1 Refer next slide for calculations Directorate of Healthcare Quality & Safety - Version 6 (Last updated on 30. 01. 2018)
DGB Gam Indicator DGH Negam BH Wathu BH Meeri BH Kiri Guideline to monitor Antibiotic Resistance yes NO NO No NO permanent Consultant Microbiologist Yes NO NO NO - - Yes No No cover-up from a Consultant Microbiologist? YES/NO Mechanism to monitor antibiotic resistance Directorate of Healthcare Quality & Safety - Version 6 (Last updated on 30. 01. 2018) DH Minu
Statistics Related to Adverse Events -2018 Category of Adverse Event*** Total number of reported Events DGH-G • Fall/ Safety issues 47 • Treatment/ Diagnosis issues DGH-N BH-W BH-M 62 23 02 NA - NA BH-K DH minu 01 NA NA 02 NA NA - NA NA NA • Labour /Delivery issues NA - NA NA NA • Miscellaneous issues NA 05 NA NA 01 NA • Drugs/ IV / Blood issues 75 • Surgery/ Anaesthesia issues • Laboratory reports • Other 01 07 • Postponement of surgical records 01 Guide : Please breakdown Adverse Events under above categories. Refer the “Guideline for Adverse Event/Incident Reporting” and “Adverse Event/Incident Reporting Form (Health 1259)” Directorate of Healthcare & Safety -to Version 6 ***An Adverse Event is defined as an injury. Quality related medical management (Last updated on 30. 01. 2018) in contrast to complications of disease. Medical management includes all
Progress of Quality Management Units -2018 Area of Concern DGH Gam Availability of a Focal Point for Healthcare Quality and Safety Programme Yes Availability of a Steering Committee for QMU Yes Number of Steering Committee Meetings conducted in your Institution during the Quarter DGH Neg Yes BH Wathu BH Meer i BH Kiri DH Minu YES yes yes yes 01 01 01 03 01 Work Improvement Team (WIT) No of Wards and Units 20 26 10 15 22 No of Established WITs 20 22 10 04 15 No of WITs functioning 01 22 07 03 8 Criteria to be fulfill for a functioning WIT • To meet monthly • Number of participation should be >50% of total number in the ward Eg; Total no. of staff in the ward=20, Number of staff participated for the WIT meeting=15 Participation as a percentage= 15/20 x 100% = 75% • Minutes should be recorded of Healthcare Quality & Safety - Version 6 • At least one matter should be discussed and. Directorate implemented per month (Last updated on 30. 01. 2018)
S/N Institutional Meeting Structure-DGH-Gam - 2018 Type of Meeting Date (Mention the date in relevant cage (DD/MM) Jan 1 2 3 4 5 6 Feb Mar April Hospital Management Committee (HMC) May June July 5/25 6/21 20/07 Aug Sep Oct Quality & Safety Steering Committee (QSSC) 15/0 2 30/0 5 19/9 Drug & Therapeutic Committee (DTC) Nursing Dec 28/11 Infection Prevention & Control Committee (IPCC) Hospital Committee Nov 15/11 26/09 26/1 23/3 27/4 25/5 22/6 20/7 Directorate of Healthcare Quality & Safety - Version 7 (Last updated on 07. 11. 2018) 17/8 14/9 19/10 16/11 21/1 2
S/N Institutional Meeting Structure -Wathu 2018 Type of Meeting Date (Mention the date in relevant cage (DD/MM) Jan Feb Mar April May 05 th June July Aug Sep Oct Nov Dec 02 nd - - - 1 Hospital Management Committee (HMC) 2 Quality & Safety Steering Committee (QSSC) - - 14 th - - - - 3 Infection Prevention & Control Committee (IPCC) 03 rd 03 rd 03 rd 4 Drug & Therapeutic Committee (DTC) 23 rd - - - 30 th - - - 06 th - - - 5 Please Specify 6 Please Specify Directorate of Healthcare Quality & Safety - Version 6 (Last updated on 30. 01. 2018)
Institutional Meeting Structure -Kiri- 2018 S/N Type of Meeting Date (Mention the date in relevant cage (DD/MM) Jan Feb Mar April May June July Aug Sep Oct Nov Dec 1 Hospital Management Committee (HMC) 26/1/ 2018 23 23 27 25 22 27 24 28 26 23 21 2 Quality & Safety Steering Committee (QSSC) 16 no no 10 no no 17 no 16 no 13 no 3 Infection Prevention & Control Committee (IPCC) 9 no no no 8 no no no 10 4 Drug & Therapeutic Committee (DTC) 5 Please Specify 6 4 Directorate of Healthcare Quality & Safety - Version 7 (Last updated on 07. 11. 2018)
S/N Institutional Meeting Structure –DGH Negom 2018 Type of Meeting Date (Mention the date in relevant cage (DD/MM) Jan 1 Hospital Management Committee (HMC) 2 Quality & Safety Steering Committee (QSSC) 3 Infection Prevention & Control Committee (IPCC) 4 Drug & Therapeutic Committee (DTC) 5 Please Specify 6 Please Specify Feb Mar April May June July Directorate of Healthcare Quality & Safety - Version 7 (Last updated on 07. 11. 2018) Aug Sep Oct Nov Dec 01 01 01
Statistics Related to Clinical Audits -2018 DGH G Indicator Number of Clinical audits* conducted. Total number for the Year DGH BH BH N W M HH ND BH K HH Mention the Top 05 Clinical Audits (Topics in brief) conducted in year 2018 1 Perinatal death audit 2 Hand hygiene audit 3 Dengue death audit 4 Maternal death audit 5 Guide : • At least one audit per quarter • Please mention -what type of audit carried out *Clinical audit is a quality improvement process that seeks to improve patient care and outcomes through systematic review of care against explicit criteria and the implementation of change. Directorate of Healthcare Quality & Safety - Version 6 (Last updated on 30. 01. 2018) DH Minu
Statistics Related to Death Reviews – 2017 Indicator Total number for the Quarter DGH-G DGH-N BH-W Deaths per year BH-M BH-K 07 Death Reviews 1) Maternal Death Reviews 1 01 00 NA 2) Perinatal Death Reviews 12 09 00 NA - 00 NA 3) Dengue Death Reviews 4) Any Other (Please mention the name of Death Review TOTAL 13 Directorate of Healthcare Quality & Safety - Version 6 (Last updated on 30. 01. 2018) 10 00
Progress of Selected Standards and Indicators in accordance with the Circular No: 02122/2013 Please fill in the excel form attached Indicator Comment Please use the softcopy of the excel sheet provided True findings -Circular M&E All 20 indicators will be assessed. 1. Provision of Safe Water 2. Notification of communicable diseases 3. Sanitation (General) 4. Sanitation (Specific) 5. Maternal Care 6. Examination of in-patients by a House Officer / Senior House Officer 7. Efficiency of sterilization of instruments 8. Diet Services 9. Nursing care 10. Disaster preparedness 11. Patient safety 12. Patients’ waiting time in OPD 13. Monitoring quality improvement programme (Quality of Care) 14. Community participation in Hospital management 15. In-service training 16. Intensive Care 17. Neonatal Care 18. Operating Theatre Services 19. Responsiveness to specialized groups Directorate of Healthcare Quality & Safety - Version 6 20. Standardized visuals (Last updated on 30. 01. 2018)
Quality Programme Dash Board-Minuwan Plan for year 2018 –(HSDP indicators) Topic 1 st Qtr 1. Training of Staff 2 Functioning of WITS 3 Conducting Customer Satisfaction Survey 2 nd Qtr 100% Completed ≥ 50% Completed ≥ 25% Completed Started Not Started Guide : Please refer next slide for explanation Directorate of Healthcare Quality & Safety - Version 6 (Last updated on 30. 01. 2018) 3 rd Qtr 4 th Qtr Remarks
Quality Programme Dash Board-DGH Nego Plan for year 2018 –(HSDP indicators) Topic 1 st Qtr 1. Training of Staff 2 Functioning of WITS 3 Conducting Customer Satisfaction Survey 2 nd Qtr 100% Completed ≥ 50% Completed ≥ 25% Completed Started Not Started Guide : Please refer next slide for explanation Directorate of Healthcare Quality & Safety - Version 7 (Last updated on 07. 11. 2018) 3 rd Qtr 4 th Qtr Remarks
Quality Programme Dash Board-Gam Plan for year 2018 –(HSDP indicators) Topic 1 st Qtr 2 nd Qtr 3 rd Qtr 4 th Qtr 1. Training of Staff 50% 2 Functioning of WITS 50% 3 Conducting Customer Satisfaction Survey - - 100% Completed ≥ 50% Completed ≥ 25% Completed Started Not Started Guide : Please refer next slide for explanation Directorate of Healthcare Quality & Safety - Version 7 (Last updated on 07. 11. 2018) Remarks
Quality Programme Dash Board-Wathu Plan for year 2018 –(HSDP indicators) Topic 1 st Qtr 1. Training of Staff 2 Functioning of WITS 3 Conducting Customer Satisfaction Survey 2 nd Qtr 100% Completed ≥ 50% Completed ≥ 25% Completed Started Not Started Guide : Please refer next slide for explanation Directorate of Healthcare Quality & Safety - Version 6 (Last updated on 30. 01. 2018) 3 rd Qtr 4 th Qtr Remarks
Quality Programme Dash Board. B. H. Meerigama Plan for year 2018 –(HSDP indicators) Topic 1 Qtr 2 Qtr 3 st 1. Training of Staff 2 Functioning of WITS 3 Conducting Customer Satisfaction Survey nd 100% Completed ≥ 50% Completed ≥ 25% Completed Started Not Started Guide : Please refer next slide for explanation Directorate of Healthcare Quality & Safety - Version 6 (Last updated on 30. 01. 2018) rd Qtr 4 th Qtr Remarks
Progress of Quality Management Units. B. H. wathu Area of Concern Patient Satisfaction Surveys 1) Number of Patient Satisfaction Surveys Conducted in the Quarter (at least two Patient Satisfaction Surveys should be conducted per year) Guide 1 st Q 2 nd Q 3 rd Q 4 th Q TOTAL - OPD Wd 15 - - 02 03 02 04 01 Number Mention the selected patient group Eg; Clinic patients/ OPD patients 2) Key findings and actions taken for key findings Employee Satisfaction Surveys Number 1) Number of Employee Satisfaction Mention the selected Surveys Conducted in the quarter employee group (at least one Employee Satisfaction Survey should be conducted per year) 2) Key findings and actions taken for key findings In-service Training Programmes Number 03 Nurses Training Number of In-service Training Programmes Conducted (At least 4 inservice training programme/year (01 per HA Training quarter): Related to Quality and Safety in Directorate of Healthcare Quality & Safety - Version 6 Healthcare should be conducted for (Last updated on 30. 01. 2018)
Progress of Quality Management Units. B. H. kiribathgoda Area of Concern Patient Satisfaction Surveys 1) Number of Patient Satisfaction Surveys Conducted in the Quarter (at least two Patient Satisfaction Surveys should be conducted per year) Guide 1 st Q 2 nd Q 3 rd Q 4 th Q TOTAL Number 1 1 Mention the selected patient group Eg; Clinic patients/ OPD patients opd Medic al clinic 2) Key findings and actions taken for key findings Employee Satisfaction Surveys Number 1 1) Number of Employee Satisfaction Mention the selected all Surveys Conducted in the quarter employee group (at least one Employee Satisfaction Survey should be conducted per year) 2) Key findings and actions taken for Unawareness of the increment date. Inform increment dates by Sm. S key findings In-service Training Programmes 1 1 Number of In-service Training Programmes Conducted (At least 4 inservice training programme/year (01 per Please Name the training TQM resp programmes quarter): Related to Quality and Safety in onsiv Directorate of Healthcare Quality & Safety - Version 7 Healthcare should be conducted for (Last updated on 07. 11. 2018) enes 02 01 02
Progress of Quality Management Units. Meerigama Area of Concern Patient Satisfaction Surveys 1) Number of Patient Satisfaction Surveys Conducted in the Quarter (at least two Patient Satisfaction Surveys should be conducted per year) Guide Number 1 st Q 2 nd Q 3 rd Q 0 0 0 Mention the selected patient group Eg; Clinic patients/ OPD patients 2) Key findings and actions taken for key findings Employee Satisfaction Surveys Number 0 1) Number of Employee Satisfaction Mention the selected Surveys Conducted in the quarter employee group (at least one Employee Satisfaction Survey should be conducted per year) 2) Key findings and actions taken for key findings In-service Training Programmes 01 Number of In-service Training Programmes Conducted (At least 4 inservice training programme/year (01 per Please Name the training 5 s programmes quarter): Related to Quality and Safety in Directorate of Healthcare Quality & Safety - Version 6 Healthcare should be conducted for (Last updated on 30. 01. 2018) 4 th Q 01 OPD 1 0 Minor staff 01 NURSES 02 01 02 1)Qualiy tools Kaizen 1)Dimensio ns of quality 2)wits TOT AL
Progress of Quality Management Unitsminu 2 nd Q 3 rd Q 4 th Q TOTAL Number 1 1 1 Mention the selected patient group Eg; Clinic patients/ OPD patients opd opd 1 1 1 all all - - 1 Area of Concern Patient Satisfaction Surveys 1) Number of Patient Satisfaction Surveys Conducted in the Quarter (at least two Patient Satisfaction Surveys should be conducted per year) Guide 1 st Q 2) Key findings and actions taken for key findings Employee Satisfaction Surveys Number 1) Number of Employee Satisfaction Mention the selected Surveys Conducted in the quarter employee group (at least one Employee Satisfaction Survey should be conducted per year) 2) Key findings and actions taken for key findings In-service Training Programmes Number of In-service Training Programmes Conducted (At least 4 inservice training programme/year (01 per Please Name the training quarter): Related to Quality and Safety in programmes Directorate of Healthcare Quality & Safety - Version 6 Healthcare should be conducted for (Last updated on 30. 01. 2018) Pt safte y 03 03 1
Progress of Quality Management Units. DGH Negam Area of Concern Patient Satisfaction Surveys 1) Number of Patient Satisfaction Surveys Conducted in the Quarter (at least two Patient Satisfaction Surveys should be conducted per year) 2) Key findings and actions taken for key findings Employee Satisfaction Surveys 1) Number of Employee Satisfaction Surveys Conducted in the quarter (at least one Employee Satisfaction Survey should be conducted per year) 2) Key findings and actions taken for key findings In-service Training Programmes Number of In-service Training Programmes Conducted (At least 4 in -service training programme/year (01 per quarter): Related to Quality and Safety in Healthcare should be Guide Number 1 st Q 2 nd Q 3 rd Q 4 th Q 00 00 02 02 Mention the selected patient group Eg; Clinic patients/ OPD patients Number Mention the selected employee group Number Please Name the training programmes Motiva tion, Quality Directorate of Healthcare Quality & Safety - Version 7 & (Last updated on 07. 11. 2018) Safety, Stress Manage ment Minor Staff TOTA L
Cont…. Clinical Indicators of Surgery-DGH Gam Indicator Commenced YES/NO Value for the Quarter 1 st Q 2 nd Q 3 rd Q 4 th Q TOTAL 3. Percentage of Surgical facilities using the ‘Surgical Safety Checklist’ 20. 999 % 22. 56% 19. 8% 19. 7% 20. 7% days 4. Rate of Surgical Site 0. 49% 0. 76% 2. 48% 1. 20% v Appendicitis 2 days 2 days v Inguinal hernia 1 day 1 day Issues during implementation Sepsis 5. Average hospital stay after an index operation( ex: Appendicitis, inguinal hernia, amputation for diabetic gangrene) v Amputation for diabetic gangrene DEPENDING ON THE WOUND Directorate of Healthcare Quality & Safety - Version 7 (Last updated on 07. 11. 2018)
Statistics related to Clinical Indicators –DGHGam 2018 3. Clinical Indicators of Paediatrics Indicator Commenced YES/NO Value for the Quarter 1 st Q 2 nd Q 3 rd Q 1. Hypothermia on 1 2. Re-admission to the 1 4 th Q TOTAL 1 admission to Neonatal Unit when transferring from one institution to another (Outside born baby) or from the maternity unit to the neonatal unit in the same hospital (In born baby). 3 ward with wheezing who had bronchiolitis under one year of age. Directorate of Healthcare Quality & Safety - Version 7 (Last updated on 07. 11. 2018) 04 Issues during implementation
Cont…. . Clinical Indicators of Paediatrics-DGHGam Indicator Commenced YES/NO Value for the Quarter 1 st Q 2 nd Q 3 rd Q 4 th Q TOTAL 4. Hypoglycemia on 6 6 6 11 29 5. Case fatality rate in - - 3. Readmission rate within 14 days following discharge from a Paediatric ward. Admission to the Neonatal Unit when transferring from one institution to another (Outside born baby) or from the maternity unit to the neonatal unit in the same hospital (In born baby) Dengue Hemorrhagic Fever Directorate of Healthcare Quality & Safety - Version 7 (Last updated on 07. 11. 2018) Issues during implementation
Statistics related to Clinical Indicators –DGHGam 2018 Q 3 Q 4 4. Clinical Indicators of Obstetrics & Gynaecology Indicator 1. Labour Induction Rate 2. Episiotomy rate 3. Caesarian section rate Commenced YES/NO Value for the Quarter 1 st Q 2 nd Q 3 rd Q 4 th Q Yes 54. 5% 53. 1% 45. 33 % 38. 86 % Yes 55. 4% 54% 90% 85% Yes 41. 9% 42. 1% 43. 67 % 43. 73 % 222 251 4. Proper use of Partogram 5. Average waiting time - - for routine major Gynaecological surgery Directorate of Healthcare Quality & Safety - Version 7 (Last updated on 07. 11. 2018) TOTAL Issues during implementation
Statistics related to Clinical Indicators -2018 Wathu 1. Clinical Indicators of Medicine Indicator 1. Percentage of patients given a fibrinolytic in • <30 minutes of arrival in ST Elevation Myocardial Infarction(STEMI) or • Commenced YES/NO Value for the Quarter 1 st Q 2 nd Q 3 rd Q 4 th Q TOTAL YES 00/11 00 1/29 3. 4% 00/30 00 01/33 3. 03% 02/144 1. 39% undergoing primary NO Percutaneous Coronary Intervention(PCI) in <90 minutes of arrival to hospital Directorate of Healthcare Quality & Safety - Version 6 (Last updated on 30. 01. 2018) Issues during implementation
Cont…. . Clinical Indicators of Medicine-BH wathu Indicator 2. Percentage of patients with diabetes who are attending to Medical clinics, • having FBS measured at least once in two months controlled to target FBS < 126 mg/dl • Hb. A 1 C measured at least once in 6 months and controlled to target Hb. A 1 C < 7 3. Percentage of patients with BP controlled to target < 140/90 mm. Hg in the patients with cardiovascular risks. Commenced YES/NO Value for the Quarter 1 st Q 2 nd Q 3 rd Q 4 th Q TOTAL YES 51. 5% 62% 62% 56. 7% 93% 84% 85. 7% 88. 9% NO YES Directorate of Healthcare Quality & Safety - Version 6 (Last updated on 30. 01. 2018) Issues during implementation
Statistics related to Clinical Indicators –B. H. wathu -2018 2. Clinical Indicators of Surgery Indicator 1. Rate of Postponement of Elective Surgery 2. Waiting time duration in indexed operations. Divided into cancer and noncancer Commence d YES/NO Value for the Quarter 1 st Q 2 nd Q 3 rd Q 4 th Q TOTAL YES 46/592 33/465 76/993 57/931 212/2981 7. 77% 6. 17% 7. 65% 6. 12% 7. 11% NO v Cancer NO v Non Cancer Directorate of Healthcare Quality & Safety - Version 6 (Last updated on 30. 01. 2018) Issues during implementatio n
Cont…. Clinical Indicators of Surgery-B. H. wathu Indicator Commenced YES/NO Value for the Quarter 1 st Q 2 nd Q 3 rd Q 4 th Q TOTAL 3. Percentage of Surgical facilities using the ‘Surgical Safety Checklist’ YES 00 43. 75% 41. 18% 21. 43% 21. 05 % 4. Rate of Surgical Site 0. 52% 0. 9% 1. 67% 0. 61% 0. 88% Sepsis Partially started 5. Average hospital stay NO after an index operation( ex: Appendicitis, inguinal hernia, amputation for diabetic gangrene) v Appendicitis v Inguinal hernia v Amputation for diabetic gangrene Directorate of Healthcare Quality & Safety - Version 6 (Last updated on 30. 01. 2018) Issues during implementation
Cont…. . Clinical Indicators of Paediatrics. B. H. Wathu Indicator Commenced YES/NO 3. Readmission rate within NO 4. Hypoglycemia on YES 5. Case fatality rate in No Pae. deaths Value for the Quarter 1 st Q 2 nd Q 3 rd Q TOTAL Just started 14 days following discharge from a Paediatric ward. 3. 89% 4. 00% 5. 23% Admission to the Neonatal Unit when transferring from one institution to another (Outside born baby) or from the maternity unit to the neonatal unit in the same hospital (In born baby) Dengue Hemorrhagic Fever 4 th Q Directorate of Healthcare Quality & Safety - Version 6 (Last updated on 30. 01. 2018) 2. 17% 3. 75% Issues during implementation
Statistics related to Clinical Indicators – B. H. Wathu-2018 4. Clinical Indicators of Obstetrics & Gynaecology Indicator Commenced YES/NO Value for the Quarter 1 st Q 2 nd Q 3 rd Q 4 th Q TOTAL 1. Labour Induction Rate NO 2. Episiotomy rate yes 88% 88. 6% 90. 2% 93. 4% 90. 05% 3. Caesarian section rate YES 34. 72% 31. 3% 29. 2% 29% 30. 5% 4. Proper use of YES 90% 95% 92% 90. 4% 91. 75% 5. Average waiting time NO Partogram for routine major Gynaecological surgery Directorate of Healthcare Quality & Safety - Version 6 (Last updated on 30. 01. 2018) Issues during implementation
Statistics related to Clinical Indicators –DGH Gam 2018 3. Clinical Indicators of Paediatrics Indicator Commenced YES/NO Value for the Quarter 1 st Q 2 nd Q 3 rd Q 1. Hypothermia on 1 2. Re-admission to the 1 4 th Q TOTAL 1 admission to Neonatal Unit when transferring from one institution to another (Outside born baby) or from the maternity unit to the neonatal unit in the same hospital (In born baby). 3 ward with wheezing who had bronchiolitis under one year of age. Directorate of Healthcare Quality & Safety - Version 7 (Last updated on 07. 11. 2018) 04 Issues during implementation
Cont…. . Clinical Indicators of Paediatrics-DGH Gam Indicator Commenced YES/NO Value for the Quarter 1 st Q 2 nd Q 3 rd Q 4 th Q TOTAL 4. Hypoglycemia on 6 6 6 11 29 5. Case fatality rate in - - 3. Readmission rate within 14 days following discharge from a Paediatric ward. Admission to the Neonatal Unit when transferring from one institution to another (Outside born baby) or from the maternity unit to the neonatal unit in the same hospital (In born baby) Dengue Hemorrhagic Fever Directorate of Healthcare Quality & Safety - Version 7 (Last updated on 07. 11. 2018) Issues during implementation
Statistics related to Clinical Indicators –DGH Gam 2018 Q 3 Q 4 4. Clinical Indicators of Obstetrics & Gynaecology Indicator 1. Labour Induction Rate 2. Episiotomy rate 3. Caesarian section rate Commenced YES/NO Value for the Quarter 1 st Q 2 nd Q 3 rd Q 4 th Q Yes 54. 5% 53. 1% 45. 33 % 38. 86 % Yes 55. 4% 54% 90% 85% Yes 41. 9% 42. 1% 43. 67 % 43. 73 % 222 251 4. Proper use of Partogram 5. Average waiting time - - for routine major Gynaecological surgery Directorate of Healthcare Quality & Safety - Version 7 (Last updated on 07. 11. 2018) TOTAL Issues during implementation
Statistics related to Clinical Indicators-Meerigama -2018 1. Clinical Indicators of Medicine Indicator 1. Percentage of patients given a fibrinolytic in • <30 minutes of arrival in ST Elevation Myocardial Infarction(STEMI) or • Commenced YES/NO yes undergoing primary no Percutaneous Coronary Intervention(PCI) in <90 minutes of arrival to hospital Value for the Quarter 1 st Q 2 nd Q 3 rd Q 4 th Q 60% 70% 0 0 0 Directorate of Healthcare Quality & Safety - Version 6 (Last updated on 30. 01. 2018) TOTAL Issues during implementation
Cont…. . Clinical Indicators of Medicine-B. H. Meer Indicator 2. Percentage of patients with diabetes who are attending to Medical clinics, • having FBS measured at least once in two months controlled to target FBS < 126 mg/dl • Hb. A 1 C measured at least once in 6 months and controlled to target Hb. A 1 C < 7 3. Percentage of patients with BP controlled to target < 140/90 mm. Hg in the patients with cardiovascular risks. Commenced YES/NO Value for the Quarter 1 st Q 2 nd Q 3 rd Q 4 th Q yes 60% 65% yes 60% 70% yes 75% 75% Directorate of Healthcare Quality & Safety - Version 6 (Last updated on 30. 01. 2018) TOTAL Issues during implementation
Cont…. Clinical Indicators of Medicine-B. H. Meeri Indicator Commenced YES/NO Value for the Quarter 1 st Q 2 nd Q 3 rd Q 4 th Q 20% 25% 4. Percentage of errors no in administration of prescribed medication to the right patient at any stage of medication process (i. e. , prescribing, transcribing, dispensing, administration and monitoring) yes 5. Percentage of patients with a physician diagnosis of asthma who receive out -patient/ETU/PCU nebulisations Directorate of Healthcare Quality & Safety - Version 6 (Last updated on 30. 01. 2018) TOTAL Issues during implementation
Kaizen Improvement D. G. H. Gampaha Directorate of Healthcare Quality & Safety - Version 6 (Last updated on 30. 01. 2018)
PROCESS IMPROVEMENTS IN YEAR 2018 1. A & E DEPARTMENT Problems identified Increased waiting time Complaints from patients Activity Send the patients into 3 categories after triage RED -severely ill YELLOW -moderately ill GREEN-mildly ill/looks good
2. Maternity ward (WD 10)file system Problems identified Difficulties in managing inward patients with different co morbidities during pregnancy Activity Colour code system for patient s files
3. Cardiology clinic Problems identified As there was no appointment system, increased patient waiting time, overcrowding and inconvenience to both patient and the staff Activity Introduced colour code system and appointment number for patient appointment books. 7 am-green 9 am-blue 11 am-yellow
4. Hospital acquired infection Surveillance process Microbiology unit Problems identified Difficulty in identifying and getting data regarding hospital acquired infections. Activity Different colour forms for different hospital acquired HAP surveillance form – pink colour form Catheter Associate UTI surveillance form-green colour form SSI surveillance form –orange colour form CVC surveillance form –yellow colour form VAP surveillance form –blue colour form
5. Incinerator Problems identified a) Half burning of clinical waste b) Visible dark black smoke c) Increased ash generation d) Bad smell unhealth y Measurements taken -Situational analysis -Cause identification 1. Poor clinical waste segregation non clinical waste coming to incinerator 2. Poor temperature Half maintenance of incinerator burning 3. Poor fuel management
Activity 1. 2. 3. 4. Proper supervision of fuel mismanagement Changing the staff Training the staff Proper regular service & maintenance activities under supervision 5. Continuous auditing of fuel with documentation Tem: runs to 1300 C which prevents emission of toxic gases and carbon Minimize ash generation Minimize public complaints
Directorate of Healthcare Quality & Safety - Version 7 (Last updated on 07. 11. 2018)
PROCESS IMPROVEMENTS RECORDS/DOCUMENTS PREPERATION 1. Hospital telephone index
2. Hospital clinic schedule
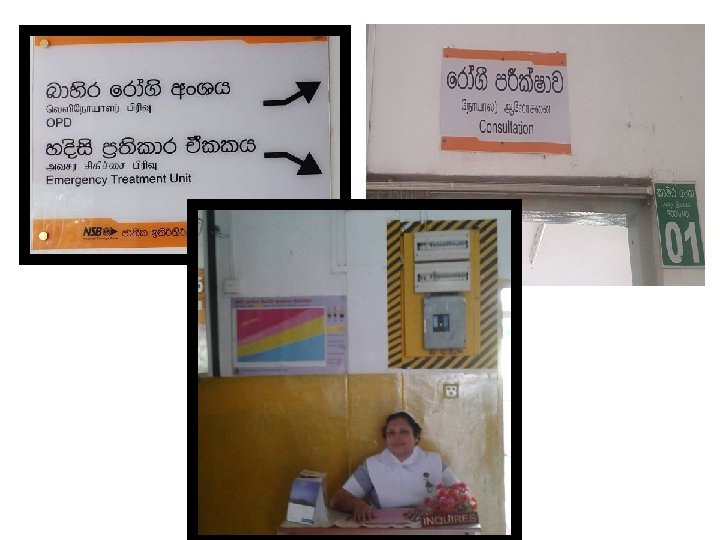
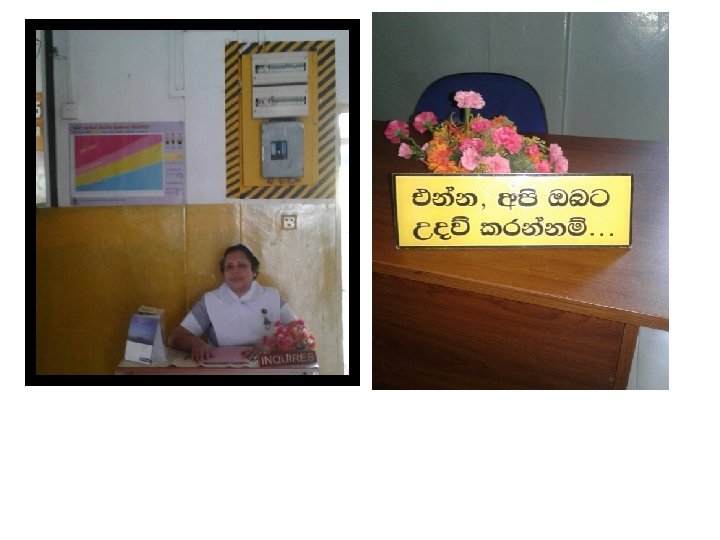
3. Name and direction boards
ONGOING PROJECTS……. 1. Catheter audit with microbiology unit
Kaizen Improvement B. H. wathupitiwala Directorate of Healthcare Quality & Safety - Version 6 (Last updated on 30. 01. 2018)
වතර ක නද ව ලකමට මදක ව හ ස වම Making GS towels & OT gowns at hospital is a good productive kaizen development නව ග නමට Directorate of Healthcare Quality & Safety - Version 6 (Last updated on 30. 01. 2018)
• X-Ray Eliminator reêr idïm, f. k hdug ; eáhla ms, sfh, lsÍu Directorate of Healthcare Quality & Safety - Version 6 (Last updated on 30. 01. 2018)
Kaizen development for Cistern tank safety • Back Rest Directorate of Healthcare Quality & Safety - Version 6 (Last updated on 30. 01. 2018)
reêr idïm, f. k hdug ; eáhla ms, sfh, lsÍu
ridhkd. dr fj; reêr idïm, f. k f. dia ndr §u
miq úmru • Èkm; d reêr idïm, /f. k hdu ms, sno ; ; aj l, u. Kdlrk tallh úiska mÍla. Idjg , la lrk , § • uq, a udih ; =, o. S idïm, jd¾; d wia: dk. ; ùï 04 la jd¾; d úh • ta ioyd úiÿï f, i jd¾; d igyka ; nd f. k idhkhg ndr § MRI hjk idïm, jd¾; d ; eme, a u. ska ksjigu , nd §u
• X-Ray Eliminator reêr idïm, f. k hdug ; eáhla ms, sfh, lsÍu Directorate of Healthcare Quality & Safety - Version 6 (Last updated on 30. 01. 2018)
Kaizen Improvement B. H. Meerigama Directorate of Healthcare Quality & Safety - Version 6 (Last updated on 30. 01. 2018)
1) ? Crowded medical clinic - created an appointment system with given time frame 2) 15 acres hospital land ? Difficult to clean - usable hospital land divided in to 10 areas and through cleaning of these areas with compatible calendar days. 3 )Water leaking on to the pavements from tube lines of AC plants -outer pipe line of AC extend over the pavement
Kaizen Improvement D. H. Minuwangoda Directorate of Healthcare Quality & Safety - Version 6 (Last updated on 30. 01. 2018)
MINIMISED OF WAITING TIME AT OUT PATIENT DEPARTMENT HEALTH CARE QUALITY MANAGEMENT UNIT BASE HOSPITAL MINUWANGODA
PROBLEM IDINTIFICATION • OPD WIT meeting by brainstorming • External customer suggestions box of OPD • OPD customer satisfaction survey • Direct appearences of OPD queue
Situation analysis Arrival to OPD Waiting for registration a REGISTRATI ON Waiting for consultation b CONSULTATION Waiting for pharmacy c Collect medicine Exit
LEAN Value • Registration • Consultation • Collect medicine • Waiting for registration Non -value • Waiting for consultation • Waiting for pharmacy
waiting time survey for current situation • Average 500 patents per day • Random sampling method -81 patients • Sample selected at entrance to the opd • Issued the data collection form at the opd entrance
Average Waiting Time -OPD Arrival to OPD a Registration b Consultation Room c e Pharmacy d Exit from OPD
• a -28 min A = a 1+a 2+a 3+……. . ect 81 • b -35 min B= b 1+b 2+b 3+……. . ect 81 • c -30 min C= C 1+C 2+C 3+………. ect 81 • Average opd waiting time= 93 min
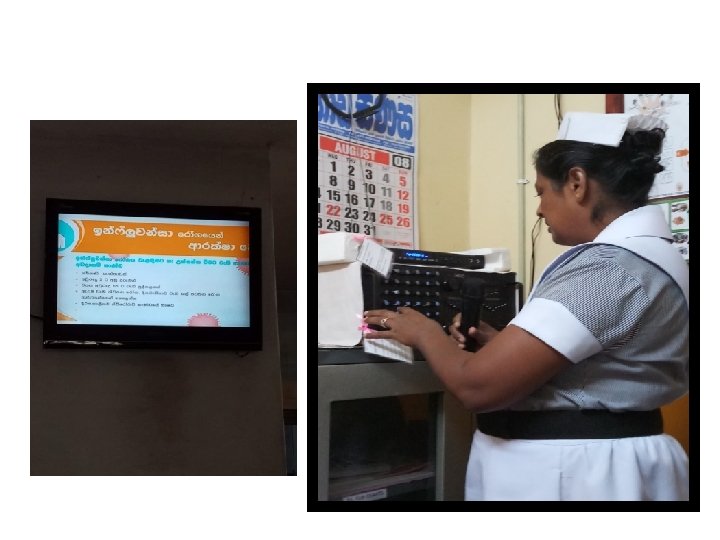
OS DRUGS ALERT SYSTEM
5 s
IMPLIMENTATION OF IMPROVEMENTS
Before & after waiting time 100 90 80 awarage waiting time for registration 70 60 avarage waiting time for consultation 50 avarage waiting time for pharmacy 40 30 avarage waiting time opd 20 10 0 before After
Total average waiting time 100 90 80 70 60 50 Column 1 40 Column 2 30 20 10 0 before after
Kaizen Improvement RDHS office-Gampaha Directorate of Healthcare Quality & Safety - Version 6 (Last updated on 30. 01. 2018)
Telephone based response system Directorate of Healthcare Quality & Safety - Version 6 (Last updated on 30. 01. 2018)
Directorate of Healthcare Quality & Safety - Version 6 (Last updated on 30. 01. 2018)
Directorate of Healthcare Quality & Safety - Version 6 (Last updated on 30. 01. 2018)
Website Online sharing of important information Directorate of Healthcare Quality & Safety - Version 6 (Last updated on 30. 01. 2018)
Directorate of Healthcare Quality & Safety - Version 6 (Last updated on 30. 01. 2018)
Directorate of Healthcare Quality & Safety - Version 6 (Last updated on 30. 01. 2018)
Directorate of Healthcare Quality & Safety - Version 6 (Last updated on 30. 01. 2018)
As the focal point……. . RDHS • Review QM activities six monthly • Capacity building of QM focal points at the district-Sharing best practices • Way forward…. . • Coordinate with hospitals to implement all clinical indicators • Supervisory visit to the institutions • Workshop to prepare 2019 QM action plan • Year end review Directorate of Healthcare Quality & Safety - Version 6 (Last updated on 30. 01. 2018)
No. Objective Strategy Activity Responsible person Time line Budget Process Indicator 01. To streamline the quality management activities in the health institutions in Gampaha district Preparing action plans for each health institutions for 2019(both hospitals & MOH offices) Workshop on preparing action plans for, Mo-QM September 2018 HSDP % of hospitals & MOH offices prepared action plans before 2019 January 1. focal points at hospitals (focal point) at RDHS To monitor the quality management activities in Gampaha district 1. Review activities at district level HSDP % of hospitals & MOH offices participated 02. 2. designated officer at MOHs 2. Supervisory visit to the institutions by using a supervisory tool Review meetings at RDHS office Mo-QM(focal point April & September i)Preparing a supervisory tool Mo-QM(focal point Two hospital for a month ii) Visit the hospitals by a team consist of focal point RDHS, CCP and one independent Mo(QM) from a hospital % of hospitals & MOH offices supervised Do supervision incorporated into the MOH supervision ii. Visit the MOH offices 03. To improve customer satisfaction and quality of care given to patients at health institutions at the district Capacity building Workshops at institutional level 1. DGH Negambo&Gampaha 2. B. H wathupitiwala&meerigama 3. Divisional hospital Divulapitiya, Kiribathgoda, Dompe, Minuwangoda Mo-focal point at RDHS &relevant focal point at the institutions From June to September Directorate of Healthcare Quality & Safety - Version 6 (Last updated on 30. 01. 2018) HSDP % of institutions completed work shop
Thank You Directorate of Healthcare Quality & Safety - Version 6 (Last updated on 30. 01. 2018)
THANK You Directorate of Healthcare Quality & Safety - Version 6 (Last updated on 30. 01. 2018)