ANNEXURE FOUR FIVE SocioEconomic Impact of HIVAIDS on


- Slides: 36
ANNEXURE FOUR & FIVE: Socio-Economic Impact of HIV/AIDS on Kwa. Zulu Natal The Management Challenge Peter Badcock-Walters & Lucinda Franklin HEARD (Health Economics & HIV/AIDS Research Division) University of Natal
ANNEXURE FIVE: Impact on Education Peter Badcock-Walters Research Associate HEARD
Key Presentation Points • HIV/AIDS is a development issue and the largest single management challenge facing education; • It will impact every aspect of management, teaching and learning for decades to come, as well as the social environment in which this occurs; • The primary impact of HIV/AIDS is to explode the scale of existing systemic and management problems in education; • The sustainability of the system is at risk with managers and educators up to 70% more at risk than the general population.
Key Presentation Points • Enrolments are in decline while drop out and attrition rates are increasing; • Growing numbers of teachers are leaving the system, with more of these the direct or indirect result of AIDS impact; • Impact on education will impact the communities in which it is provided and mirror dynamic change in population; • Impact is not uniform across the Province but geographically variable for various reasons; • Land use and reform will be impacted by these changes in the socio-economic dynamics of education.
Management Issues
Management Issue 1: Impact on Labour • • • Temporary Educator Loss Educator Attrition Educator Training Specialist Educator Losses Rationalization Planning Management Attrition
Management Issue 2: Impact on Enrolment and Gender • • • Enrolment Decline Increasing Attrition Learner/Educator Ratios Female Vulnerability Gender Equity
Management Issue 3: Growth in Number of Orphans • • • Incidence Orphaning Impact on Education Declining Enrolment, Drop-Out and Fees Social Instability
Management Issue 4: Decline in School Fees • • • Payment of School Fees Incidence Local Impact Extended Family Support Policy Response
Management Issue 5: Transition Rates and Output • • Primary/Secondary Transition Rates Graduation Rates Gender Bias Specialist/Rare Subject Pass
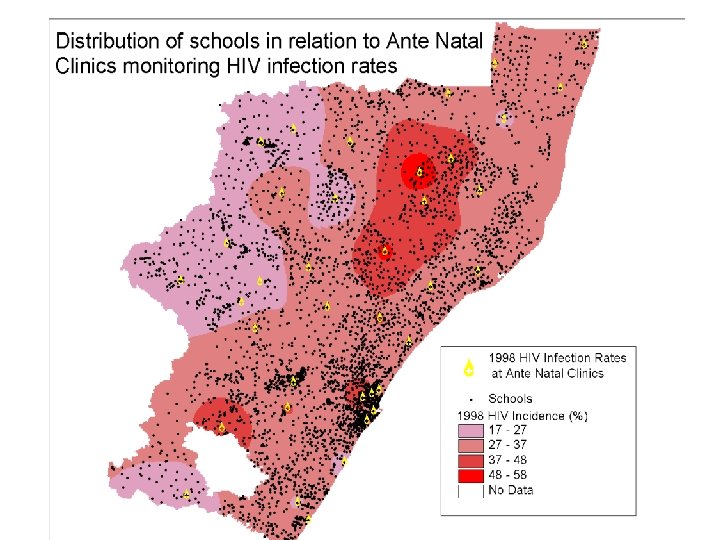
Management Issue 6: Geographic Impact Variation • • Aggregated national and provincial data Prevalence ‘hot spots’ Policy issues Information use
Declining Enrolment in KZN: Case Study • KZN is South Africa’s largest provincial system with almost 3 million pupils and about 75 000 teachers • Grade One enrolment in KZN grew as expected between 3% and 5% over the 15 years to 1998 • Growth slowed to 3% in 1998 and was expected to plateau in the new millennium due to reduced general fertility rates • Linked demand for teachers was projected to drop and contributed to a decision to close Colleges of Education, transferring responsibility to universities.
Enrolment Decline • Grade One enrolment declined sharply, unrelated to policy change, from +3% in 1998 to – 12% in 1999, according to 10 th School Day/Snap Survey data • Grade One enrolment reduced from 340 379 in 1998 to 299 357 in 1999 • 2000 policy change precluded the entry of pupils under 7, coinciding with a further drop of – 24% in Grade One enrolment • Policy change alone does not explain this 24% decline which reduced enrolment from 299 357 in 1999 to 227 728 in 2000.
1998 - 1999 Change in Grade 1 Enrolment
1999 - 2000 Change in Grade 1 Enrolment
Gross Increase/ Net Decline • 2001 Grade One enrolment would be expected to grow by about 30% to absorb all the 6 year olds (and younger) held back in 2000 • Grade One enrolment in 2001 rose from 227 728 in 2000 to 273 833 • Growth was limited to +20% in fact, suggesting a real decline of a further 10% • Rates of decline were similar for girls and boys • Geographic disparity between districts was very great confirming that provincial data masks regional variance and comparative hot spots
2000 - 2001 Change in Grade 1 Enrolment
Total Grade 1 Enrolment for Kwa. Zulu-Natal 1998 - 2001
Declining Grade 1 Enrolment: -10% -25 % -29 % % 4 1 + Gr 1 Enrolment, Port Shepstone Region 1997 - 2001
Declining Grade 1 Enrolment: % 6% -2 +3% -15 % 5 1 + Gr 1 Enrolment, Msinga District 1997 - 2001
1998 - 2001 Net decline in Grade 1 Enrolment
Increase in enrolment required in 2002 to return to 1998 levels of Grade 1 enrolment
Households in Poverty The percentage households whose income falls below the Minimum Living Level (MLL) as defined by the Bureau of Market Research
Socio-economic deprivation* * Composite index based on Economic Dependency Ratio, Average years of Education of adults and Percentage Households with Electricity Source: 1996 Census, Statistics SA
Net Decline in Grade One • Only one of 41 education districts experienced real growth (5%) in Grade One enrolment 1998 to 2001 • Total Grade One enrolment in 2001 was 273 633, or 20% lower than the 1998 total of 340 379 • Female participation rates in Grade One remained surprisingly constant at 48% over the period • 24% growth in Grade One enrolment is required in 2002 to return the system to 1998 levels • Teacher attrition rates of over 7% (and climbing) will still require a further 70 000 teachers to be trained by 2010 in spite of falling enrolment.
Diagnosing the Decline • Whatever the reasons, the decline is first and foremost a management problem of major proportion • At least eleven reasons for the decline present themselves: – Data Quality - Improved Data Collection – Normalized Enrolment - Migration Patterns – Reduced Female Intake - Decline in Fertility – Infant Mortality - Economic Impact – Orphaning - Domestic Responsibilities - Policy Change
The HIV/AIDS Connection? • The decline almost certainly stems from a combination of all these factors but it is impossible to say in what proportion • HIV/AIDS directly or indirectly impacts most of these factors, particularly household economics, HIV-related infertility, infant mortality, orphaning, female participation, homecare needs and even migration • Spatial analysis confirms that there is no clear or constant pattern of decline but that it impacts both urban and rural areas and has some links to the ‘hot spots’ of reported antenatal prevalence.
Teacher Attrition in KZN: A Case Study • Normal attrition • In 1999 6. 79% of educators left the system. • Estimated that 0. 64% left because of AIDS. • Around 6. 1% can be considered normal attrition. • HIV/AIDS attrition • Is only at the beginning. AIDS deaths are increasing sharply and will reach close to 5% a year by 2010.
Results • The rate at which educators leave the system will more than offset the reduction in total demand • HIV/AIDS will have an increasingly serious impact on educator attrition rates
Conclusions • The total number of educators needed will decrease • The training requirement will, however, increase as educators leave the system faster then the decline in the need. • Total decline by 2008 in demand • Total educators leaving by 2008 • Training requirement 2000 -2008 4 946 64 418 59 472
Implications for an average primary school • 2001 – 1310 students – Requires 38 teachers • 2005 – 1109 students – Requires 33 teachers
Implications…. . • 2009 – 1075 students – 31 teachers required – 27 teachers left 2001 -end 2009 – 4 teachers remaining from 2001 staff
Lessons for Land Reform? • There is great geographic variation in HIV/AIDS impact within KZN, with identifiable ‘hot spots’; • Population profiles are changing dynamically with the most economically active group at greatest risk; • Growing numbers of dependent orphans, school drop-outs and other vulnerable children will be seen in the community and in migration patterns; • Household and community ‘wealth’ will decline due to loss of bread winners and subverted expenditure; • There will be a decline in the number of experienced teachers in communities and consequently in their availability to guide and influence community life;
Lessons for Land Reform? • Growing incidence of illness and mortality will change the social patterns of community life and work; • Demand projections for land, services and systems may require major revision; • Impact on education will reduce the flow of skilled labour but increase the flow of unskilled and dependent labour; • Incidence of child labour on the land in the home may increase; • Demand for training in land use coupled to access may increase, with capacity to stem the degree of likely urban migration.