The Application of Single Nucleotide Polymorphisms SNPs and
 and Lung Cancer Risk Zuo-Feng Zhang, MD,")
 – Incidence: ranked #1 (1. 35")


 l Mismatch l Base Repair (MMR) Excision")


 Buccal Biospecimen (%) Control 1540 1040")


= α + β 1(PCNA) +")

/[ (1 - )+(1 - )")


 (Age")

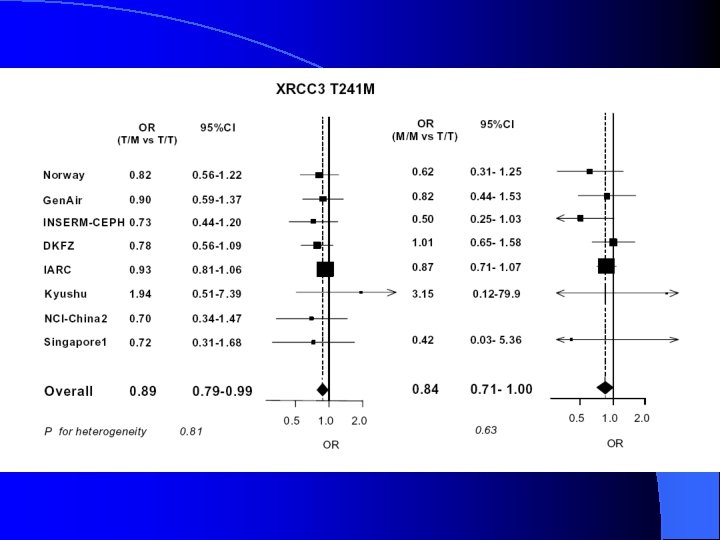
 (rs 25406) IN INTRON 2 AND LUNG CANCER")
 (rs 25406) IN INTRON 2 AND LUNG CANCER")
 (rs 25406) IN INTRON 2 AND LUNG CANCER")
 (rs 25406) IN INTRON 2 AND LUNG CANCER")


")


 Controls (%) Crude OR Adjusted OR* Q/Q 251 (62. 0%) 451")


 Has 3 known functional regions: l N-terminus")
 HWE pvalue Cases (%) HWE pvalue Crude OR (95% CI) ORadj")


")


 cells via cytokine")


- Slides: 72
The Application of Single Nucleotide Polymorphisms (SNPs) and Lung Cancer Risk Zuo-Feng Zhang, MD, Ph. D
Epidemiology of Lung Cancer l Worldwide statistics (2002) – Incidence: ranked #1 (1. 35 million cases) – Mortality: ranked #1 (1. 18 million deaths) – 5 -year survival rate: around 10% in Europe; 8. 9% in developing countries l U. S. statistics (2006) – Incidence: ranked #3 (174, 470 cases) – Mortality: ranked #1 (162, 460 deaths) – 5 -year survival rate: 15%
Risk Factors for Lung Cancer – Tobacco smoking – ETS – Asbestos – Radon exposure – Occupational exposures – Air pollution – Other radiation – Recurring inflammation – Family history of cancer – Insufficient diet and poor nutritional factors
Theoretical model of gene-environmental interaction pathway for lung cancer susceptibility Tobacco/alcohol infection Environmental Carcinogens / Procarcinogens Exposures Nitrosemins, Xenobiotics, Diet/nutrient CYP 2 E 1 Diet and nutritional factors Null GSTP 1 GSTM 1 Detoxified carcinogens Active carcinogens Tyr 113 His 139 Arg m. EH Ile 105 Val Ala 114 Val Pro 187 Ser Diet/nutrient Free radicals Oxidative Stress m. EH NQO 1 DNA damage repaired DNA Damage Tyr 113 His 139 Arg Normal cell Defected DNA repair gene If DNA damage not repaired XRCC 3 M G 1 G 2 Arg 72 Pro P 16 G 0 S G 870 A Ala 146 Thr Cyclin D 1 If loose cell cycle control Carcinogenesis Programmed cell death P 53
DNA Repair Pathways l Direct Reversal (DR) l Mismatch l Base Repair (MMR) Excision Repair (BER) l Nucleotide l Double Excision Repair (NER) Strand Break Repair (DSBR)
BER Pathway
BER Pathway l Polymorphisms in the BER pathway may alter the repairing capacity of this pathway and modify the risk of lung and head-and-neck cancers. l To examine the individual associations of the h. OGG 1 Ser 326 Cys, APEX 1 Asp 148 Glu, PCNA C T (intron 2), XRCC 1 Arg 194 His and Arg 280 His, LIG 1 T C (exon 25), A C (exon 6), C T (exon 2), and A G (intron 1), – and LIG 3 C T (exon 21) polymorphisms – with the risk of lung and head-and-neck cancer, and to investigate whether these polymorphisms alter the effects of environmental risk factors, including active and passive cigarette smoking and alcohol drinking, on the development of lung and head-and-neck cancer in the population of Los Angeles County. – – –
Study Design A population-based case-control study in Los Angeles County l Study design: l Subjects Selection Criteria – Patients must be newly diagnosed – Both genders – Ages 18 -65 years – Residents of Los Angeles County during the observation period (1999 -2004) – In stable medical condition as determined by their physician l Epidemiology data collection – Interviewed by trained interviewers; 30 ml of buccal cell samples were collected during the time of interviews
Data sources sociodemographic characteristics l Data from cancer surveillance program history of tobacco smoking environmental tobacco smoking Questionnaire data l Buccal cells were collected – About 90% of subjects donated buccal cells. drug use Dietsys l USDA food composition data l Continuing survey of food intake for individuals (CSFII) selected clinical factors l l alcohol use occupational exposures environmental exposures food frequency questionnaire
RESPONSE RATES OF THE PARTICIPANTS Eligible Interviewed (%) Buccal Biospecimen (%) Control 1540 1040 (67. 5) 928 (89. 2) Lung 1577 611 (38. 7) 544 (89. 0) Oral 584 303 (51. 9) 195 (64. 4) Esophageal 316 108 (34. 2) 97 (89. 8) Pharynx 238 100 (42. 0) 77 (77. 0) Larynx 226 90 (39. 8) 79 (87. 8)
Laboratory Assays l DNA Extraction and Genotyping – Genomic DNA was isolated using a modified phenolchloroform protocol. – Genotyping of the SNPs was assayed by SNPlex. TM techniques. – PCR-RFLP was used for validation
Confounding Variables l Age – <35, 35 -36, 37 -38, 39 -40, 41 -42, 43 -44, 45 -46, 47 -48, 49 -50, 51 -52, 53 -54, 55 -56, 57 -58, and 59 -62 l l Gender Race/ethnicity – white, Mexican American, African American, Asian American, and other l Education level – years of schooling l l Pack-years of smoking Alcohol consumption (for head-and-neck cancer only) – alcohol drink-years
Logistic Regression Model for Individual Associations l Logit (R)= α + β 1(PCNA) + β 2(packyears) + β 3(age) + β 4 (gender) + β 5(education level) + β 6(ethnicity)
Interaction Assessment l To assess a potential gene-environment interaction, a product term is added that allows the effect estimate for one variable to vary within levels of another, and vice versa. l Logit (R)= α + β 1(PCNA) + β 2(smoking. Y/N) + β 3(age) + β 4 (gender) + β 5(education level) + β 6(ethnicity) + 12 (PCNA smoking. Y/N)
False Positive Assessment l FPRP = (1 - )/[ (1 - )+(1 - ) ] = 1/{1+[ /(1 - )][(1 - )/ ]} : prior probability : statistical size 1 - : probability of rejecting when alternative hypothesis is true l Wacholder et al. , 2004
Haplotype Method l SNPs in one gene may have linkage disequilibrium and may be associated with cancer risk as haplotype or linked with unmeasured candidate genes. l Haplotypes were reconstructed using the PHASE version 2.
Statistical Analysis l We used SAS 9. 1 software to perform data analyses. l Primarily, unconditional logistic regression was employed to obtain odds ratios and 95% confidence limits. l Stratified analysis was used to assess effect modification.
Demographic characteristics for lung cancer cases and population controls Variables Mean Age (years) (Age range) Lung Cancer Cases (n = 611) N (%) Controls (n = 1029) N (%) With DNA (551) Without DNA (60) With DNA (939) Without DNA (90) 52. 2 (32 – 59) 52. 3 (41 – 59) 50. 2 (29 – 62) 49. 5 (30 – 60) P-value = 0. 90 Age (years) < 35 35 -44 45 -54 55 4 (0. 73) 51 (9. 3) 273 (50) 223 (40) P-value = 0. 37 0 (0. 0) 6 (10) 28 (47) 26 (43) 38 (4. 1) 155 (17) 452 (48) 294 (31) P-value = 0. 88 Race/Ethnicity Caucasian Mexican American African American Asian American Other Missing 320 (58) 50 (9. 1) 90 (16) 59 (11) 31 (5. 6) 1 P-value = 0. 79 39 (65) 3 (5. 0) 6 (10) 11 (18) 1 (1. 7) 0 P-value = 0. 13 Gender Male Female 278 (50) 273 (50) 583 (62) 140 (15) 79 (8. 4) 53 (5. 7) 83 (8. 9) 1 25 (42) 35 (58) 248 (45) 55 (10) 0 575 (61) 364 (39) 41 (46) 49 (54) P-value = 0. 004 17 (28) 27 (45) 16 (27) 0 P-value = 0. 0003 45 (50) 8 (8. 9) 23 (25) 7 (7. 8) 0 P-value < 0. 0001 P-value = 0. 20 Education Level 12 years >12 - 16 years > 16 years Missing 3 (3. 3) 16 (18) 47 (52) 24 (27) 276 (29) 422 (45) 240 (26) 1 23 (26) 49 (54) 18 (20) 0 P-value = 0. 22
Association between tobacco smoking and alcohol consumption and lung cancer risk Tobacco Smoking Cases Controls Adjusted OR (95% CL) 0 110 484 1. 0 >0 -20 102 350 1. 4 (0. 99, 1. 9) >20 -40 202 136 8. 3 (6. 0, 12) >40 197 58 22 (15, 33) Pack-Years* Trends Ptrend <. 0001 Alcohol(drinks/day)** 0 - <2 446 870 1. 0 2 164 156 1. 1 (0. 80, 1. 5) *Adjusted for age, gender, ethnicity, and education. **Adjusted for age, gender, ethnicity, education and pack-years of smoking.
THE ASSOCIATION BETWEEN PCNA (C T) (rs 25406) IN INTRON 2 AND LUNG CANCER RISK Stratified by Cases N (%) Controls N (%) Crude OR (95% CL) Adjusted OR (95% CL) CC 128 (33. 3) 259 (36. 3) 1. 0 CT 177 (46. 1) 357 (50. 1) 1. 0 (0. 76, 1. 3) 0. 90 (0. 65, 1. 2) TT 79 (20. 6) 97 (13. 6) 1. 6 (1. 1, 2. 4) 1. 4 (0. 89, 2. 1) Ptrend = 0. 0228 Ptrend = 0. 3060 PCNA genotypesa CC + CT 305 (79. 4) 616 (86. 4) 1. 0 TT 79 (20. 6) 97 (13. 6) 1. 6 (1. 2, 2. 3) 1. 5 (0. 99, 2. 1) Pack-years of Smokingb 0 CC + CT 55 (85. 9) 289 (86. 8) 1. 0 TT 9 (14. 1) 44 (13. 2) 1. 1 (0. 50, 2. 3) 0. 89 (0. 38, 2. 0) CC + CT 49 (84. 5) 211 (85. 4) 1. 0 TT 9 (15. 5) 36 (14. 6) 1. 1 (0. 49, 2. 4) 0. 97 (0. 43, 2. 2) CC + CT 201 (76. 7) 116 (87. 2) 1. 0 TT 61 (23. 3) 17 (12. 8) 2. 1 (1. 2, 3. 7) 2. 4 (1. 3, 4. 5) >0 – 20 >20 a Adjusted for gender, age, education, ethnicity, and tobacco smoking (pack-years). b Adjusted for gender, age, education, and ethnicity.
THE ASSOCIATION BETWEEN PCNA (C T) (rs 25406) IN INTRON 2 AND LUNG CANCER RISK Stratified by Cases N (%) Controls N (%) Crude OR (95% CL) Adjusted OR (95% CL) Alcohol Drinking (Drinks/Day)a 0 - <2 CC + CT 227 (82. 2) 517 (86. 6) 1. 0 TT 49 (17. 8) 80 (13. 4) 1. 4 (0. 95, 2. 1) 1. 3 (0. 80, 2. 0) CC + CT 77 (72. 0) 98 (85. 2) 1. 0 TT 30 (28. 0) 17 (14. 8) 2. 2 (1. 2, 4. 4) 2. 2 (0. 99, 4. 9) 2 a Adjusted for gender, age, education, ethnicity, and tobacco smoking (pack-years).
THE ASSOCIATION BETWEEN PCNA (C T) (rs 25406) IN INTRON 2 AND LUNG CANCER RISK Stratified by Cases N (%) Controls N (%) Crude OR (95% CL) Adjusted OR (95% CL) CC + CT 50 (73. 5) 616 (86. 4) 1. 0 TT 18 (26. 5) 97 (13. 6) 2. 3 (1. 3, 4. 1) 2. 1 (1. 1, 4. 1) CC + CT 38 (80. 8) 616 (86. 4) 1. 0 TT 9 (19. 2) 97 (13. 6) 1. 5 (0. 71, 3. 2) 1. 6 (0. 67, 3. 9) CC + CT 45 (83. 3) 616 (86. 4) 1. 0 TT 9 (16. 7) 97 (13. 6) 1. 3 (0. 60, 2. 7) 1. 2 (0. 51, 2. 9) Histologya Large cell Small cell Squamous cell Adenocarcinoma CC + CT 156 (78. 8) 616 (86. 4) 1. 0 TT 42 (21. 2) 97 (13. 6) 1. 7 (1. 1, 2. 6) a Adjusted for gender, age, education, ethnicity, and tobacco smoking (pack-years).
THE ASSOCIATION BETWEEN PCNA (C T) (rs 25406) IN INTRON 2 AND LUNG CANCER RISK Stratified by Cases N (%) Controls N (%) Crude OR (95% CL) Adjusted OR (95% CL) CC + CT 174 (76. 0) 386 (86. 3) 1. 0 TT 55 (24. 0) 61 (13. 7) 2. 0 (1. 3, 3. 0) 1. 9 (1. 1, 3. 2) Ethnicityc Caucasian Mexican/Hispanic CC + CT 27 (93. 1) 101 (91. 8) 1. 0 TT 2 (6. 9) 9 (8. 2) 0. 83 (0. 17, 4. 1) 0. 64 (0. 11, 3. 9) CC + CT 50 (84. 7) 48 (81. 4) 1. 0 TT 9 (15. 3) 11 (18. 6) 0. 79 (0. 30, 2. 1) 0. 66 (0. 20, 2. 2) CC + CT 38 (86. 4) 28 (80. 0) 1. 0 TT 6 (13. 6) 7 (20. 0) 0. 63 (0. 19, 2. 1) 0. 48 (0. 12, 1. 8) CC + CT 16 (72. 7) 53 (85. 5) 1. 0 TT 6 (27. 3) 9 (14. 5) 2. 2 (0. 68, 7. 1) 2. 7 (0. 72, 10) African American Asian Other** c Adjusted for age, gender, education, and tobacco smoking (pack-years).
FALSE POSITIVE REPORT PROBABILITY FOR MAJOR LUNG CANCER RESULTS Gene SNP PCNA Stratum OR (95%CL) Power under recessive modela Reported P value Prior Probabilityb . 5 . 25 . 1 . 001 All (TT vs. CC+CT) 1. 5 (0. 99, 2. 1) 0. 79 0. 018 . 022 . 065 . 172 . 695 . 958 Heavy smokers 2. 4 (1. 3, 4. 5) 0. 25 0. 006 . 025 . 071 . 186 . 715 . 962 Heavy drinkers 2. 2 (0. 99, 4. 9) 0. 21 0. 054 . 203 . 434 . 697 . 962 . 996 Large cell 2. 1 (1. 1, 4. 1) 0. 26 0. 030 . 103 . 255 . 507 . 919 . 991 Adenocarcinoma 1. 7 (1. 1, 2. 6) 0. 49 0. 014 . 028 . 081 . 209 . 744 . 967 Caucasian 1. 9 (1. 1, 3. 2) 0. 46 0. 016 . 033 . 093 . 236 . 773 . 972 a Estimation of the statistical power to detect an OR of 1. 5 with level of 0. 05. b False-positive report probabilities for the observed odds ratios.
ASSOCIATIONS OF THE LIG 1 HAPLOTYPES OF THE FOUR SNPS AND LUNG CANCER Overall, n (case/control ) TCCA CATA CCCG CCCA CCTA TACA All Others 346/695 325/582 112/169 51/65 11/25 18/28 3/8 10/6 1. 0 1. 1 (0. 93, 1. 4) 1. 3 (1. 0, 1. 4) 1. 6 (1. 1, 2. 3) 0. 88 (0. 43, 1. 8) 1. 3 (0. 70, 2. 4) 0. 75 (0. 20, 2. 9) 3. 3 (1. 2, 9. 3) 1. 6 (0. 78, 3. 1) 1. 3 (0. 31, 5. 9) 3. 2 (0. 99, 11) Crude OR 1. 0 1. 2 1. 4 1. 8 0. 81 Adj (0. 95, 1. 5) (1. 0, 1. 9) (1. 1, 2. 8) (0. 35, 1. 9) * Adjusted for gender, age, education, ethnicity, and tobacco smoking (pack-years). ORa
ASSOCIATIONS OF THE LIG 1 HAPLOTYPES AND LUNG CANCER TCCA CATA CCCG CCCA CCTA TACA All Others 55/322 68/272 15/71 13/30 1/15 0/5 1/2 1. 2 (0. 66, 2. 3) 2. 5 (1. 2, 5. 2) 0. 39 (0. 051, 3. 0) - 1. 0 1. 5 (1. 0, 2. 2) 2. 9 (0. 26, 33) 1. 2 (0. 62, 2. 2) 2. 3 (1. 1, 4. 8) 0. 34 (0. 043, 2. 6) 0. 40 (0. 051, 3. 1) - 1. 0 1. 4 (0. 94, 2. 1) 2. 6 (0. 22, 30) 209/252 180/208 63/63 27/18 7/9 12/8 2/2 8/4 Crude OR 1. 0 (0. 80, 1. 4) 1. 2 (0. 81, 1. 8) 1. 8 (0. 97, 3. 4) 0. 94 (0. 34, 2. 6) 1. 8 (0. 73, 4. 5) 1. 2 (0. 17, 8. 6) 2. 4 (0. 72, 8. 1) Adj ORb 1. 0 (0. 79, 1. 4) 1. 2 (0. 78, 1. 8) 1. 5 (0. 78, 2. 8) 0. 84 (0. 30, 2. 3) 2. 1 (0. 84, 5. 3) 1. 3 (0. 18, 9. 1) 2. 9 (0. 84, 9. 8) 82/121 77/102 34/35 11/17 3/1 5/5 1/1 1/0 1. 1 (0. 74, 1. 7) 1. 4 (0. 83, 2. 5) 0. 96 (0. 43, 2. 1) 4. 4 (0. 45, 43) 1. 5 (0. 41, 5. 3) 1. 5 (0. 091, 24) - Crude OR 1. 0 1. 1 (0. 74, 1. 7) 1. 5 (0. 85, 2. 6) 0. 94 (0. 41, 2. 2) 4. 4 (0. 44, 44) 1. 3 (0. 35, 4. 6) 1. 5 (0. 088, 26) - Adj ORb Stratified by Smoking status Never Crude OR Adj Orb Former Current b Adjusted for gender age, education, and ethnicity.
MULTIGENETIC ASSOCIATION WITH LUNG CANCER # of Potential Risk Genotypes Cases Control Crude OR Adjusted OR* 0 50 (24. 5) 157 (34. 3) 1. 0 1 -2 122 (59. 8) 237 (51. 7) 1. 6 (1. 1, 2. 4) 1. 7 (1. 1, 2. 7) 3 -5 32 (15. 7) 64 (14. 0) 1. 6 (0. 92, 2. 7) 2. 2 (1. 1, 4. 1) Ptrend = 0. 038 Ptrend = 0. 0104 1. 1 (0. 98, 1. 3) 1. 2 (1. 0, 1. 5) Continuous * Adjusted for age, gender, education, race/ethnicity and pack-years of smoking.
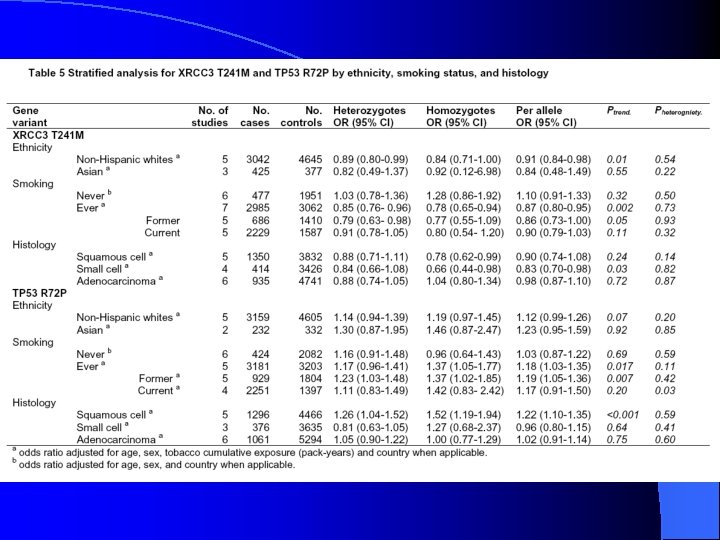
Discussion on BER Results l We observed an overall association of PCNA (C T) SNP with lung cancer risk, and the smoking status in pack-years and alcohol drinking status seemed to modify the association of PCNA SNP with lung cancer. l We did not detect any consistent association between individual LIG 1 polymorphisms and lung cancer. l When we considered all the SNPs together as haplotypes, we observed the associations between the LIG 1 haplotypes and the cancer risks. l The dose-response association of these SNPs in the BER pathway suggested the possible interaction among these SNPs since they are the components involved in this pathway. This also explained why we could not detect the individual SNP association. The SNPs in the same pathway work together to maintain the genome stability.
NER Pathway Costa RM, 2003
XPG polymorphism and the risk of lung cancer 1 Adjusted for age, sex, race-ethnicity, educational level, and tobacco smoking.
Joint effect of tobacco smoking and XPG polymorphism on lung cancer risk Departure from additivity: 23 -13 -1. 9+1=9. 1, 95% CL=-2. 9, 21. 7 Pack-years: XPG: Never 1 -20 Asp/Asp >20 Asp/Asp Never His/His +His/Asp 1 -20 His/His +His/Asp >20 His/His +His/Asp
Joint effect of tobacco, alcohol, and XPG polymorphism on SCCUAT Drinks per day: 1 -2 1 -2 >=3 >=3 Packyears: <=20 >20 >20 His/His +His/Asp Asp/Asp His/His +His/Asp XPG: Asp/Asp His/His +His/Asp Asp/Asp
NER Cases (%) Controls (%) Crude OR Adjusted OR* Q/Q 251 (62. 0%) 451 (61. 4) 1. 0 Q/R 125 (30. 9%) 254 (34. 6%) 0. 88 (0. 68, 1. 15) 1. 23 (0. 89, 1. 70) R/R 29 (7. 2%) 29 (4. 0%) 1. 80 (1. 05, 3. 08) 2. 10 (1. 09, 4. 03) All Lung Cancer Cases ERCC 6 Q 1413 R Ptrend=0. 02 Q/Q + Q/R 376 (92. 8%) 705 (96. 1%) 1. 0 R/R 29 (7. 2%) 29 (4. 0%) 1. 88 (1. 10, 3. 19) 1. 94 (1. 02, 3. 68) Total 405 (100%) 734 (100%) R/R 420 (85. 4%) 756 (86. 7%) 1. 0 P/R 67 (13. 6%) 107 (12. 3%) 1. 13 (0. 81, 1. 56) 1. 13 (0. 76, 1. 69) P/P 5 (1. 0%) 9 (1. 0%) 1. 00 (0. 33, 3. 00) 1. 37 (0. 36, 5. 26) ERCC 6 R 1230 P Ptrend=0. 46 P/R + P/P 72 (14. 6%) 116 (13. 3%) 1. 0 R/R 420 (85. 4%) 756 (86. 7%) 0. 90 (0. 65, 1. 23) 0. 87 (0. 59, 1. 29) Total 492 (100%) 872 (100%)
TABLE III – ASSOCIATION BETWEEN THE NER POLYMORPHISM AND THE RISK OF LUNG CANCER STRATIFIED BY PATHOLOGICAL DIAGNOSIS Gene / SNP Cases (%) Controls (%) Crude OR Adjusted OR* Q/Q + Q/R 184 (92. 5%) 705 (96. 1%) 1. 0 R/R 15 (7. 5%) 29 (4. 0%) 1. 98 (1. 04, 3. 77) 2. 19 (1. 05, 4. 59) Total 199 (100%) 734 (100%) Q/Q + Q/R 59 (95. 2%) 705 (96. 1%) 1. 0 R/R 3 (4. 8%) 29 (4. 0%) 1. 24 (0. 37, 4. 18) 1. 66 (0. 38, 7. 19) Total 62 (100%) 734 (100%) Q/Q + Q/R 46 (90. 2) 705 (96. 1%) 1. 0 R/R 5 (9. 8%) 29 (4. 0%) 2. 64 (0. 98, 7. 15) 2. 18 (0. 63, 7. 47) Total 51 (100%) 734 (100%) Q/Q + Q/R 72 (93. 5%) 705 (96. 1%) 1. 0 R/R 5 (6. 5%) 29 (4. 0%) 1. 69 (0. 63, 4. 50) 2. 19 (0. 71, 6. 78) Total 77 (100%) 734 (100%) RCC 6 Q 1413 R Adenocarcinoma Squamous Small Cell Large Cell
ERCC 6 Q 1413 R Cases Controls Adjusted OR* No Q/Q + Q/R 64 324 1. 0 No R/R 2 18 0. 59 (0. 12, 2. 82) Yes Q/Q + Q/R 312 381 4. 41 (3. 18, 6. 14) Yes R/R 27 11 19. 44 (8. 33, 45. 35) OR interaction = 5. 82 (1. 08, 31. 38) Smoker ERCC 6 R 1230 P Cases Controls Adjusted OR* No R/R 41 202 1. 0 No P/R + P/P 25 140 2. 87 (1. 28, 6. 40) Yes R/R 210 249 4. 29 (3. 12, 5. 92) Yes P/R + P/P 129 143 5. 63 (3. 43, 9. 24) OR interaction = 0. 56 (0. 25, 1. 27)
TABLE III – ASSOCIATION BETWEEN THE NER POLYMORPHISM AND THE RISK OF LUNG CANCER STRATIFIED BY PATHOLOGICAL DIAGNOSIS Gene / SNP Cases (%) Controls (%) Crude OR Adjusted OR* Q/Q + Q/R 184 (92. 5%) 705 (96. 1%) 1. 0 R/R 15 (7. 5%) 29 (4. 0%) 1. 98 (1. 04, 3. 77) 2. 19 (1. 05, 4. 59) Total 199 (100%) 734 (100%) Q/Q + Q/R 59 (95. 2%) 705 (96. 1%) 1. 0 R/R 3 (4. 8%) 29 (4. 0%) 1. 24 (0. 37, 4. 18) 1. 66 (0. 38, 7. 19) Total 62 (100%) 734 (100%) Q/Q + Q/R 46 (90. 2) 705 (96. 1%) 1. 0 R/R 5 (9. 8%) 29 (4. 0%) 2. 64 (0. 98, 7. 15) 2. 18 (0. 63, 7. 47) Total 51 (100%) 734 (100%) Q/Q + Q/R 72 (93. 5%) 705 (96. 1%) 1. 0 R/R 5 (6. 5%) 29 (4. 0%) 1. 69 (0. 63, 4. 50) 2. 19 (0. 71, 6. 78) Total 77 (100%) 734 (100%) RCC 6 Q 1413 R Adenocarcinoma Squamous Small Cell Large Cell
Double Strand Break Repair
NBS 1 protein (Nibrin or p 95) Has 3 known functional regions: l N-terminus (1 -196 a. a. ) l Central region (278 -343 a. a. ) l C-terminus (665 -693 a. a. ) – Believed to bind site to the MRN complex
Variable Controls (%) HWE pvalue Cases (%) HWE pvalue Crude OR (95% CI) ORadj (95% CI)* Ex 16+1785 T>C T/T 369 (45. 95) C/T 363 (45. 21) C/C 71 (8. 84) 53 (11. 73) 226 159 C/C 397 (45. 74) 223 (45. 70) C/G 397 (45. 74) G/G 74 (8. 53) 57 (11. 68) 161 123 A/A 356 (44. 33) 233 (50. 76) A/G 366 (45. 58) G/G 81 (10. 09) 57 (12. 42) 226 152 Missing 211 (46. 68) 0. 19 188 (41. 59) 0. 28 1. 0 0. 91 (0. 71, 1. 16) 0. 85 (0. 63, 1. 13) 1. 31 (0. 88, 1. 94) 1. 12 (0. 69, 1. 80) p-trend= 0. 5974 Ex 16+572 C>G Missing 0. 83 208 (42. 62) 0. 41 1. 0 0. 93 (0. 74, 1. 18) 0. 88 (0. 67, 1. 17) 1. 37 (0. 94, 2. 01) 1. 35 (0. 85, 2. 14) p-trend=0. 628 Pro 672 Pro Missing 0. 40 169 (36. 82) 0. 0043 a 1. 0 0. 71 (0. 55, 0. 90) 0. 71 (0. 53, 0. 95) 1. 08 (0. 74, 1. 57) 1. 25 (0. 80, 1. 96) p-trend=0. 7126
Table III. Association of Pro 672 Pro and lung cancer (smoking and passive smoking exposure) Pro 672 Pro Controls (%) Cases (%) Crude OR (95% CI) ORadj (95% CI)* wt/wt 170 (45. 3) 32 (39. 5) 1. 0 wt/var 165 (44) 34 (42. 0) 1. 10 (0. 65, 1. 86) 1. 27 (0. 71, 2. 26) var/var 40 (10. 7) 15 (18. 5) 1. 99 (0. 99, 4. 03) 1. 92 (0. 85, 4. 36) wt/wt 186 (43. 5) 201 (53. 2) 1. 0 wt/var 201 (47. 0) 135 (35. 7) 0. 62 (0. 46, 0. 84) 0. 66 (0. 48, 0. 90) var/var 41 (9. 6) 42 (11. 1) 0. 95 (0. 59, 1. 52) 1. 22 (0. 73, 2. 05) wt/wt 40 (46. 5) 10 (40. 0) 1. 0 wt/var 39 (45. 4) 10 (40. 0) 1. 03 (0. 38, 2. 74) 1. 57 (0. 47, 5. 23) var/var 7 (8. 1) 5 (20. 0) 2. 86 (0. 75, 10. 92) 5. 42 (0. 88, 33. 54) wt/wt 130 (45. 1) 22 (39. 3) 1. 0 wt/var 126 (43. 8) 24 (42. 9) 1. 13 (0. 60, 2. 11) 1. 29 (0. 65, 2. 55) var/var 32 (11. 1) 10 (17. 9) 1. 85 (0. 80, 4. 28) 1. 59 (0. 61, 4. 13) Never-smokers Ever-smokers Passive no exposure Yes exposure
Table IV. Associations of NBS 1 polymorphisms and lung cancer, stratified by smoking and passive smoking Variables Ex 16+1785 T>C Controls Ex 16+572 C>G Cases ORadj (95% CI)* controls Cases ORadj (95% CI)* Stratify by smoking No wt/wt + wt/var 345 68 1. 0 376 75 1. 0 var/var 28 10 2. 05 (0. 86, 4. 87) 34 13 1. 82 (0. 83, 3. 99) wt/wt + wt/var 387 331 1. 0 418 356 1. 0 var/var 43 43 1. 19 (0. 74, 1. 92) 40 44 1. 35 (0. 84, 2. 19) Yes Stratified by passive smoking No wt/wt + wt/var 80 24 1. 0 90 28 1. 0 var/var 6 1 0. 61 (0. 04, 9. 31) 7 1 0. 40 (0. 03, 5. 38) wt/wt + wt/var 265 44 1. 0 286 47 1. 0 var/var 21 9 2. 84 (1. 11, 7. 28) 26 12 2. 74 (1. 16, 6. 47) Yes
DNA Methylation and Risk of Lung Cancer
Methionine cycle THF cycle Source: Sharp 2004.
DNA Methylation and Lung Cancer Risk
P 16 hypermethylation and Lung Cancer Risk by smoking, drinking, and folate intake
MGMT hypermethylation and Lung cancer Risk by smoking, drinking, and folate intake
GSTP 1 hypermethylation and Lung cancer Risk by smoking, drinking, and folate intake
Number of methylated genes and lung cancer Risk by smoking, drinking, and folate intake
Folate intake, MTHFR C 677 T Polymorphism on Lung Cancer Risk Control N (%) SCLC N (%) Folate intake (μg/day) NSCLC Adjusted OR (95% CI) N (%) 1 Adjusted OR (95% CI) 1 >300 102 (12) 4 (6) 1. 00 56 (12) 1. 00 200 -300 265 (31) 17 (25) 1. 59 (0. 47 -5. 44) 136 (29) 1. 15 (0. 72 -1. 83) 100 -200 412 (48) 34 (51) 1. 52 (0. 45 -5. 10) 214 (46) 0. 83 (0. 52 -1. 33) ≤ 100 78 (9) 12 (18) 2. 14 (0. 52 -8. 85) 63 (13) 0. 80 (0. 43 -1. 50) P for trend 0. 3897 0. 1640 MTHFR C 677 T 2 2 CC 391 (42) 32 (49) 1. 00 211 (49) 1. 00 CT 411 (45) 26 (40) 0. 89 (0. 48 -1. 65) 171 (40) 0. 78 (0. 59 -1. 04) TT 118 (13) 7 (11) 1. 11 (0. 44 -2. 82) 49 (11) 0. 86 (0. 56 -1. 34) 1. Adjusted for age, sex, race, pack-years of smoking, total energy intake and BMI 2. Adjusted for age, sex, race, and pack-years of smoking
Folate on Lung Cancer Risk by Smoking and Drinking Control N SCLC N Adjusted OR (95% CI) NSCLC N Smoking Folate intake (μg/day) Never >200 183 2 1. 00 38 1. 00 ≤ 200 219 1 0. 67 (0. 05 -5. 81) 51 1. 07 (0. 66 -1. 74) >200 120 15 1. 00 111 1. 00 ≤ 200 185 29 1. 29 (0. 62 -2. 65) 165 0. 92 (0. 64 -1. 33) >200 64 4 1. 00 43 1. 00 ≤ 200 86 16 3. 05 (0. 88 -10. 60) 61 1. 05 (0. 61 -1. 81) Former Current 1 Adjusted OR (95% CI) Drinking Light Heavy 1 2 2 >200 303 17 1. 00 123 1. 00 ≤ 200 428 32 0. 82 (0. 39 -1. 72) 216 0. 76 (0. 55 -1. 06) >200 63 4 1. 00 69 1. 00 ≤ 200 61 14 4. 08 (0. 85 -19. 66) 61 0. 70 (0. 37 -1. 31) 1. Adjusted for age, sex, race, total energy intake, and BMI 2. Adjusted for age, sex, race, pack-years of smoking, total energy intake, and BMI
MTHFR C 677 T Polymorphism on Lung Cancer Risk by Drinking Control SCLC NSCLC Drinking MTHFR C 677 T N N Adjusted OR (95% CI) Light CC 326 25 1. 00 153 1. 00 CT/TT 450 26 0. 95 (0. 50 -1. 81) 152 0. 73 (0. 54 -0. 98) CC 65 7 1. 00 57 1. 00 CT/TT 76 7 0. 87 (0. 23 -3. 31) 58 1. 20 (0. 67 -2. 16) Heavy Adjusted for age, sex, race, and pack-years of smoking
Folate and MTHFR C 677 T Polymorphism on Lung and Head and Neck Cancer Risks among Heavy Drinkers Contro l SCLC Heavy Drinker N N >200 CC 27 0 >200 CT/TT 31 2 Adjusted OR (95% CI) 1. 00 Adjusted for age, sex, race, pack-years of smoking, total energy intake, and BMI ≤ 200 CC 28 7 ≤ 200 CT/TT 26 4 2. 67 (0. 2035. 60) NSCLC SCCHN N Adjusted OR (95% CI) 28 1. 00 27 1. 00 33 1. 12 (0. 462. 71) 29 0. 78 (0. 341. 79) 25 0. 63 (0. 241. 66) 28 1. 31 (0. 523. 28) 32 1. 02 (0. 402. 65) 32 2. 17 (0. 865. 45)
IL-10 and IFNGR 1 Polymorphisms and Lung Cancer
Modulation of Immune Response l Achieved through balance of T-helper (Th) cells via cytokine expression – Type 1: pro-inflammatory, cellular immune response l Secrete IFNG – Type 2: anti-inflammatory, humoral immune response l l Secrete IL-10 Activation of one Th-cell pathway inactivates the other
Inflammatory Anti-inflammatory
SNPs l IL-10 – -7334 T→C, AKA IL-10 -819 – -6653 A→C, AKA IL-10 -592 – TA haplotype associated with low IL-10 production l IFNGR 1 – Associated with altered immune cell function (mice) and respiratory disease (humans) – Ex 7 +189 T→G
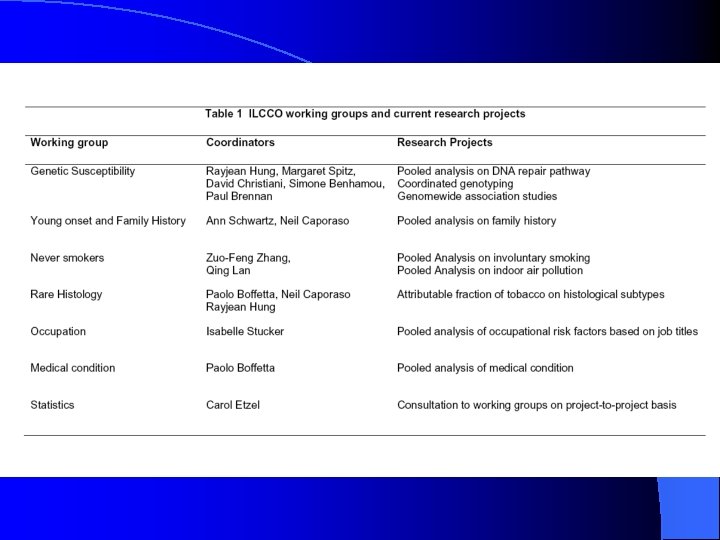
Table 1
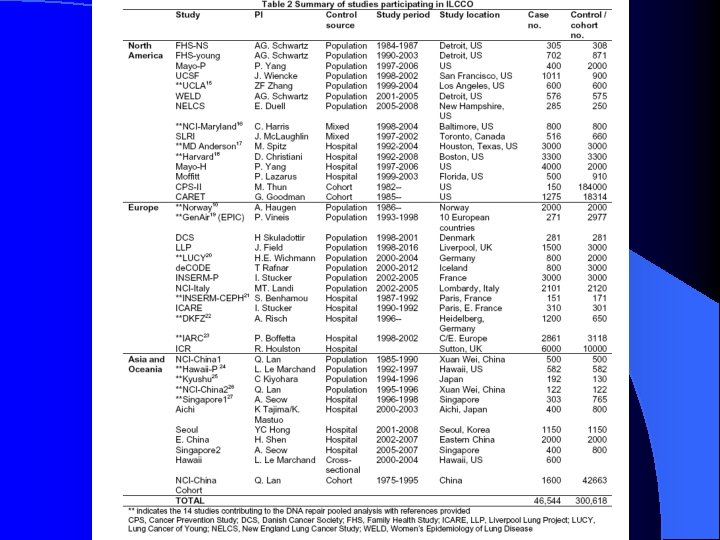
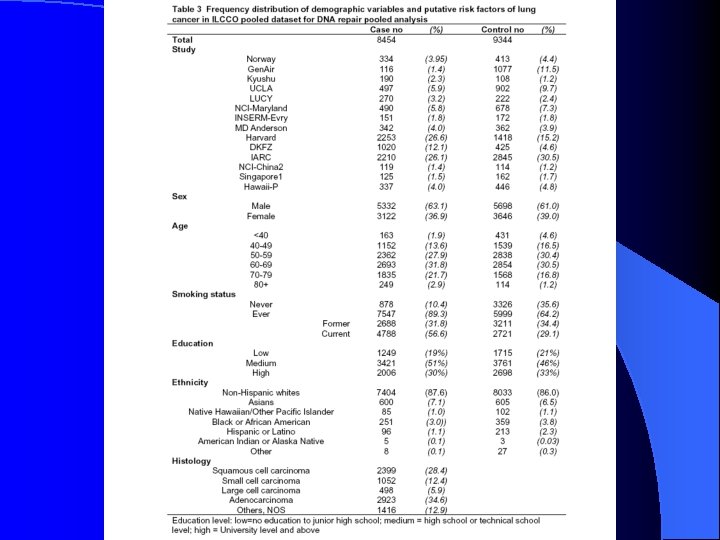
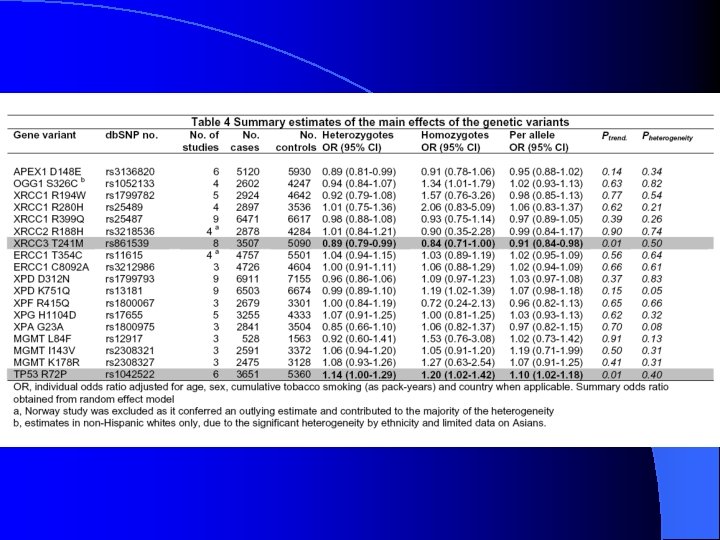
Table 2
Table 3
Table 3, cont
Table 4 Additive Interaction ORint = 23. 44 – 12. 10 – 3. 83 + 1 = 8. 51
Acknowledgments Dr. Amy Lee Dr. Jenny Papp Dr. Yan Cui Dr. Hal Morgenstern, Ms. Shu-Chun Chuang Dr. Sander Greenland Ms. Lani Park Mr. Yiren Wang Mr. Sam Oh Dr. Barbara Visscher Dr. Eric Hurwitz Dr. Donald P. Tashkin Dr. Jian Yu Rao Dr. Wei Cao Dr. Wendy Cozen Dr. Thomas M. Mack