Welcome to the 2018 Jim ODonnell Economic Forecast


")


")


- Slides: 68
Welcome to the 2018 Jim O’Donnell Economic Forecast Thank You to Our Sponsors
2018 Investment and Economic Outlook, Framed as a Look Back Over the Last 10 Years Jim O’Donnell January 2018
2017 Market Results • • Dow NASDAQ S&P 500 10 -year Treasury Oil Gold Local CDs Inflation 25. 1% 28. 2% 19. 4% 0. 0% 12% 14% 1% 1. 7%
Has “the Easy Money” Been Made? "Finally, while my observations are uncertain and should be taken with a grain of salt, what I am sure of is that valuations and markets are elevated, and the easy money in this cycle has been made. " - Howard Marks, Oaktree Capital Memo (July 2017) "The easy money has been made. "
Many Think It Has If that saying sounds familiar… it's because you've been hearing it over and over again since 2009.
2009 – in Barron’s
2011 – in Marketwatch
2013 – in Morningstar
2014 – in Barron’s (again)
2015
In hindsight, the path higher since March 9, 2009, indeed, seems like "easy money. " The S&P 500 has returned over 350% including dividends - more than quadrupling - with over 175 all-time highs along the way.
Durer’s “The Knight, Death, and the Devil, ” 1513
What does it take to succeed? • • • Brains Study Discipline Luck Temperament
But how “easy” has it really been? (This is where temperament comes in)
2009 Try to remember the psyche of the average investor in March 2009. Faced with the worst bear market (-57. 7% from the peak in October 2007) since the Great Depression, investors were being told why prices could go lower still. • Here a few of the headlines from around the bottom…
From The WSJ, March 9, 2009
From my man, Nouriel R.
From Stockmarket Cycles’” Peter Eliades
2009 • Needless to say, it was not "easy" to buy at the time, especially after what investors had just experienced in 2008. • The case for further declines seemed airtight: – earnings "drive" stock prices, – earnings were going down, not up. • Not only were they going down - they were negative the worst in history.
Look out below!
2009 • How could one buy or hold stocks amidst such weakness in earnings? • There's only one way: if they did their buying/selling based on evidence over opinion. • As it turns out, stock prices lead earnings, not the other way around. – Going back to 1871, if one had sold stocks every time earnings were lower (year over year) and only bought them back when earnings were higher, they would have lagged a “buy-and-hold” investor by 3. 7% per year. • Trading based on past earnings is not an effective investment strategy.
2010 • If your courage held out throughout 2009, there would be a new set of challenges in 2010. • The most difficult of these occurred on May 6, 2010. In what will forever be known as the "Flash Crash" (Remember it? Or Deepwater Horizon in April? ) • Panic selling and a waterfall decline ensued.
The Devil
The Flash Crash, May 6, 2010
2010 • While the market would recover more than half of its losses by the end of the trading day, it was still the worst single-day decline for the S&P 500 since April 2009. • It was also a so-called "90% downside day, " meaning that down volume accounted for over 90% of the total volume on the NYSE. • Pundits came out in force saying that the severity of the decline was a bearish omen, as they do on all such days.
2011 • If you held on throughout 2009 and 2010, the biggest test of all would come in 2011. • The S&P 500 would decline roughly 20% from its peak May through the low in October.
Death
2011
2011 • The thinking at the time? • Such a large decline could only mean one thing: – another recession was coming. And if another recession was coming, that would mean more declines for stocks. – Not to mention the Japanese tsunami in March • The world – at least as we knew it – was ending
2011
2011 "The stock market is a leading indicator of the economy, " they screamed. "Surely something must be very wrong with the economy for stocks to be down as much as they are. " • The only problem with such logic: the stock market is not the economy. While the stock market often starts going down in advance of a recession that does not mean that every time the stock market goes down there is going to be a recession. Far from it. • Before 2011, we had seen 8 bear markets (20% declines in the S&P 500) without an accompanying recession since 1933. • After 2011, this number would move up to 9.
2011
2012 • If you held your position from 2009 -2011, you were probably feeling pretty good in 2012 when the S&P 500 (total return) hit a new alltime high.
S&P 500 – to Aug. ‘ 12
The Knight
2012 • That feeling would not last very long, as pundits started saying that the new highs were pointing to a top. What evidence did they present supporting such a position? • None. • If we look at the actual data going back to 1928, we find that all-time highs are not indicative of anything other than a market that has been going up. • What tends to follow new all-time highs? More all-time highs.
2012
2012 From the first all-time high in 2012, the S&P 500 has gained an additional 100+%.
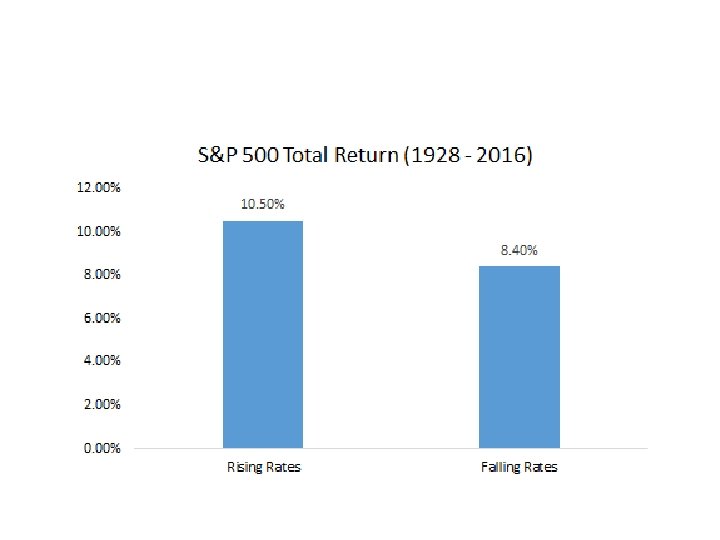
2013 • If all-time highs in 2012 didn't scare you out of your investments, "rising rates" in 2013 were said to be the "death knell" of the bull market. • The pundit's logic: if low rates were the "reason" for the incredible run-up from 20092012, then surely higher rates would have the opposite effect.
How’d that work out for the pundits?
Confounding the experts, the S&P 500 would advance 32% in 2013, its best year since 1997.
2013 • But what about those "rising rates? " • As it turns out, there is zero correlation between the S&P 500 and 10 -Year Treasury yields, meaning one cannot say anything about equity market performance based on the direction of interest rates. • Since 1928, stocks have actually fared better in years where interest rates were rising than falling.
2014 If you held on to your investments through "rising rates, " the biggest threat yet was said to come from King Dollar. During the back half of 2014, the U. S. Dollar Index experienced an unrelenting advance as markets began anticipating an end to Quantitative Easing.
2014’s ising Dollar R
2014’s ising Dollar R • Since a falling dollar and easy Fed were said to be responsible for the gains since 2009, the opposite environment was said to unwind all such gains. • The only problem with this line of thinking? -- It wasn't supported by the evidence. – The S&P 500 and the U. S. Dollar Index have a 0 correlation historically, meaning that even if you knew where the Dollar was going, it wouldn't tell you anything about where the stock market was going. • It should come as no surprise, then, that the S&P 500 would end 2014 up 13. 7%.
2015 • If you STILL held on in spite of the Dollar's epic advance, 2015’s sharp decline in Crude Oil was the next issue to confront. • The “Crash in Crude” was said to be evidence of “a weakening global economy, ” and a wave of coming bankruptcies in the energy sector • Financial havoc would befall global credit markets.
Oil’s Collapse in 2015 – Oh, No!
Oil Prices sink in 2015 • It all sounded quite ominous at the time, but do stocks really need higher oil prices? • The answer based on history is a resounding "no. " – The monthly correlation between the S&P 500 and Crude Oil is essentially 0, and the S&P 500 had experienced gains many times in the past amidst a decline in Crude Oil. It would do so once again this time around.
Oh no, Mom, 2015 held even more gloom – from rising rates • As the Fed hiked rates in December 2015 for the first time since 2006, it was the opinion of many that one should sell all of their stocks, particularly in Emerging Markets. • Needless to say, such calls were based on nothing more than conjecture, as the evidence with respect to prior rate hikes (even the most extreme hikes) pointed to further gains, not losses.
2015 – US stocks vs. Emerging Markets
2016 • If you STILLLL held onto your stocks to the end of 2015, your willpower would soon be tested yet again. • In early 2016, the S&P 500 experienced a sharp sell-off (the worst start in history, in fact), hitting new 52 -week lows in January and February. Such an occurrence was said to be extremely "bearish, " and evidence that the market was going much lower. • What did the data suggest? Quite the opposite. – Average returns following new 52 -week lows were actually positive and above average in most instances.
Historic Returns from Highs and Lows
More from early 2016 • Near the market's lows in February, another concern emerged: politics. National politics • The rise of Trump and Sanders was said to be "correlated closely with an anticipated decline in stocks. ” • Yikes!
Barron’s, Feb. 2016
Early Feb. , 2016 • Many pundits suggested that "political risk" was so high that investors would do well to sit out the year and wait for “the uncertainty" to abate. • How would such a strategy fared historically? – Not very well. – As election years have historically returned slightly higher than non-election years (9. 6% vs. 9. 5%), sitting them out would have resulted in a return 2. 5% below a simple buy-and-hold.
2016’s results • The S&P 500 would end 2016 up 12% • Once again, we find that mixing your politics with your portfolio is rarely a good idea.
2017 • If fear had not killed you yet, an outside observer might consider 2017 a breeze. 2017 provided the least volatile start to a year since 1964, and there hasn't been as much as a 3% correction the entire year. • What could possibly be wrong with that? Everything! The fear of lack of volatility can be almost as strong as the opposite. The constant barrage from pundits saying things like "the calm before the storm" and "this won't end well" started in early January, when market volatility was lower than 97% of historical readings. • What evidence is there that low volatility means stocks cannot continue higher? – None (stocks still tend to rise on average from very low volatility readings), but that did not stop the many calls saying as much.
Does volatility kill stocks’ returns?
NASDAQ in early 2017 • In February of 2017, when the Nasdaq 100 Index hit one of its most overbought levels in history, the ”We’ve hit the top" calls were out in force, comparing it to overbought levels in 1987, 1998, 2000 and 2007. • What evidence was there proving an overbought market couldn't go higher? – None.
Ahh! The NASDAQ is Overbought
The NASDAQ in 2017 • That's indeed what we saw in the following months, as the markets continued higher and the Volatility Index (VIX) hit new all-time lows. • As it turns out, overbought conditions can be bullish and low volatility conditions aren't necessarily bearish. • If all of this sounds confusing, good. It should be. No one said investing was easy. • Wait, that's not true - many are saying just that. The gains from 2009 through today are all deemed to be "easy money" in hindsight. • But those who lived through it know otherwise. The 21 corrections since March 2009 all seemed like the end of the world at the time. Each and every one was difficult for an investor to hold on through.
The Last Decade’s Corrections
Summary and a Lesson • Noise: You have to ignore it. • The only way you had any chance of holding your gains was to tune out the noise (extreme forecasts, predictions, calls, prophesies, targets, and myths), have a plan, and stick with that plan when you were punched in the face. Nobody likes getting punched in the face, but investors have to take that punch and more if they are going to succeed. • Why is ignoring noise so important? Because it's not thinking that helps you invest but sitting strong and firm. It’s temperament. Sitting through big market advances and allowing your investments to compound is hard stuff, but it's infinitely harder when you're being compelled to take action based on falsehoods.
Finally • Imagine you were allowed one investment choice, a choice you had to stick to for the next ten years, through thick and thin. You can put all your investable assets in the S&P 500, a 10 -year Treasury Note, gold, oil, housing, or cash. Pick only one. • Which asset would you have picked over the last 10 years? How about for the next 10 years? • On the basis of total return, over the last ten years, stocks did the best. The S&P 500 generated – Oct. 9, 2007 to Oct 8, 2017 - a total return (capital gains plus reinvested dividends) of 7. 2% per year, essentially doubling in value in ten years.
Finally, Finally • Gold did well, but lagged stocks, increasing 5. 7% per year. A 10 -year Treasury Note purchased on Oct 9, 2007 would have generated a yield of 4. 7%. Oil was a laggard, down 4. 3% per year. Home prices increased about 1% per year, on average. And "cash" averaged 0. 4%, both trailing the 1. 6% average rise in the consumer price index. • You might have slept better by investing in 4. 7% Treasury Notes. Certainly, the volatility of stocks, and the cascade of financial news headlines predicting doom and gloom over the past ten years, wouldn't have bothered you as much. But you'd have less in your retirement portfolio today than if you had kept the faith and stayed in stocks. And if you wanted to reinvest in a Treasury Note again, for the next ten years, now your rate would be roughly 2. 3% a year.
Good Knight to you all.
Thank You for Attending! Thank You to Our Sponsors