
Monthly and seasonal forecasts at ECMWF operational plans
- Slides: 38
Monthly and seasonal forecasts at ECMWF: operational plans and prospects from current research Franco Molteni with M. Balmaseda, L. Ferranti, K. Mogensen, T. Palmer, T. Stockdale, F. Vitart European Centre for Medium-Range Weather Forecasts, Reading, U. K. Monthly and seasonal fc. at ECMWF: plans and prospects – NCEP, 16 Feb. 2010 1
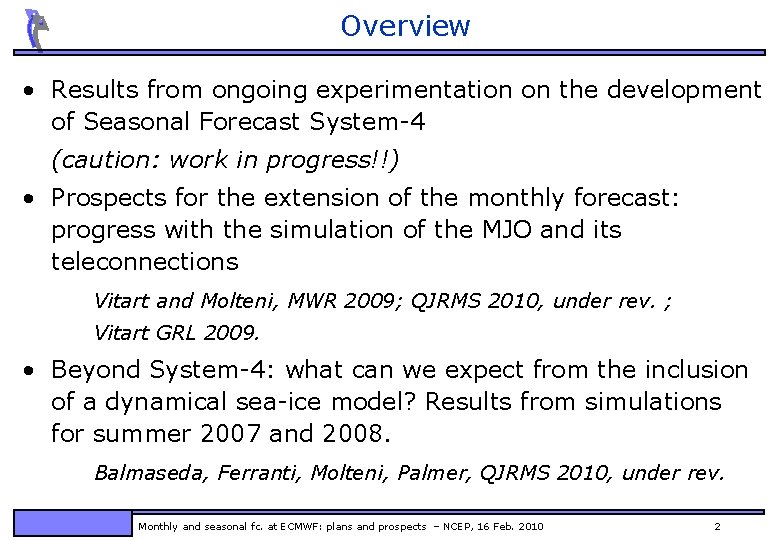
Overview • Results from ongoing experimentation on the development of Seasonal Forecast System-4 (caution: work in progress!!) • Prospects for the extension of the monthly forecast: progress with the simulation of the MJO and its teleconnections Vitart and Molteni, MWR 2009; QJRMS 2010, under rev. ; Vitart GRL 2009. • Beyond System-4: what can we expect from the inclusion of a dynamical sea-ice model? Results from simulations for summer 2007 and 2008. Balmaseda, Ferranti, Molteni, Palmer, QJRMS 2010, under rev. Monthly and seasonal fc. at ECMWF: plans and prospects – NCEP, 16 Feb. 2010 2
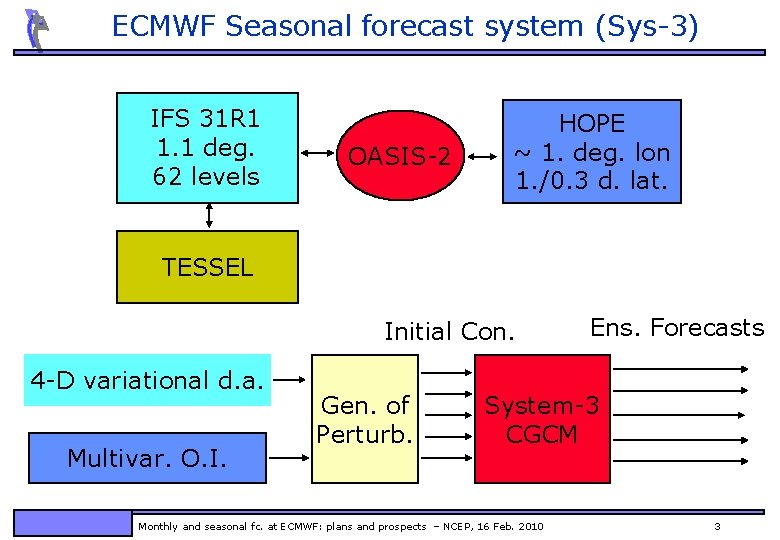
ECMWF Seasonal forecast system (Sys-3) IFS 31 R 1 1. 1 deg. 62 levels OASIS-2 HOPE ~ 1. deg. lon 1. /0. 3 d. lat. TESSEL Initial Con. 4 -D variational d. a. Multivar. O. I. Gen. of Perturb. Ens. Forecasts System-3 CGCM Monthly and seasonal fc. at ECMWF: plans and prospects – NCEP, 16 Feb. 2010 3
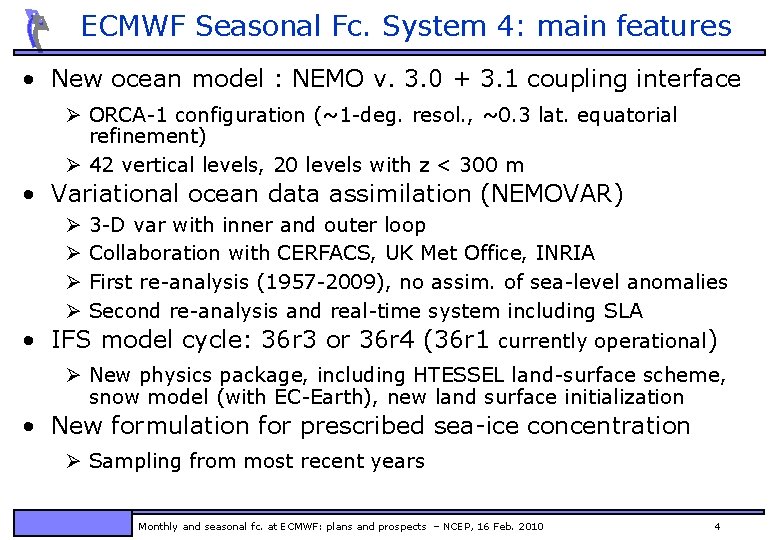
ECMWF Seasonal Fc. System 4: main features • New ocean model : NEMO v. 3. 0 + 3. 1 coupling interface Ø ORCA-1 configuration (~1 -deg. resol. , ~0. 3 lat. equatorial refinement) Ø 42 vertical levels, 20 levels with z < 300 m • Variational ocean data assimilation (NEMOVAR) Ø Ø 3 -D var with inner and outer loop Collaboration with CERFACS, UK Met Office, INRIA First re-analysis (1957 -2009), no assim. of sea-level anomalies Second re-analysis and real-time system including SLA • IFS model cycle: 36 r 3 or 36 r 4 (36 r 1 currently operational) Ø New physics package, including HTESSEL land-surface scheme, snow model (with EC-Earth), new land surface initialization • New formulation for prescribed sea-ice concentration Ø Sampling from most recent years Monthly and seasonal fc. at ECMWF: plans and prospects – NCEP, 16 Feb. 2010 4
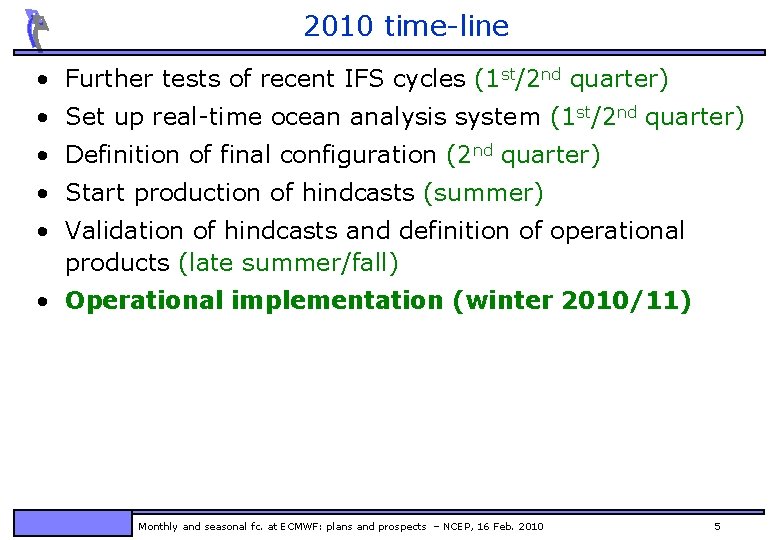
2010 time-line • Further tests of recent IFS cycles (1 st/2 nd quarter) • Set up real-time ocean analysis system (1 st/2 nd quarter) • Definition of final configuration (2 nd quarter) • Start production of hindcasts (summer) • Validation of hindcasts and definition of operational products (late summer/fall) • Operational implementation (winter 2010/11) Monthly and seasonal fc. at ECMWF: plans and prospects – NCEP, 16 Feb. 2010 5
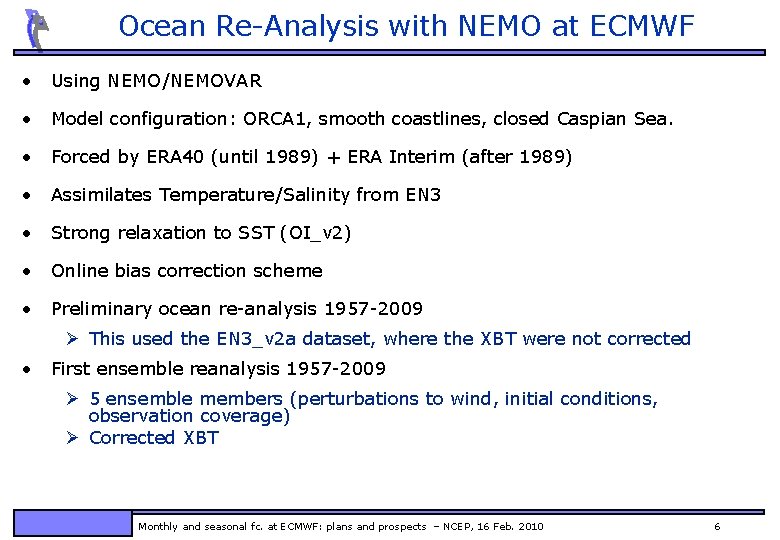
Ocean Re-Analysis with NEMO at ECMWF • Using NEMO/NEMOVAR • Model configuration: ORCA 1, smooth coastlines, closed Caspian Sea. • Forced by ERA 40 (until 1989) + ERA Interim (after 1989) • Assimilates Temperature/Salinity from EN 3 • Strong relaxation to SST (OI_v 2) • Online bias correction scheme • Preliminary ocean re-analysis 1957 -2009 Ø This used the EN 3_v 2 a dataset, where the XBT were not corrected • First ensemble reanalysis 1957 -2009 Ø 5 ensemble members (perturbations to wind, initial conditions, observation coverage) Ø Corrected XBT Monthly and seasonal fc. at ECMWF: plans and prospects – NCEP, 16 Feb. 2010 6
Ocean Re-Analysis with NEMO Monthly and seasonal fc. at ECMWF: plans and prospects – NCEP, 16 Feb. 2010 7
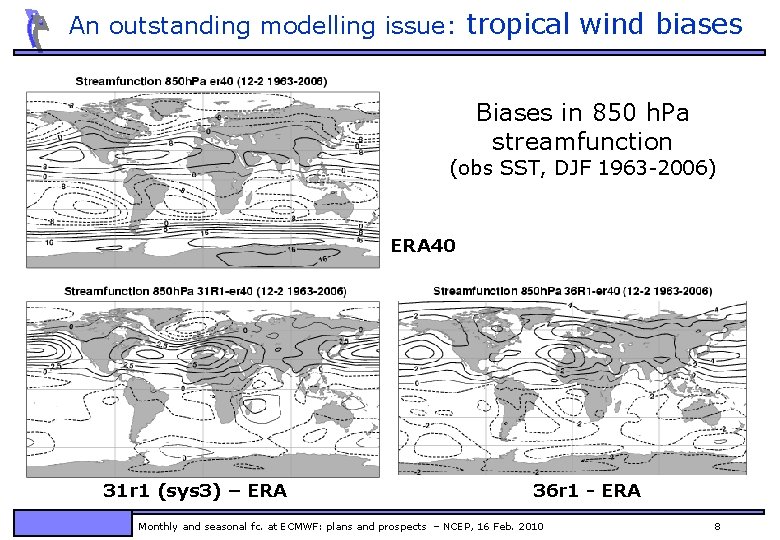
An outstanding modelling issue: tropical wind biases Biases in 850 h. Pa streamfunction (obs SST, DJF 1963 -2006) ERA 40 31 r 1 (sys 3) – ERA 36 r 1 - ERA Monthly and seasonal fc. at ECMWF: plans and prospects – NCEP, 16 Feb. 2010 8
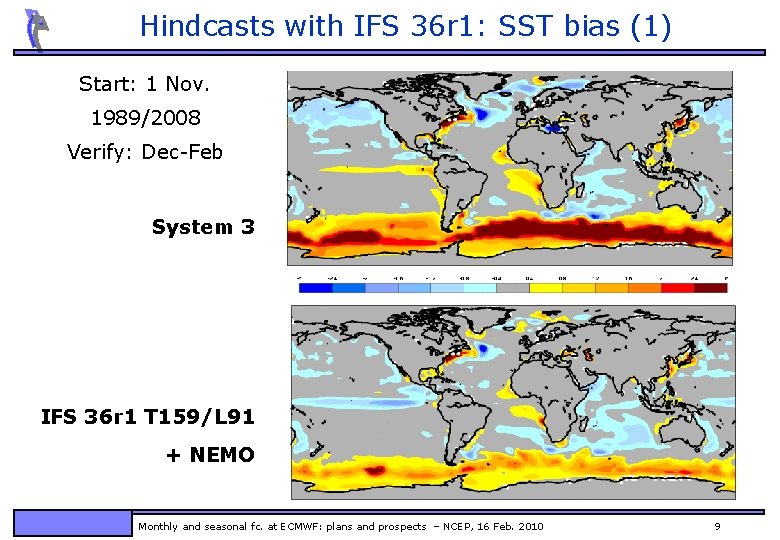
Hindcasts with IFS 36 r 1: SST bias (1) Start: 1 Nov. 1989/2008 Verify: Dec-Feb System 3 IFS 36 r 1 T 159/L 91 + NEMO Monthly and seasonal fc. at ECMWF: plans and prospects – NCEP, 16 Feb. 2010 9
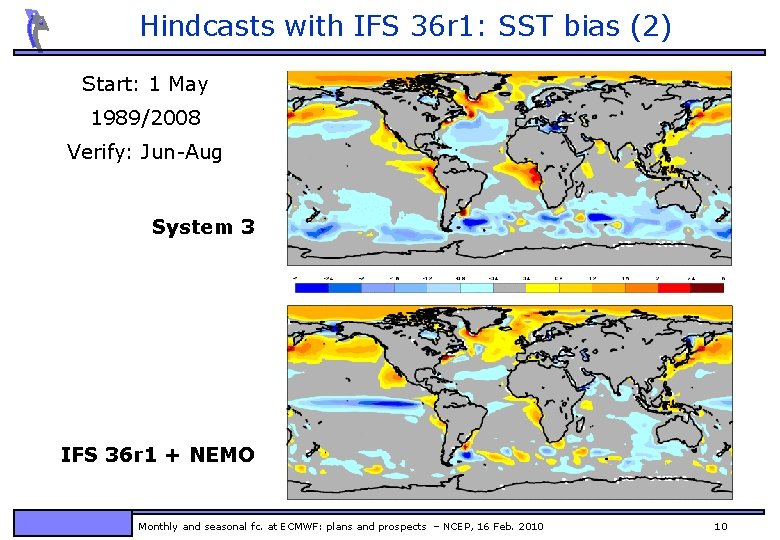
Hindcasts with IFS 36 r 1: SST bias (2) Start: 1 May 1989/2008 Verify: Jun-Aug System 3 IFS 36 r 1 + NEMO Monthly and seasonal fc. at ECMWF: plans and prospects – NCEP, 16 Feb. 2010 10
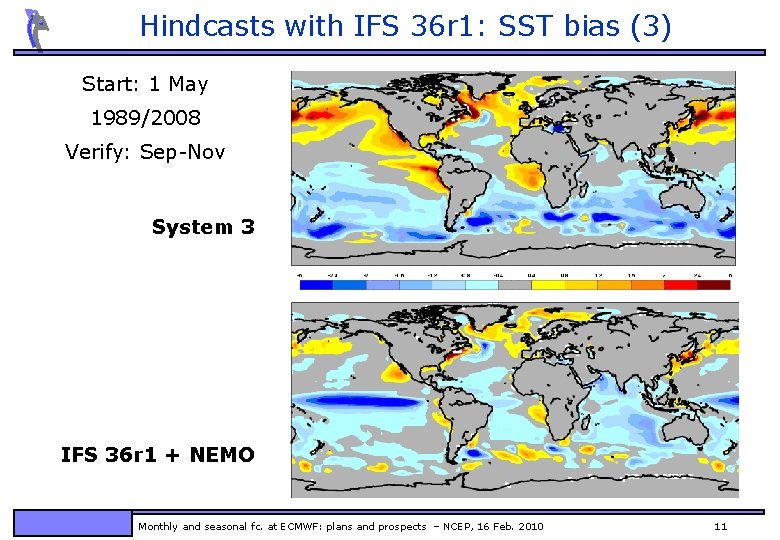
Hindcasts with IFS 36 r 1: SST bias (3) Start: 1 May 1989/2008 Verify: Sep-Nov System 3 IFS 36 r 1 + NEMO Monthly and seasonal fc. at ECMWF: plans and prospects – NCEP, 16 Feb. 2010 11
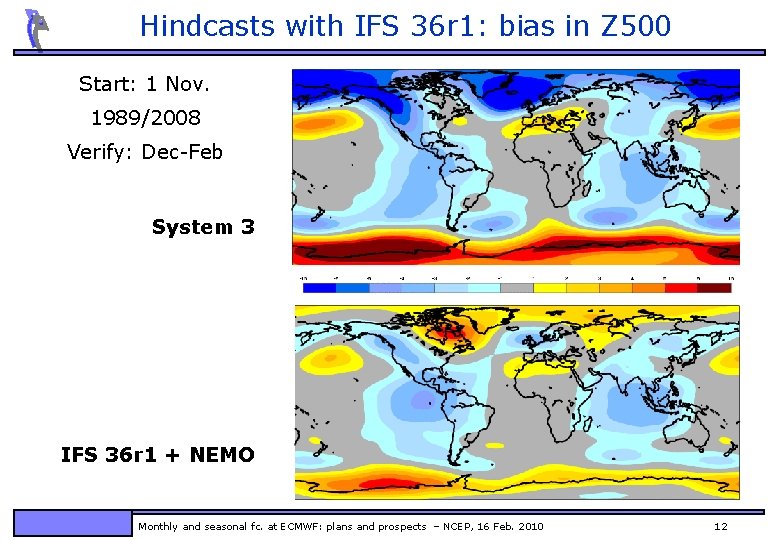
Hindcasts with IFS 36 r 1: bias in Z 500 Start: 1 Nov. 1989/2008 Verify: Dec-Feb System 3 IFS 36 r 1 + NEMO Monthly and seasonal fc. at ECMWF: plans and prospects – NCEP, 16 Feb. 2010 12
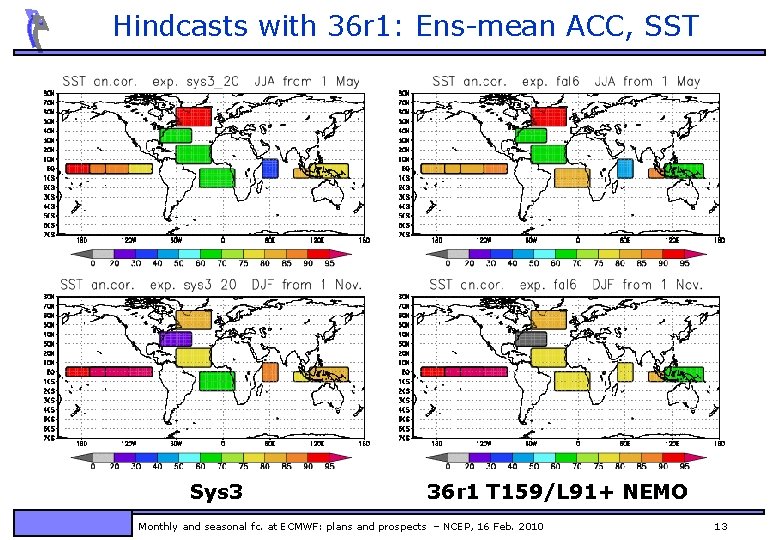
Hindcasts with 36 r 1: Ens-mean ACC, SST Sys 3 36 r 1 T 159/L 91+ NEMO Monthly and seasonal fc. at ECMWF: plans and prospects – NCEP, 16 Feb. 2010 13
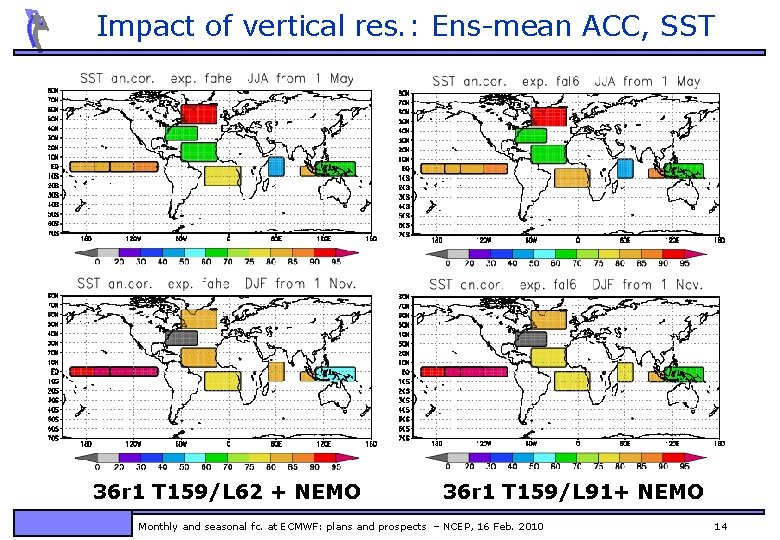
Impact of vertical res. : Ens-mean ACC, SST 36 r 1 T 159/L 62 + NEMO 36 r 1 T 159/L 91+ NEMO Monthly and seasonal fc. at ECMWF: plans and prospects – NCEP, 16 Feb. 2010 14
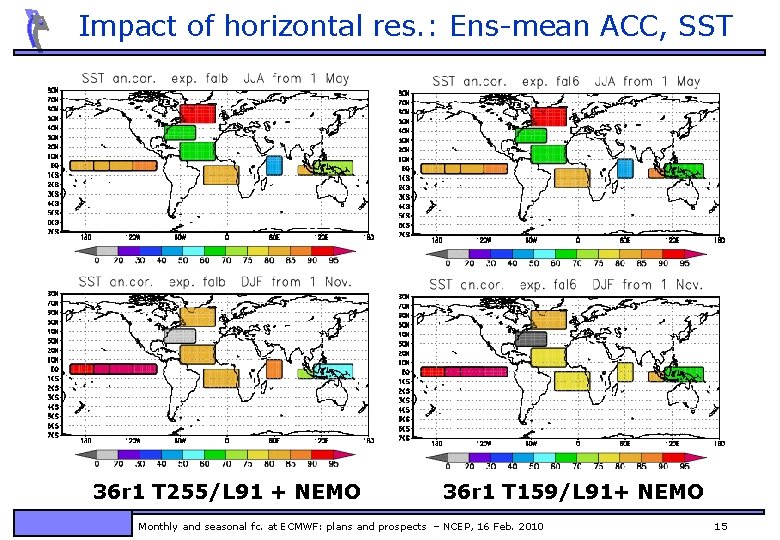
Impact of horizontal res. : Ens-mean ACC, SST 36 r 1 T 255/L 91 + NEMO 36 r 1 T 159/L 91+ NEMO Monthly and seasonal fc. at ECMWF: plans and prospects – NCEP, 16 Feb. 2010 15
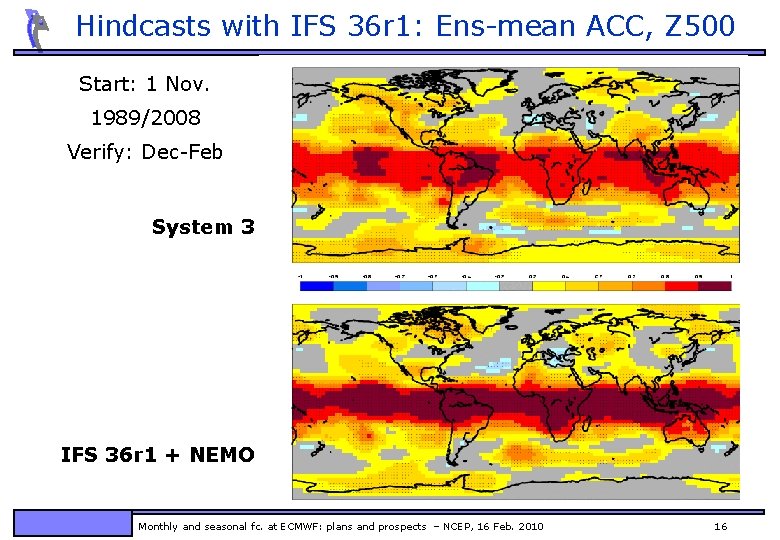
Hindcasts with IFS 36 r 1: Ens-mean ACC, Z 500 Start: 1 Nov. 1989/2008 Verify: Dec-Feb System 3 IFS 36 r 1 + NEMO Monthly and seasonal fc. at ECMWF: plans and prospects – NCEP, 16 Feb. 2010 16
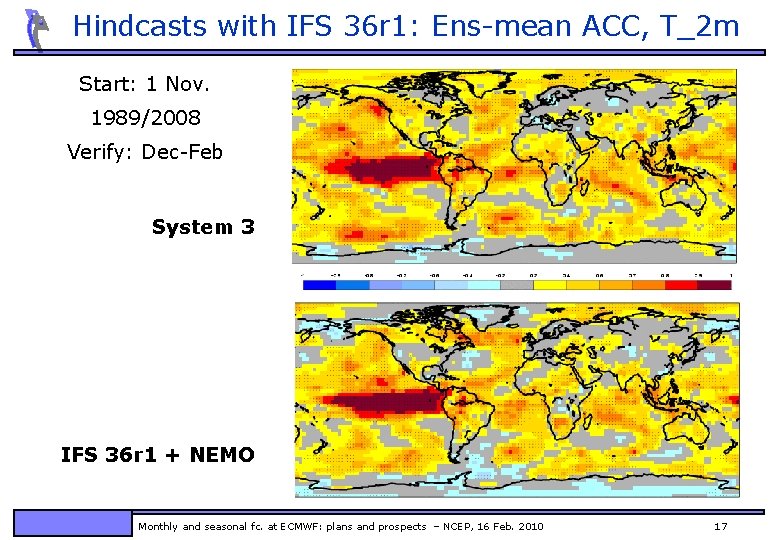
Hindcasts with IFS 36 r 1: Ens-mean ACC, T_2 m Start: 1 Nov. 1989/2008 Verify: Dec-Feb System 3 IFS 36 r 1 + NEMO Monthly and seasonal fc. at ECMWF: plans and prospects – NCEP, 16 Feb. 2010 17
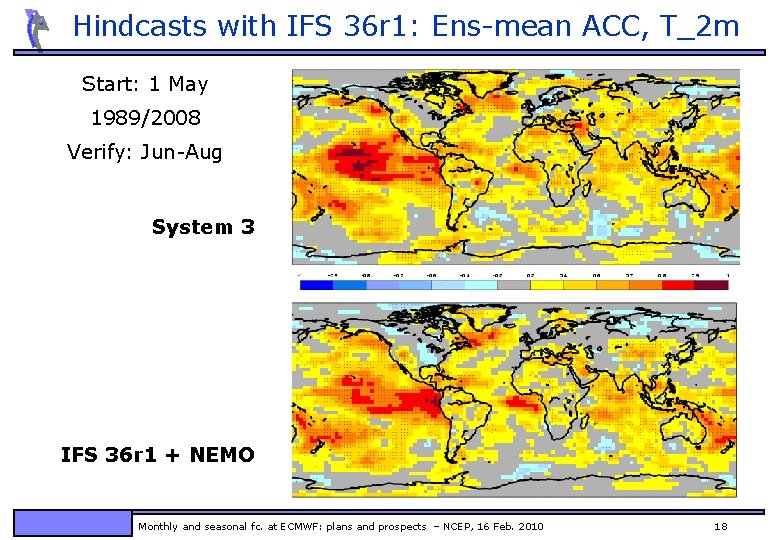
Hindcasts with IFS 36 r 1: Ens-mean ACC, T_2 m Start: 1 May 1989/2008 Verify: Jun-Aug System 3 IFS 36 r 1 + NEMO Monthly and seasonal fc. at ECMWF: plans and prospects – NCEP, 16 Feb. 2010 18
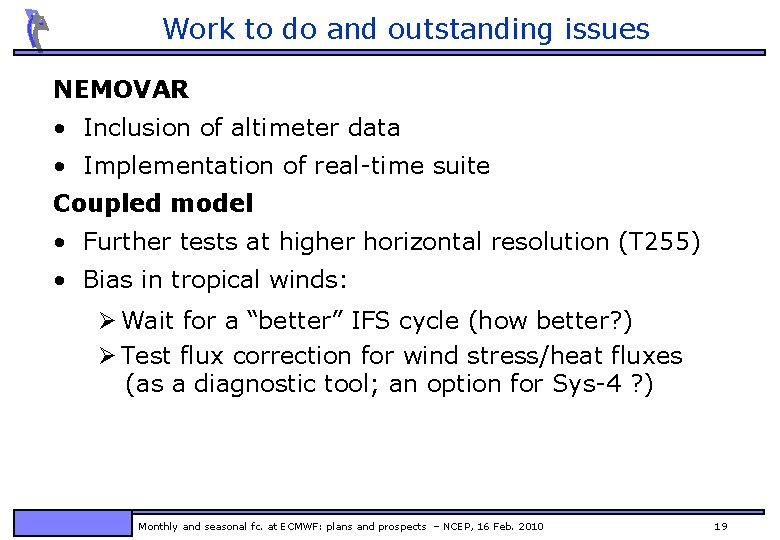
Work to do and outstanding issues NEMOVAR • Inclusion of altimeter data • Implementation of real-time suite Coupled model • Further tests at higher horizontal resolution (T 255) • Bias in tropical winds: Ø Wait for a “better” IFS cycle (how better? ) Ø Test flux correction for wind stress/heat fluxes (as a diagnostic tool; an option for Sys-4 ? ) Monthly and seasonal fc. at ECMWF: plans and prospects – NCEP, 16 Feb. 2010 19
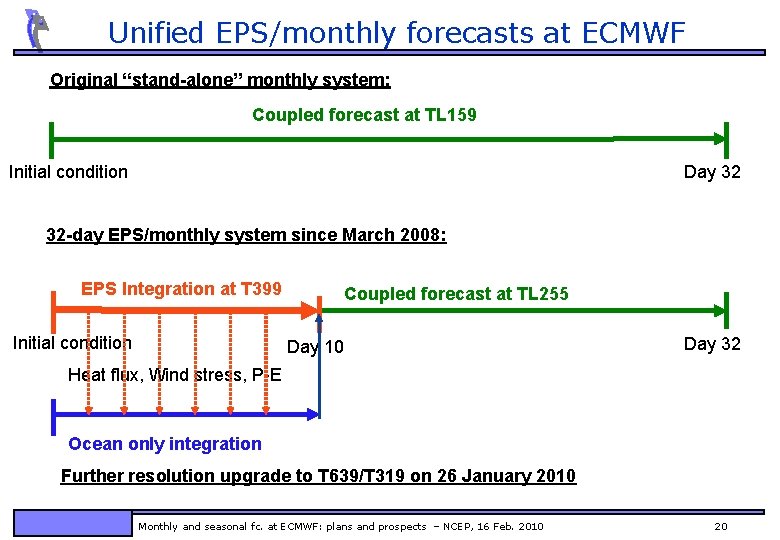
Unified EPS/monthly forecasts at ECMWF Original “stand-alone” monthly system: Coupled forecast at TL 159 Initial condition Day 32 32 -day EPS/monthly system since March 2008: EPS Integration at T 399 Initial condition Coupled forecast at TL 255 Day 10 Day 32 Heat flux, Wind stress, P-E Ocean only integration Further resolution upgrade to T 639/T 319 on 26 January 2010 Monthly and seasonal fc. at ECMWF: plans and prospects – NCEP, 16 Feb. 2010 20
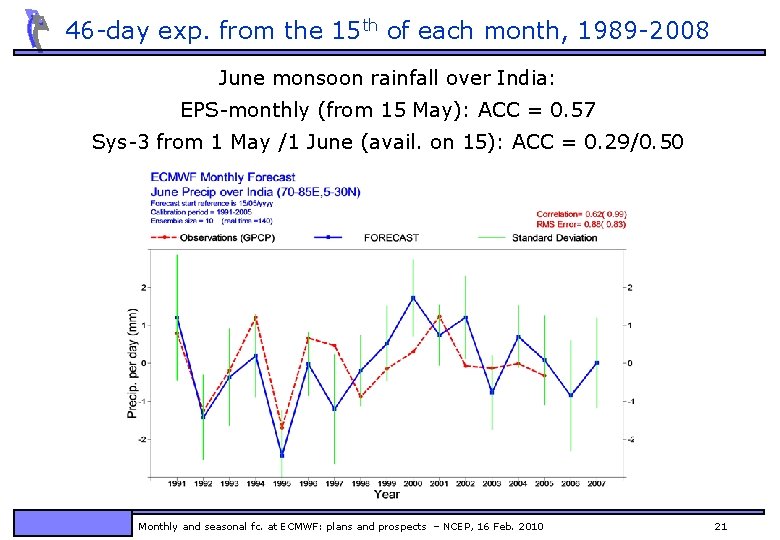
46 -day exp. from the 15 th of each month, 1989 -2008 June monsoon rainfall over India: EPS-monthly (from 15 May): ACC = 0. 57 Sys-3 from 1 May /1 June (avail. on 15): ACC = 0. 29/0. 50 Monthly and seasonal fc. at ECMWF: plans and prospects – NCEP, 16 Feb. 2010 21
MJO impact on JJA precipitation in 46 -day EPS Wheeler. Hendon 2004 EPS ERA-In Phase 2 -3 Phase 4 -5 Phase 6 -7 Phase 8 -1 Monthly and seasonal fc. at ECMWF: plans and prospects – NCEP, 16 Feb. 2010 22
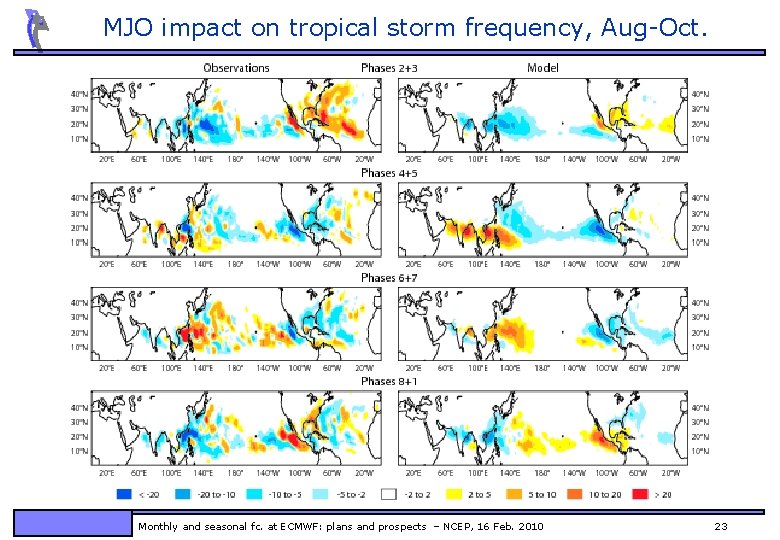
MJO impact on tropical storm frequency, Aug-Oct. EPS ERA-In Monthly and seasonal fc. at ECMWF: plans and prospects – NCEP, 16 Feb. 2010 23
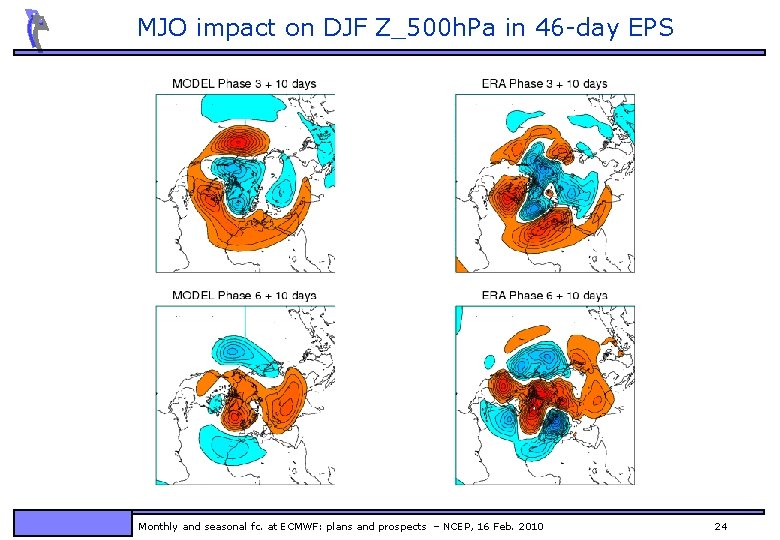
MJO impact on DJF Z_500 h. Pa in 46 -day EPS Monthly and seasonal fc. at ECMWF: plans and prospects – NCEP, 16 Feb. 2010 24
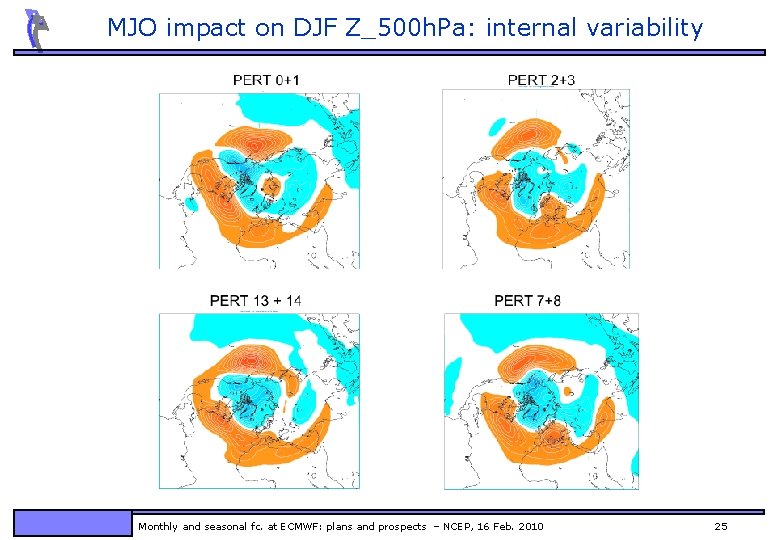
MJO impact on DJF Z_500 h. Pa: internal variability Monthly and seasonal fc. at ECMWF: plans and prospects – NCEP, 16 Feb. 2010 25
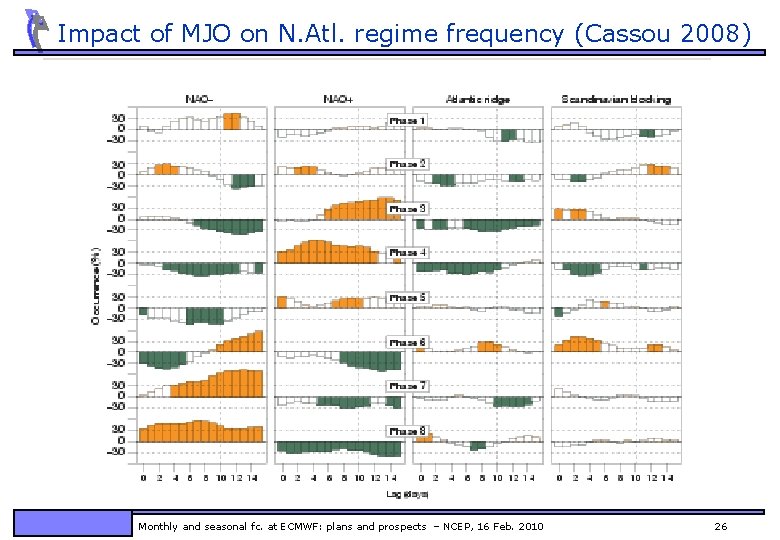
Impact of MJO on N. Atl. regime frequency (Cassou 2008) Monthly and seasonal fc. at ECMWF: plans and prospects – NCEP, 16 Feb. 2010 26
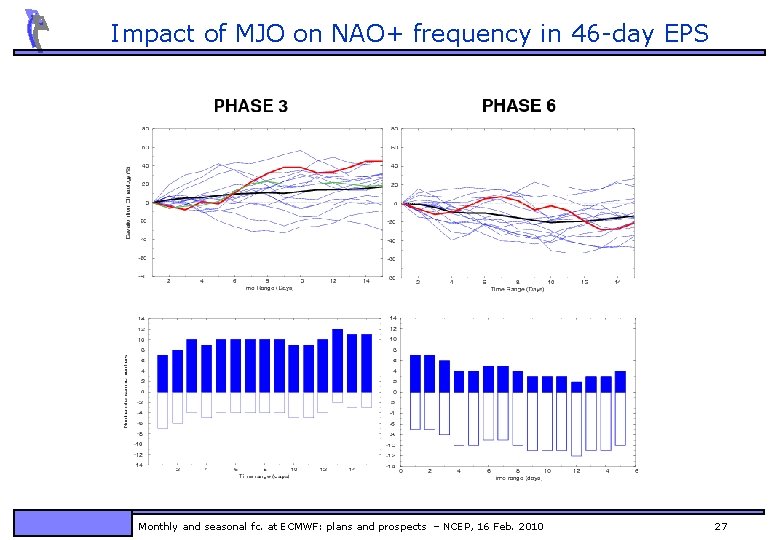
Impact of MJO on NAO+ frequency in 46 -day EPS Monthly and seasonal fc. at ECMWF: plans and prospects – NCEP, 16 Feb. 2010 27
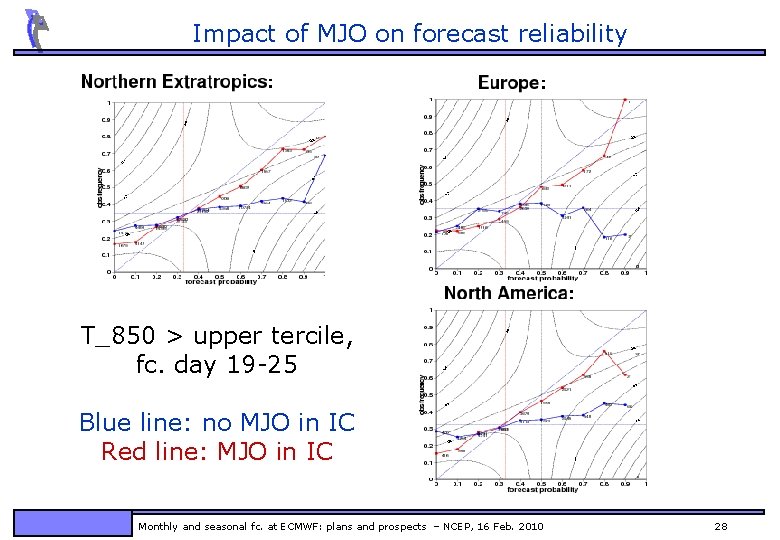
Impact of MJO on forecast reliability T_850 > upper tercile, fc. day 19 -25 Blue line: no MJO in IC Red line: MJO in IC Monthly and seasonal fc. at ECMWF: plans and prospects – NCEP, 16 Feb. 2010 28
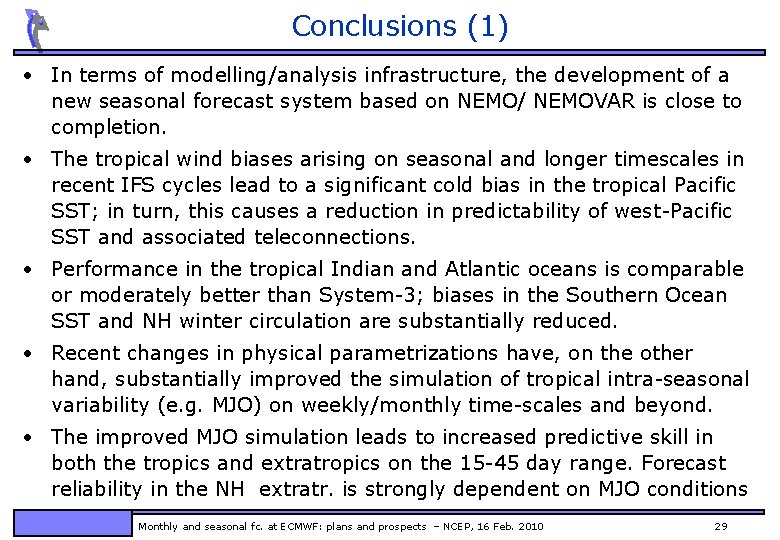
Conclusions (1) • In terms of modelling/analysis infrastructure, the development of a new seasonal forecast system based on NEMO/ NEMOVAR is close to completion. • The tropical wind biases arising on seasonal and longer timescales in recent IFS cycles lead to a significant cold bias in the tropical Pacific SST; in turn, this causes a reduction in predictability of west-Pacific SST and associated teleconnections. • Performance in the tropical Indian and Atlantic oceans is comparable or moderately better than System-3; biases in the Southern Ocean SST and NH winter circulation are substantially reduced. • Recent changes in physical parametrizations have, on the other hand, substantially improved the simulation of tropical intra-seasonal variability (e. g. MJO) on weekly/monthly time-scales and beyond. • The improved MJO simulation leads to increased predictive skill in both the tropics and extratropics on the 15 -45 day range. Forecast reliability in the NH extratr. is strongly dependent on MJO conditions Monthly and seasonal fc. at ECMWF: plans and prospects – NCEP, 16 Feb. 2010 29
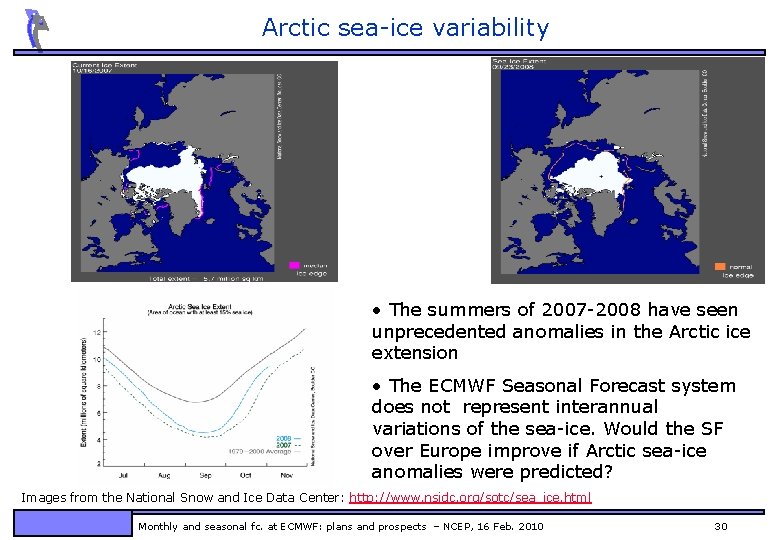
Arctic sea-ice variability • The summers of 2007 -2008 have seen unprecedented anomalies in the Arctic ice extension • The ECMWF Seasonal Forecast system does not represent interannual variations of the sea-ice. Would the SF over Europe improve if Arctic sea-ice anomalies were predicted? Images from the National Snow and Ice Data Center: http: //www. nsidc. org/sotc/sea_ice. html Monthly and seasonal fc. at ECMWF: plans and prospects – NCEP, 16 Feb. 2010 30
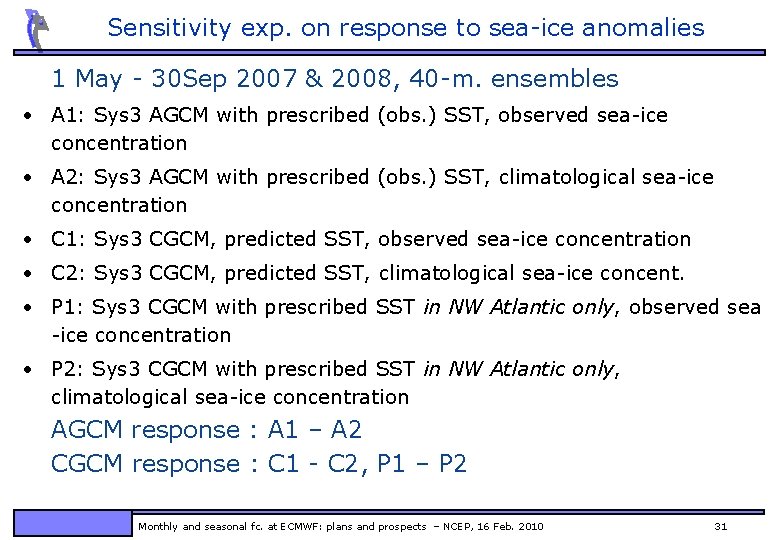
Sensitivity exp. on response to sea-ice anomalies 1 May - 30 Sep 2007 & 2008, 40 -m. ensembles • A 1: Sys 3 AGCM with prescribed (obs. ) SST, observed sea-ice concentration • A 2: Sys 3 AGCM with prescribed (obs. ) SST, climatological sea-ice concentration • C 1: Sys 3 CGCM, predicted SST, observed sea-ice concentration • C 2: Sys 3 CGCM, predicted SST, climatological sea-ice concent. • P 1: Sys 3 CGCM with prescribed SST in NW Atlantic only, observed sea -ice concentration • P 2: Sys 3 CGCM with prescribed SST in NW Atlantic only, climatological sea-ice concentration AGCM response : A 1 – A 2 CGCM response : C 1 - C 2, P 1 – P 2 Monthly and seasonal fc. at ECMWF: plans and prospects – NCEP, 16 Feb. 2010 31
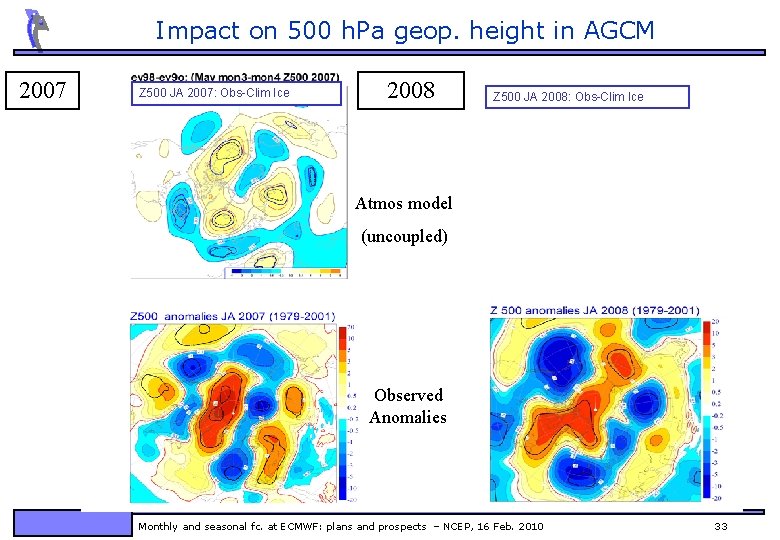
Impact on 500 h. Pa geop. height in AGCM 2007 Z 500 JA 2007: Obs-Clim Ice 2008 Z 500 JA 2008: Obs-Clim Ice Atmos model (uncoupled) Observed Anomalies Monthly and seasonal fc. at ECMWF: plans and prospects – NCEP, 16 Feb. 2010 33
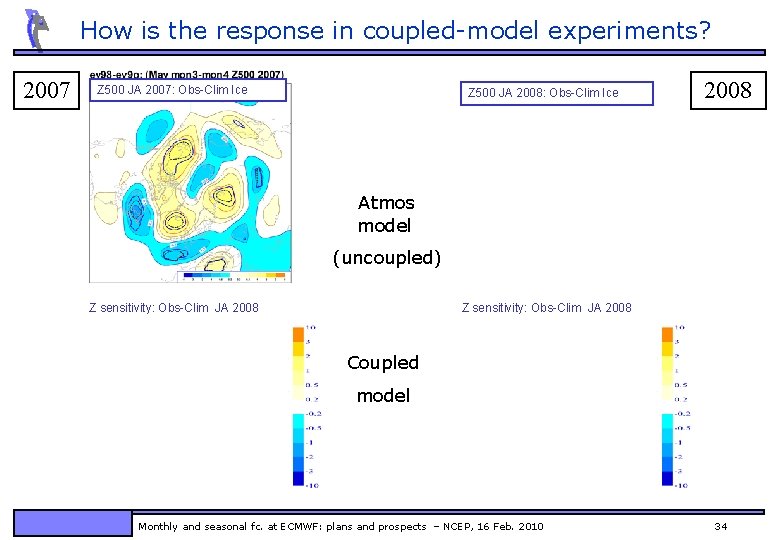
How is the response in coupled-model experiments? 2007 Z 500 JA 2007: Obs-Clim Ice Z 500 JA 2008: Obs-Clim Ice 2008 Atmos model (uncoupled) Z sensitivity: Obs-Clim JA 2008 Coupled model Exp B: Coupled integrations with climatological and Observed ice extension. 2007 & 2008. Monthly and seasonal fc. at ECMWF: plans and prospects – NCEP, 16 Feb. 2010 34
Impact of SST bias in the Gulf Stream region on Z_500 Differences in mean 500 h. Pa height in July-August Z 500: Uncoupled - Coupled Z 500: Partial Coupling - Coupled SST bias in the Gulf Stream region may explain a large part of the coupled-model systematic errors over the North Atlantic Sector Monthly and seasonal fc. at ECMWF: plans and prospects – NCEP, 16 Feb. 2010 35
Impact on the response to the 2008 Arctic ice anomaly Z sensitivity: UNCOUPLED Z sensitivity: Prescribed Gulf Stream Z sensitivity: COUPLED Correcting the SST bias in the Gulf Stream region changes the atmospheric response to the prescribed sea-ice anomaly Monthly and seasonal fc. at ECMWF: plans and prospects – NCEP, 16 Feb. 2010 36
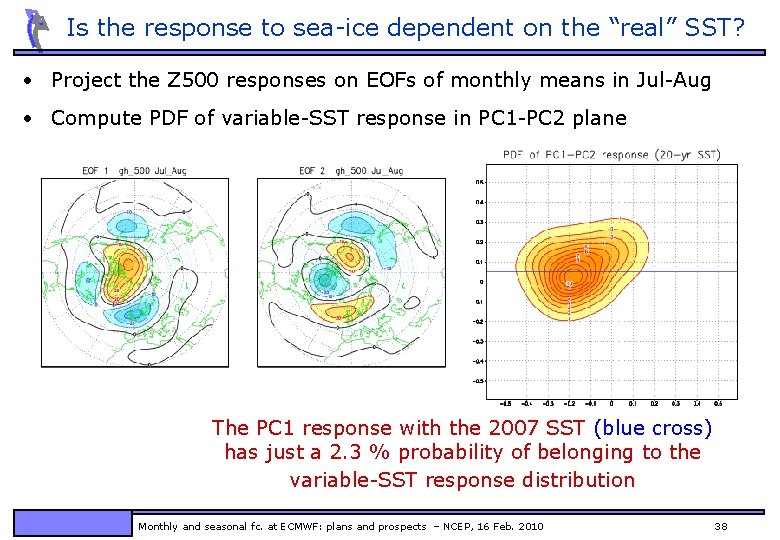
Is the response to sea-ice dependent on the “real” SST? • Variable SST ensembles with AGCM: Ø 5 member ensembles, initialized in May 1987 -2006 (20 years) Ø Performed with 2007 and climatological sea-ice concentration Ø 1000 40 -member sub-ensembles with variable SST generated by randomly selecting 2 out of 5 ensemble members for each year Ø 1000 40 -member-mean response to 2007 sea-ice anomaly with variable SST are obtained • The 40 -member response with 2007 SST can be compared with the population of 1000 responses with variable SST: does it belong to the same population? Ø Yes: the SST of the same year (2007) does not induce a statistically significant difference in the response to sea-ice Ø No: the response to sea-ice anomaly is significantly dependent on the SST of the same year Monthly and seasonal fc. at ECMWF: plans and prospects – NCEP, 16 Feb. 2010 37
Is the response to sea-ice dependent on the “real” SST? • Project the Z 500 responses on EOFs of monthly means in Jul-Aug • Compute PDF of variable-SST response in PC 1 -PC 2 plane The PC 1 response with the 2007 SST (blue cross) has just a 2. 3 % probability of belonging to the variable-SST response distribution Monthly and seasonal fc. at ECMWF: plans and prospects – NCEP, 16 Feb. 2010 38
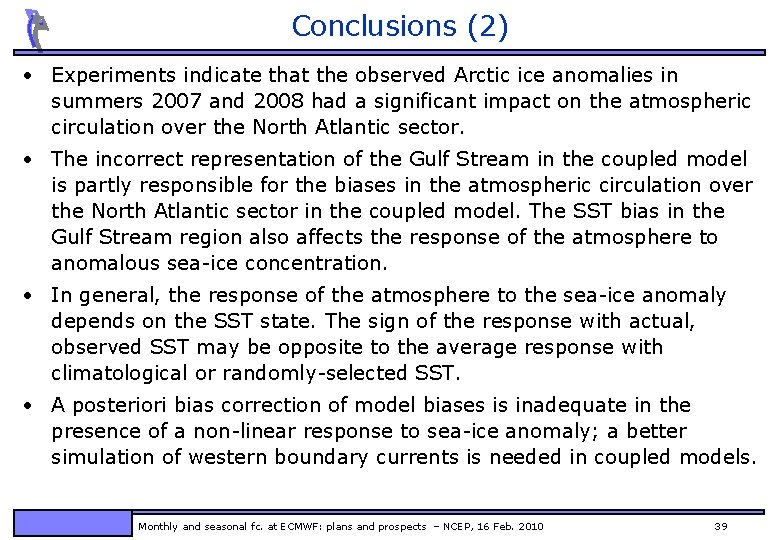
Conclusions (2) • Experiments indicate that the observed Arctic ice anomalies in summers 2007 and 2008 had a significant impact on the atmospheric circulation over the North Atlantic sector. • The incorrect representation of the Gulf Stream in the coupled model is partly responsible for the biases in the atmospheric circulation over the North Atlantic sector in the coupled model. The SST bias in the Gulf Stream region also affects the response of the atmosphere to anomalous sea-ice concentration. • In general, the response of the atmosphere to the sea-ice anomaly depends on the SST state. The sign of the response with actual, observed SST may be opposite to the average response with climatological or randomly-selected SST. • A posteriori bias correction of model biases is inadequate in the presence of a non-linear response to sea-ice anomaly; a better simulation of western boundary currents is needed in coupled models. Monthly and seasonal fc. at ECMWF: plans and prospects – NCEP, 16 Feb. 2010 39