FORECAST SALES PERAMALAN PENJUALAN Forecast Penjualan adalah proyeksi
![FORECAST SALES PERAMALAN PENJUALAN FORECAST SALES PERAMALAN PENJUALAN](https://slidetodoc.com/presentation_image_h/26a540e681f669825f5853d609f1a41e/image-1.jpg)
![Forecast Penjualan adalah proyeksi teknis dari pada permintaan langganan potensil untuk suatu waktu Forecast Penjualan adalah proyeksi teknis dari pada permintaan langganan potensil untuk suatu waktu](https://slidetodoc.com/presentation_image_h/26a540e681f669825f5853d609f1a41e/image-2.jpg)
![Forecast penjualan menentukan keputusan : - kebijakan rencana produksi - Kebijakan persediaan barang Forecast penjualan menentukan keputusan : - kebijakan rencana produksi - Kebijakan persediaan barang](https://slidetodoc.com/presentation_image_h/26a540e681f669825f5853d609f1a41e/image-3.jpg)
![Teknik-Teknik dalam Forecast sales 1. 2. 3. Judgement method Metode statistika Metode khusus Teknik-Teknik dalam Forecast sales 1. 2. 3. Judgement method Metode statistika Metode khusus](https://slidetodoc.com/presentation_image_h/26a540e681f669825f5853d609f1a41e/image-4.jpg)
![Judgement method • • 1. 2. 3. 4. Digunakan untuk menyusun forecast penjualan maupun Judgement method • • 1. 2. 3. 4. Digunakan untuk menyusun forecast penjualan maupun](https://slidetodoc.com/presentation_image_h/26a540e681f669825f5853d609f1a41e/image-5.jpg)
![Metode statistika Analisis Trend • a. Free hand method (trend bebas) sangat subjektif dan Metode statistika Analisis Trend • a. Free hand method (trend bebas) sangat subjektif dan](https://slidetodoc.com/presentation_image_h/26a540e681f669825f5853d609f1a41e/image-6.jpg)
![Free hand 170 150 130 0 Free hand 170 150 130 0](https://slidetodoc.com/presentation_image_h/26a540e681f669825f5853d609f1a41e/image-7.jpg)
![Trend moment Rumus : Y = a + bx ∑ Yi = n. a Trend moment Rumus : Y = a + bx ∑ Yi = n. a](https://slidetodoc.com/presentation_image_h/26a540e681f669825f5853d609f1a41e/image-8.jpg)
![contoh Tahun (x) Penjualan (Y) 2014 130 2015 145 2016 150 2017 165 2018 contoh Tahun (x) Penjualan (Y) 2014 130 2015 145 2016 150 2017 165 2018](https://slidetodoc.com/presentation_image_h/26a540e681f669825f5853d609f1a41e/image-9.jpg)
![Tabel moment tahun Xi Yi Xi 2 2014 0 130 0 0 2015 1 Tabel moment tahun Xi Yi Xi 2 2014 0 130 0 0 2015 1](https://slidetodoc.com/presentation_image_h/26a540e681f669825f5853d609f1a41e/image-10.jpg)
![](https://slidetodoc.com/presentation_image_h/26a540e681f669825f5853d609f1a41e/image-11.jpg)
![• • • 10 a + 20 b = 1520 10 a + • • • 10 a + 20 b = 1520 10 a +](https://slidetodoc.com/presentation_image_h/26a540e681f669825f5853d609f1a41e/image-12.jpg)
![Y=a+bx Y = 132 + 10 x Trend tahun 2019 : X = Y=a+bx Y = 132 + 10 x Trend tahun 2019 : X =](https://slidetodoc.com/presentation_image_h/26a540e681f669825f5853d609f1a41e/image-13.jpg)
![Metode least square • • Dalam metode ini ∑ x = 0 Metode kuadrat Metode least square • • Dalam metode ini ∑ x = 0 Metode kuadrat](https://slidetodoc.com/presentation_image_h/26a540e681f669825f5853d609f1a41e/image-14.jpg)
![contoh tahun Y X X 2 XY 2014 130 -2 4 - 260 2015 contoh tahun Y X X 2 XY 2014 130 -2 4 - 260 2015](https://slidetodoc.com/presentation_image_h/26a540e681f669825f5853d609f1a41e/image-15.jpg)
![a = ∑ y/n = 760/5 = 152 b = ∑ xy / a = ∑ y/n = 760/5 = 152 b = ∑ xy /](https://slidetodoc.com/presentation_image_h/26a540e681f669825f5853d609f1a41e/image-16.jpg)
![Metode khusus 1. 2. Metode market share (Pangsa Pasar) Metode survey konsumen Metode khusus 1. 2. Metode market share (Pangsa Pasar) Metode survey konsumen](https://slidetodoc.com/presentation_image_h/26a540e681f669825f5853d609f1a41e/image-17.jpg)
![soal Data penjualan perusahaan “X” 6 tahun yang lalu : tahun penjualan 1 542 soal Data penjualan perusahaan “X” 6 tahun yang lalu : tahun penjualan 1 542](https://slidetodoc.com/presentation_image_h/26a540e681f669825f5853d609f1a41e/image-18.jpg)
![ditanyakan Ditanyakan : berapa perkiraan penjualan pada thun ke 7, gunakan metode least square ditanyakan Ditanyakan : berapa perkiraan penjualan pada thun ke 7, gunakan metode least square](https://slidetodoc.com/presentation_image_h/26a540e681f669825f5853d609f1a41e/image-19.jpg)
![Metode moment N=6 ∑ yi = 3914 ∑ xi = 15 ∑ xi yi Metode moment N=6 ∑ yi = 3914 ∑ xi = 15 ∑ xi yi](https://slidetodoc.com/presentation_image_h/26a540e681f669825f5853d609f1a41e/image-20.jpg)
![Metode least square n=6 ∑ xi = 0 ∑ yi = 3914 ∑ xi Metode least square n=6 ∑ xi = 0 ∑ yi = 3914 ∑ xi](https://slidetodoc.com/presentation_image_h/26a540e681f669825f5853d609f1a41e/image-21.jpg)
![Terima kasih Terima kasih](https://slidetodoc.com/presentation_image_h/26a540e681f669825f5853d609f1a41e/image-22.jpg)
- Slides: 22
![FORECAST SALES PERAMALAN PENJUALAN FORECAST SALES PERAMALAN PENJUALAN](https://slidetodoc.com/presentation_image_h/26a540e681f669825f5853d609f1a41e/image-1.jpg)
FORECAST SALES PERAMALAN PENJUALAN
![Forecast Penjualan adalah proyeksi teknis dari pada permintaan langganan potensil untuk suatu waktu Forecast Penjualan adalah proyeksi teknis dari pada permintaan langganan potensil untuk suatu waktu](https://slidetodoc.com/presentation_image_h/26a540e681f669825f5853d609f1a41e/image-2.jpg)
Forecast Penjualan adalah proyeksi teknis dari pada permintaan langganan potensil untuk suatu waktu tertentu dengan berbagai asumsi. Pemilihan berbagai teknik forecaasting dipengaruhi oleh : - sifat produk yang dijual - metode distribusi - tingkat persaingan - data historis
![Forecast penjualan menentukan keputusan kebijakan rencana produksi Kebijakan persediaan barang Forecast penjualan menentukan keputusan : - kebijakan rencana produksi - Kebijakan persediaan barang](https://slidetodoc.com/presentation_image_h/26a540e681f669825f5853d609f1a41e/image-3.jpg)
Forecast penjualan menentukan keputusan : - kebijakan rencana produksi - Kebijakan persediaan barang - Kebijakan investasi aktiva - Rencana cashflow
![TeknikTeknik dalam Forecast sales 1 2 3 Judgement method Metode statistika Metode khusus Teknik-Teknik dalam Forecast sales 1. 2. 3. Judgement method Metode statistika Metode khusus](https://slidetodoc.com/presentation_image_h/26a540e681f669825f5853d609f1a41e/image-4.jpg)
Teknik-Teknik dalam Forecast sales 1. 2. 3. Judgement method Metode statistika Metode khusus
![Judgement method 1 2 3 4 Digunakan untuk menyusun forecast penjualan maupun Judgement method • • 1. 2. 3. 4. Digunakan untuk menyusun forecast penjualan maupun](https://slidetodoc.com/presentation_image_h/26a540e681f669825f5853d609f1a41e/image-5.jpg)
Judgement method • • 1. 2. 3. 4. Digunakan untuk menyusun forecast penjualan maupun forecast kondisi bisnis. Sumber-sumbernya : Pendapat slesman Pendapat sales manajer Pendapat akhli Survey konsumen
![Metode statistika Analisis Trend a Free hand method trend bebas sangat subjektif dan Metode statistika Analisis Trend • a. Free hand method (trend bebas) sangat subjektif dan](https://slidetodoc.com/presentation_image_h/26a540e681f669825f5853d609f1a41e/image-6.jpg)
Metode statistika Analisis Trend • a. Free hand method (trend bebas) sangat subjektif dan kurang ilmiah Contoh : tahun penjualan 2014 130 2015 145 2016 150 2017 165 2018 170 •
![Free hand 170 150 130 0 Free hand 170 150 130 0](https://slidetodoc.com/presentation_image_h/26a540e681f669825f5853d609f1a41e/image-7.jpg)
Free hand 170 150 130 0
![Trend moment Rumus Y a bx Yi n a Trend moment Rumus : Y = a + bx ∑ Yi = n. a](https://slidetodoc.com/presentation_image_h/26a540e681f669825f5853d609f1a41e/image-8.jpg)
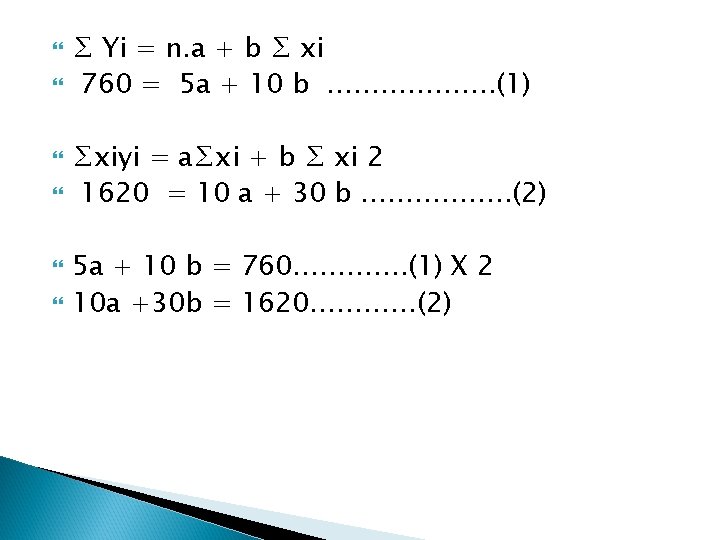
Trend moment Rumus : Y = a + bx ∑ Yi = n. a + b. ∑ xi ∑xi yi = a ∑ xi + b ∑ xi 2
![contoh Tahun x Penjualan Y 2014 130 2015 145 2016 150 2017 165 2018 contoh Tahun (x) Penjualan (Y) 2014 130 2015 145 2016 150 2017 165 2018](https://slidetodoc.com/presentation_image_h/26a540e681f669825f5853d609f1a41e/image-9.jpg)
contoh Tahun (x) Penjualan (Y) 2014 130 2015 145 2016 150 2017 165 2018 170
![Tabel moment tahun Xi Yi Xi 2 2014 0 130 0 0 2015 1 Tabel moment tahun Xi Yi Xi 2 2014 0 130 0 0 2015 1](https://slidetodoc.com/presentation_image_h/26a540e681f669825f5853d609f1a41e/image-10.jpg)
Tabel moment tahun Xi Yi Xi 2 2014 0 130 0 0 2015 1 145 1 2016 2 150 300 4 2017 3 165 495 9 2018 4 170 680 16 jumlah 10 760 1620 30
![](https://slidetodoc.com/presentation_image_h/26a540e681f669825f5853d609f1a41e/image-11.jpg)
![10 a 20 b 1520 10 a • • • 10 a + 20 b = 1520 10 a +](https://slidetodoc.com/presentation_image_h/26a540e681f669825f5853d609f1a41e/image-12.jpg)
• • • 10 a + 20 b = 1520 10 a + 30 b = 1620 (-) --------------- 10 b = - 100 b = 10 5 a + 10 b = 760 5 a + 10 (10) = 760 5 a = 660 A = 132
![Yabx Y 132 10 x Trend tahun 2019 X Y=a+bx Y = 132 + 10 x Trend tahun 2019 : X =](https://slidetodoc.com/presentation_image_h/26a540e681f669825f5853d609f1a41e/image-13.jpg)
Y=a+bx Y = 132 + 10 x Trend tahun 2019 : X = 5 Y = 132 + 10 (5) = 182
![Metode least square Dalam metode ini x 0 Metode kuadrat Metode least square • • Dalam metode ini ∑ x = 0 Metode kuadrat](https://slidetodoc.com/presentation_image_h/26a540e681f669825f5853d609f1a41e/image-14.jpg)
Metode least square • • Dalam metode ini ∑ x = 0 Metode kuadrat terkecil Bila “n” ganjil x = …, -2, -1, 0, +1, +2, +……. Bila “ n “ genap x = …. , -5, -3, -1, +3, +5 +… Rumus : Y=a+bx a = ∑ y/n b = ∑xy / ∑ x 2
![contoh tahun Y X X 2 XY 2014 130 2 4 260 2015 contoh tahun Y X X 2 XY 2014 130 -2 4 - 260 2015](https://slidetodoc.com/presentation_image_h/26a540e681f669825f5853d609f1a41e/image-15.jpg)
contoh tahun Y X X 2 XY 2014 130 -2 4 - 260 2015 145 -1 1 - 145 2016 150 0 2017 165 +1 1 + 165 2018 170 +2 4 + 340 jumlah 760 0 10 100
![a yn 7605 152 b xy a = ∑ y/n = 760/5 = 152 b = ∑ xy /](https://slidetodoc.com/presentation_image_h/26a540e681f669825f5853d609f1a41e/image-16.jpg)
a = ∑ y/n = 760/5 = 152 b = ∑ xy / ∑ x 2 = 100 / 10 = 10 Persamaan trend : Y = 152 + 10 X Penjualan 2019 : Y = 152 + 10 (3) = 182
![Metode khusus 1 2 Metode market share Pangsa Pasar Metode survey konsumen Metode khusus 1. 2. Metode market share (Pangsa Pasar) Metode survey konsumen](https://slidetodoc.com/presentation_image_h/26a540e681f669825f5853d609f1a41e/image-17.jpg)
Metode khusus 1. 2. Metode market share (Pangsa Pasar) Metode survey konsumen
![soal Data penjualan perusahaan X 6 tahun yang lalu tahun penjualan 1 542 soal Data penjualan perusahaan “X” 6 tahun yang lalu : tahun penjualan 1 542](https://slidetodoc.com/presentation_image_h/26a540e681f669825f5853d609f1a41e/image-18.jpg)
soal Data penjualan perusahaan “X” 6 tahun yang lalu : tahun penjualan 1 542 2 580 3 612 4 750 5 720 6 710
![ditanyakan Ditanyakan berapa perkiraan penjualan pada thun ke 7 gunakan metode least square ditanyakan Ditanyakan : berapa perkiraan penjualan pada thun ke 7, gunakan metode least square](https://slidetodoc.com/presentation_image_h/26a540e681f669825f5853d609f1a41e/image-19.jpg)
ditanyakan Ditanyakan : berapa perkiraan penjualan pada thun ke 7, gunakan metode least square dan moment.
![Metode moment N6 yi 3914 xi 15 xi yi Metode moment N=6 ∑ yi = 3914 ∑ xi = 15 ∑ xi yi](https://slidetodoc.com/presentation_image_h/26a540e681f669825f5853d609f1a41e/image-20.jpg)
Metode moment N=6 ∑ yi = 3914 ∑ xi = 15 ∑ xi yi = 10484 ∑ xi 2 = 55 Y=a+bx Y = 552, 48 + 39, 94 x Y tahun ke 7 = 792, 12
![Metode least square n6 xi 0 yi 3914 xi Metode least square n=6 ∑ xi = 0 ∑ yi = 3914 ∑ xi](https://slidetodoc.com/presentation_image_h/26a540e681f669825f5853d609f1a41e/image-21.jpg)
Metode least square n=6 ∑ xi = 0 ∑ yi = 3914 ∑ xi 2 = 70 ∑ xiyi = 1139 Y = a + bx Y = 652, 33 + 19, 97 x Y tahun ke 7 = 792, 12
![Terima kasih Terima kasih](https://slidetodoc.com/presentation_image_h/26a540e681f669825f5853d609f1a41e/image-22.jpg)
Terima kasih
Peramalan kebutuhan dan peramalan ketersediaan sdm
Sales force composite
Contoh sales forecast
Vektor skalar ortogonal
Contoh proyeksi penjualan
Semi average
Contoh forecast penjualan
Centered moving average
Yt
Contoh soal proyeksi trend
Buatlah contoh replacemant chart
Arti penting peramalan bisnis
Implikasi persaingan bisnis terhadap peramalan keuangan
Salesforce organization structure
Discuss the nuances of sales letters.
Sales force deployment
Establishing sales territories
Perkalaian
Contoh proyeksi neraca
Tes psikologi proyektif
Kelebihan dan kekurangan proyeksi silinder
Panjang proyeksi ta pada bidang abcd
Metode teknik proyeksi bisnis