The Use of Administrative Sources for Statistical Purposes


 -")


")


 – Out of work – Available for work –")


 • Not always a 1")
 • Stress the advantages of using a common classification • Offer expertise")
 • Use text descriptions to re-code administrative data • Use probabilistic conversion")
")


 may not be")


 • Take a wider view of all the")


 • One or more administrative sources are used to construct a")
 • A statistical register can contain additional variables, e. g. from")


- Slides: 85
The Use of Administrative Sources for Statistical Purposes Steven Vale United Nations Economic Commission for Europe
What are Administrative Sources?
Eurostat ‘CODED’ Glossary: An administrative source is the organisational unit responsible for implementing an administrative regulation (or group of regulations) for which the corresponding register of units and the transactions are viewed as a source of statistical data. Source: OECD and others, "Measuring the Non-Observed Economy: A Handbook",
Narrow Definition
Wider Definition
Administrative sources are sources containing information which is not primarily collected for statistical purposes.
Reasons for this definition • Increasing privatisation of government functions • Growth of private sector data and “value-added re-sellers” • User interest in new types of data
Examples of Administrative Sources
• Tax data - Personal income tax - Value Added Tax (VAT) - Business / profits tax • Social security data • Health / education records • Registration systems for persons / businesses / property / vehicles
• Published business accounts • Internal accounting data • Data held by private businesses: - credit agencies - business analysts - utility companies - telephone directories - retailers with store cards etc.
The Benefits of Using Administrative Sources
Cost • Surveys are expensive, a census is worse, data from administrative sources are often “free” • Less staff are needed to process administrative data - no need for response chasing.
Cost advantage • UK could save € 350 m • Source: Eurostat – Documentation of the 2000 round of population and Housing censuses in the EU, EFTA and Candidate Countries; Table 22
Response Burden • Using administrative sources: – Reduces the burden on data suppliers – Allows statistics to be compiled more frequently with no extra burden • Data suppliers complain if they are asked to provide the same information many times by different government departments
Coverage • Administrative sources usually offer better coverage of target populations, and can make statistics more accurate: – No survey errors – No (or low) non-response • Better coverage gives: – Better small-area data – More detailed information
Timeliness • Producing statistics from administrative sources can sometimes be quicker than using surveys • No need for: – forms design; – pilot surveys; – sample design etc.
Public Image • Making more use of existing data can enhance the prestige of a statistical organisation by making it seem more efficient • The concept of “Joined-up government” is politically appealing
Quality • Are data from administrative sources as good as data from surveys? • Who should judge this? • How can we measure quality? • How should we report and communicate quality?
Definition of Quality International Standard ISO 9000/2005 defines quality as; 'The degree to which a set of inherent characteristics fulfils requirements. ’
What does this mean? • Whose requirements? – The user of the goods or services • A set of inherent characteristics? – Users judge quality against a set of criteria concerning different characteristics of the goods or services • Therefore, quality is all about providing goods and services that meet the needs of users (customers)
Quality Measurement • How can we measure the quality of data from administrative sources? • There are established methods for measuring the quality of survey data, but these are not always relevant for administrative data
Three Aspects of Quality • To understand the quality of administrative sources we need to consider: – Quality of incoming data – Quality of processing – Quality of outputs
Metadata • Knowledge and documentation of the source is vital to help us to understand quality: – How the data are collected – – Why they are collected How they are processed Concepts and definitions used etc…
Legal Frameworks
National Legal Frameworks • Most statistical institutions have legislation defining their roles and responsibilities, e. g. a ‘Statistical Law’ • Many new statistical laws introduced in the last 10 - 15 years • Some existing statistical laws have been revised to include provisions for the use of administrative data
National Legal Frameworks • Some national legal frameworks give more powers than others for access to administrative data • Historical, political and cultural factors will have an impact on national frameworks, therefore these are not harmonised between countries
International Frameworks • The European Union is developing a legal framework for official statistics, including references to the use of administrative data
Timing • Legal frameworks should reflect the desired future position rather than the current reality, otherwise they will quickly become a barrier • Start planning now for the next revision to the legal framework
Policy Frameworks
Policy Frameworks • Government policy on data sharing – How can the national statistical institute influence this? • Codes of practice – International – National
International Codes of Practice • United Nations Fundamental Principles of Official Statistics – Principle 5: Data for statistical purposes may be drawn from all types of sources, be they statistical surveys or administrative records. Statistical agencies are to choose the source with regard to quality, timeliness, costs and the burden on respondents
National Codes of Practice • Can reassure the public that data will only be used for specific and reasonable purposes • Should be made available to the public, e. g. via the internet site of the national statistical institute.
Organisational Frameworks
Using Administrative Sources in Practice The use of administrative sources is enabled by a legal framework, in the context of a policy framework But - these are not usually detailed enough to cover all the administrative arrangements for access and use
What Else is Needed? • Some sort of agreement: - Service Level Agreement (SLA) - Administrative Protocol - Contract - Informal or verbal agreement - Other type of agreement according to national customs and practices
Agreement Contents 1 • Legal basis • Names of persons transferring and receiving data • Detailed description of data covered • Frequency of data supply • Quality standards • Confidentiality rules
Agreement Contents 2 • • • Technical standards Provision of metadata Provisions for payment for supply data Period of agreement Contingencies for changes in circumstances • Procedure for resolving disputes
Technical Frameworks
Technical Frameworks • Mechanisms for data transfer – Paper – Magnetic media – Secure on-line connection • File formats • Data / metadata standards – XML – SDMX – GESMES
Common Problems and Solutions
Public Opinion • The level of public concern about government departments sharing data varies from country to country • There is usually some suspicion of the motives for data sharing • Sometimes public opinion favours data sharing
Solutions • Adopt and publish a code of practice following international standards • Clearly stated limits and rules may help reduce concerns • The principle of the “one-way flow” of sensitive data must be understood by all
Solutions • Publish cost-benefit analyses of the use of different sources • It may be possible to claim that data are more secure – No questionnaires sent by post – Fewer clerical staff, so fewer people with access to data
Public Profile • Direct contact with the public via surveys helps raise the profile of the statistical office • The use of administrative data can reduce contact with the public and awareness of the work of the statistical office
Solutions • Effective ‘marketing’ of the statistical office and data outputs • Greater involvement with education institutions, business groups, and other target customers
Units • Administrative units may be different to statistical units: – Job / person – Tax unit / enterprise – Dwelling / household • They may need to be converted to meet statistical requirements
Solutions • Automatic rules for simple cases – These must be clear and consistent • Statistical “adjustments” – E. g. the statistical unit is persons. The administrative unit is jobs. We know from a survey that working people have, on average, 1. 15 jobs. This adjustment factor can therefore be used to estimate persons in employment from jobs • Profiling
Definitions of Variables • Administrative data are collected according to administrative concepts and definitions • Administrative and statistical priorities are often different, so definitions are often different
Unemployment • Statistical definition (ILO) – Out of work – Available for work – Actively seeking work • Administrative definitions are often based on those claiming unemployment benefits
Solutions • Know and document the differences and their impact • Use other variables to derive or estimate the impact of the difference • Statistical adjustments during data processing
Classifications Two scenarios: 1. Same classification system 2. Different classification systems
Same Classification • Used for different purposes • May not be a priority variable for the administrative source • Different classification rules • Different emphasis, e. g. specific activity rather than main activity
Solutions • Understand how classification data are collected and what they are used for • Provide coding expertise, tools and training to administrative data suppliers
Different Classifications (or different versions of the same classification) • Not always a 1 to 1 correlation between codes • Tools are needed to convert codes from one classification to another
Solutions (1) • Stress the advantages of using a common classification • Offer expertise to help re-classify administrative sources • Give early notice of classification changes and help implement them across government
Solutions (2) • Use text descriptions to re-code administrative data • Use probabilistic conversion matrices to convert codes – This results in individual unit classifications not always being correct, but aggregate data should be OK
Example of a conversion matrix (Approx. 22% probability of correct code!)
Missing Data • Impute where possible • Many different imputation methods are used. Two common methods are: – Deductive Imputation – Hot-deck Imputation
Case Study • Eurostat have a project to develop enterprise demography • They want to estimate the impact of enterprise births • Employment of new enterprises is used, but this variable is often missing or unreliable for new units
Solutions • Calculate turnover per head ratios to impute missing variables • Ratios based on “similar” units by classification and size • Problems with outliers therefore trimming used, e. g. x% or mean of inter-quartile range
Timeliness Two Issues • Data arrive too late • Data relate to a different time period
Data arrive too late • Data from annual tax returns are often only available several months after the end of the tax year, so they are unsuitable for monthly or quarterly statistics • Lags in registering “real world” events
Solutions • Understand the length and impact of lags • Adjust data accordingly • Look for ways to reduce lags where possible
Different Time Periods • Administrative reference period (e. g. Financial/tax year) may not be the same as the statistical reference period • Monthly average versus point in time (e. g. employment data)
Different Time Periods
Solutions • Statistical corrections or estimations using data from other reference periods • Be aware of possible biases when using point in time reference dates
Using data from different sources • Data from different sources may not agree • This may be due to: – Different definitions, classifications, time periods, . . – Errors
Solutions • Data validation checks • Benchmarking against other sources • Priority rules for updating from different sources • Knowledge of source quality
Priority Rules • Different sources can be given different priorities for different variables • To stop a “low priority” source overwriting a “high priority” one – – Use source codes Use priority / quality markers Store dates with variables Load data in reverse priority order
Resistance to Change • Statisticians may resist the use of administrative data because they: – Do not trust data unless they collect themselves; – Focus on negative quality aspects; – Have an over-optimistic view of the quality of survey data; – Assume survey respondents comply with statistical norms.
Solutions • Education (courses like this!) • Take a wider view of all the dimensions of quality, and focus on the impact on users • Determine the real relative quality of survey and administrative data • Identify how cost savings can be used to improve quality and / or increase outputs
Change Management • Risk of changes in: – – – Government / administrative policy Thresholds Definitions Coverage Systems
High-Risk Times • • Immediately after an election Change of minister Change of government policy Change in EU legislation and…. • When you least expect it!
Solutions Manage the Risk by: – Legal provisions – Contractual agreements – Regular contact with administrative colleagues – Anticipating changes – Contingency plans
Administrative Sources and Statistical Registers
Direct Use • Simplest case - an administrative source is used directly as a sampling frame • Easy and cheap • Quality problems? • Lack of control?
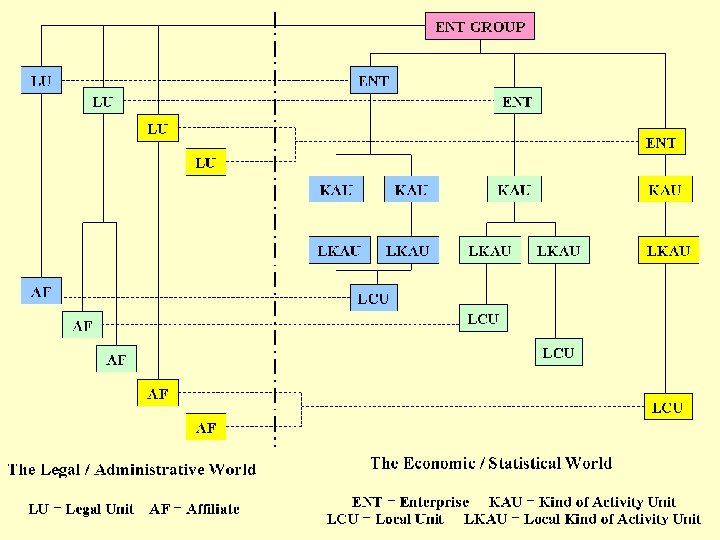
Indirect use (1) • One or more administrative sources are used to construct a statistical register • A statistical register can be a tool for integrating data from different sources
Indirect use (2) • A statistical register can contain additional variables, e. g. from surveys, imputed, or calculated • The statistical register is owned and controlled by statisticians
Multiple data sources • Data from a single source – no check on accuracy • Data from several sources – better view of the accuracy of the data – increased range of variables available – but; how to deal with data conflicts?
Models for Creating and Maintaining Statistical Registers using Administrative Data
UK Business Register
Basic Registers in Sweden
Central Register Cross-government projects to create central registers of person / business data to facilitate data sharing, e. g. • Registers in Nordic Countries • Australian Business Register • UK Business Index
Satellite Register A satellite register is a tool for incorporating administrative data that are only relevant for a sub-set of units in a statistical register Satellite registers may contain additional units, or variables, or both Satellite Register Statistical Register