UK mix of renewable energy Why we need
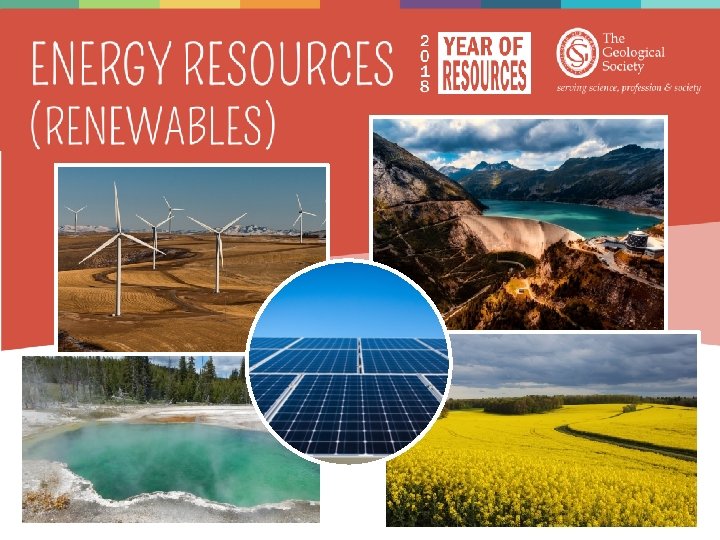

• • UK mix of renewable energy Why we need renewable energy Wind Solar Hydroelectric Geothermal Biofuels

What are renewable energy resources? What are some examples of renewable energy resources? Which renewable energy resources do we use in the UK?

The UK uses renewable energy resources to generate heat and electricity. Put these renewables in order from largest to smallest contributors to electricity generation. Largest contributor 29% Onshore Wind 4% Landfill gas 21% Solar PV 6% Hydroelectric Other bioenergy Smallest contributor 12% Offshore Wind 28% UK Electricity generation by fuel source 2017 – Department for Business, Energy & Industrial Strategy

The UK uses renewable energy resources to generate heat and electricity. Put these renewables in order from largest to smallest contributors to electricity generation. Largest contributor Onshore Wind Other bioenergy Offshore Wind Solar PV Hydroelectric 29% 28% 21% 12% 6% Smallest contributor Landfill gas 4% UK Electricity generation by fuel source 2017 – Department for Business, Energy & Industrial Strategy

160 42% biofuels including waste hydro and pumped storage solar 120 wind 100 24. 5% 80 21% 60 40 9% 20 >2% s l Re Fuel ne w ab le Oi l Co a ar le Nu c s 0 Ga Power generated/ TWh 140 UK Electricity generated 2016 Department of Business, Energy and Industrial Strategy

Why do we need renewable energy resources? Why can’t we just continue to use non-renewable resources?
 increased by 90 ppm")
• CO 2 is at 407 ppm (Oct 2018) increased by 90 ppm in the last 70 years • Global warming ~1. 1°C in the past 200 years • Ocean acidification • Rising sea level ~3. 2 mm each year • Decreasing ice sheet mass • Retreating glaciers • Decreasing Arctic ice at a rate of 13% each decade Renewable energy is crucial for mitigating climate change

RESEARCH ACTIVITY Research one renewable energy resource used in the UK to answer the following questions: a) How is this energy resource used to generate electricity? – include a simple diagram b) How much of the UKs electricity is currently generated from this resource, and how has this changed over time? c) What are the positives of using this energy resource? d) What are the negatives of using this energy resource?

Propeller Blade Nacelle containing generator Tower Wind turbine Wind farm • Strong winds • Clear hilltop • Turbines in prevailing wind direction

The amount of power, and therefore electricity, a wind turbine can produce is largely based on wind velocity using this equation: 3 Power = ½ ρAV Higher wind speed = lots more power Larger wind turbine = more power ρ = air density; ~1 kg m 3 A = swept area (π r 2 ) V = velocity (m s-1) Power is measured in Watts

How much power can be generated in this situation? Power = ½ ρAV 3 ρ = air density; ~1 kg m 3 A = swept area (π r 2 ) V = velocity (m s-1) Power is measured in Watts
 with a capacity for")
• UK has 9, 220 wind turbines (Oct 2018) with a capacity for 20. 1 gigawatts – 6 th largest producer of wind power in the world • In 2017 17% of UK electricity was generated from wind power (29% by renewables in total) © 2014 Syon Geographical Ltd.

25. 7 MW Lauingen Energy Park in Bavarian Swabia, Germany
")
• Thermal solar panels are used to generate heat energy, • Photovoltaic (PV) cells made from silicon turn sunlight directly into electricity • 3. 4% of total electricity was generated by Solar PV in the UK in 2017 (29% by renewables in total)

• South of UK has ‘solar potential’ equal to Germany which generates 7% of electricity from solar PV. • Solar panels are expensive. You need a lot of them and they require rare metals such as cadmium and indium. • An average UK house uses around 3 k. W of energy each year – you need 12 -15 solar panels to generate this much power. UK solar energy potential
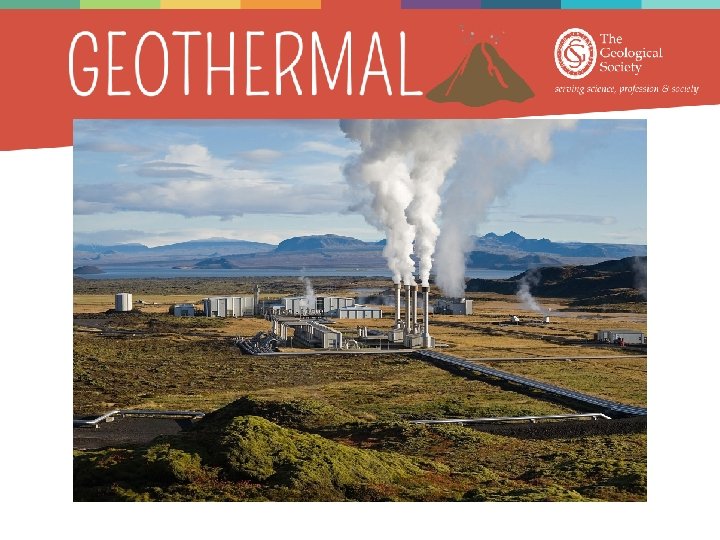

• Geothermal energy = heat energy from the Earth • Decay of radioactive elements and residual heat from planetary formation 4. 5 billion years ago • Water is pumped down into hot rock where it is heated. • Steam can then be used to heat buildings directly or to generate electricity by spinning a turbine. Nesjavellir Geothermal Power Station, Iceland

Electricity pylon Generator Cooling tower Turbine Steam Injection well Hot water Cold water Water is heated Homes and buildings

• ~ 190 ˚C granite 4. 5 km beneath Cornwall. • United Downs Geothermal Energy Project has funding to build a pilot geothermal energy plant • 10 MW of electricity and 55 MW of heat. • Geothermal energy beneath Cornwall could meet all of Cornwall’s demand for electricity and up to 20% of the UK’s demand. © BGS (NERC)

• Hydroelectric power harnesses the kinetic energy of running water. Hydroelectric dam • Water flows downwards with gravity to spin a turbine. Reservoir of • More reliable than solar and water wind power. • Hydroelectric dams are very expensive and can harm wildlife. Generator • 1. 5% electricity from Turbine hydroelectric schemes in the UK (29% total)

705 GWh per year Cruachan Power Station, Argyll and Bute, Scotland

• Biofuel - either directly from plants or from waste. • Main UK sources are wheat and cooking oil • Bioethanol – used as fuel and as a petrol additive to increase octane and lower carbon emissions • Biodiesel – used as fuel and used to reduce levels of particulates and carbon monoxide in diesel powered vehicles
")
• Biofuel makes up 3% of all UK road and nonroad fuel (2016) and 9% of UK electricity generation • In 2016 93, 000 ha were used for biofuels, 41, 000 ha of this was to grow wheat (DEFRA) • Ethical and environmental issues

• Iceland – geothermal and hydroelectric • Costa Rica - hydroelectric • Brazil- biofuels
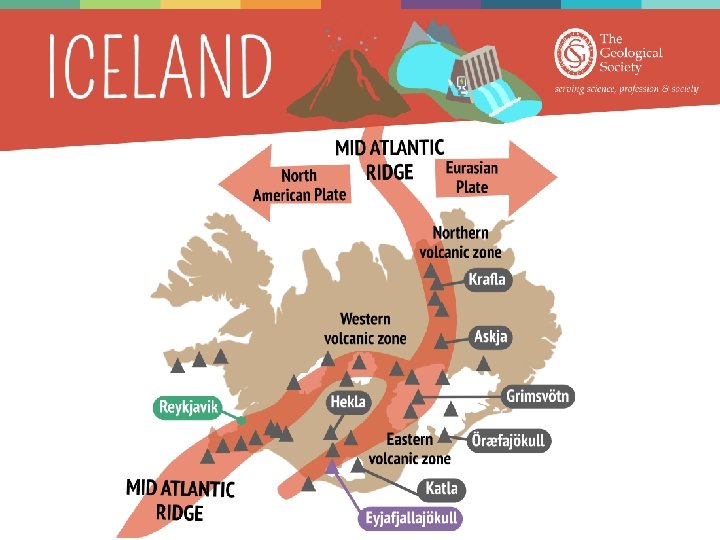

• Iceland lies on the Mid Atlantic Ridge a region of sea floor spreading = lots of hot rocks! Nesjavellir Geothermal Power Station • Annual rainfall 2, 000 mm (UK ~885 mm/year) • 600 hot springs and 20 hightemperature steam fields >150 °C.

• 85% of Iceland’s heating and 27% of electricity comes from geothermal energy. • 70% of Iceland’s electricity comes from hydropower from glaciers and rivers. • Hydropower saved Iceland an ~ $8. 2 billion from 1970 to 2000 and lowered its CO 2 emissions by 37%. • Still dependent on fossils fuels for ships, cars and buses –actually one of the highest emitters of CO 2 per capita. • Research into hydrogen fuel cells to power buses and cars. Nesjavellir Geothermal Power Station
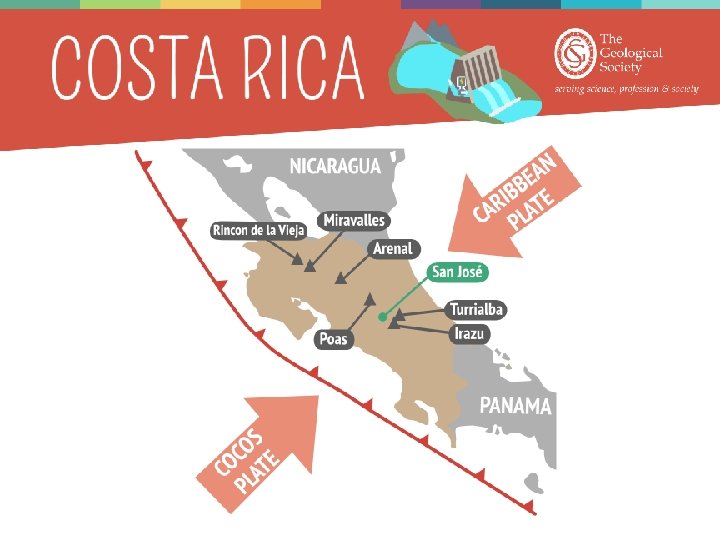

• High concentration of rivers, dams, and volcanoes • Annual rainfall 2, 926 mm - 4 th highest rainfall per capita • Renewable energy supplied 99% of electricity in Costa Rica in 2017, 78% of which was hydropower, 10% geothermal and 10% wind • For 300 days in 2017 and again in 2018 Costa Rica generated all of its electricity from renewable energy sources. Electricity generation in Costa Rica 2017

• Lake Arenal Dam provides enough electricity to power 12% of Costa Rica. • 99% electricity is from renewables but 70% energy consumption in Costa Rica is from transport which runs on petroleum • Costa Rica has 287 cars per 1, 000 people, greater than the world and Latin American average. • Growth in car ownership has also made San José the most congested city in Latin America Lake Arenal, Costa Rica

• Costa Rica’s goal is to be carbon neutral by 2021 • Costa Rica’s hosts more than 5% of the world’s species biodiversity despite its landmass covering 0. 03% of the planet. • Dams can environmental and social consequences - affecting previously healthy rivers, disrupting wildlife and displacing indigenous communities. ‘Blue jeans’ poison dart frog Monte Verde cloud forest

Leading producers of bioethanol 2016 • Made from sugarcane • Brazil is 2 nd largest producer of bioethanol after USA • produced 7. 295 billion US gallons of ethanol in 2016, 27. 4% of total ethanol production. • Replaced 42% of its gasoline needs with bioethanol.

• 90% of new cars are flex fuel (run on either gasoline or pure ethanol) • Since 2003, the combination of sugarcane ethanol and flex fuel vehicles has reduced Brazil’s emissions of carbon dioxide by more than 350 million tons. • Consumes rainforest land - deforestation and biodiversity

• Emissions from bioethanol are ~ 90% lower than those of gasoline or diesel fuels • Emissions associated with production and land clearing. • Use lots of water - up to 4 litres of water are needed to produce 1 litre of ethanol produced.
 What renewable energy")
Research renewable energy in another LIC/NEE country e. g. Indonesia a) What renewable energy resources are used? b) What percentage of total energy use is from renewables? c) How is the country trying to increase their use of renewables? d) What problems may it face?

• The UK uses a mix of non-renewable and renewable fuels • Renewable energy resources are crucial for lowering carbon dioxide emissions and enabling a secure energy future • Important renewable energy sources include wind, solar, geothermal, hydroelectric and biofuels no energy resource is perfect - each comes with their own positives and negatives • Iceland, Costa Rica and Brazil renewable energy case studies
- Slides: 37