Routing and Scheduling for Restoration of PostDisaster Network


 coordinated and effective logistics")


: �Directed connected and simple graph G")


 �Undirected windy graph, K")


 �Gives connected graph")


 |Q|")
 12 Makespan (hours) vs. Number of")
 Number")


 • Albaida and Madrigueras Cities (Taken")


![REFERENCES �[1]](https://slidetodoc.com/presentation_image/44226e71815f6973726281c889cbe315/image-104.jpg "REFERENCES �[1]")
. \"Earthquake risk and")
- Slides: 105
Routing and Scheduling for Restoration of Post-Disaster Network Connectivity F. Sibel Salman Koç University Industrial Engineering Department Istanbul, Turkey University of Maryland - November 21, 2013 * Supported by Tubitak Grant 111 M 537, joint work with Ayse Nur Kibar
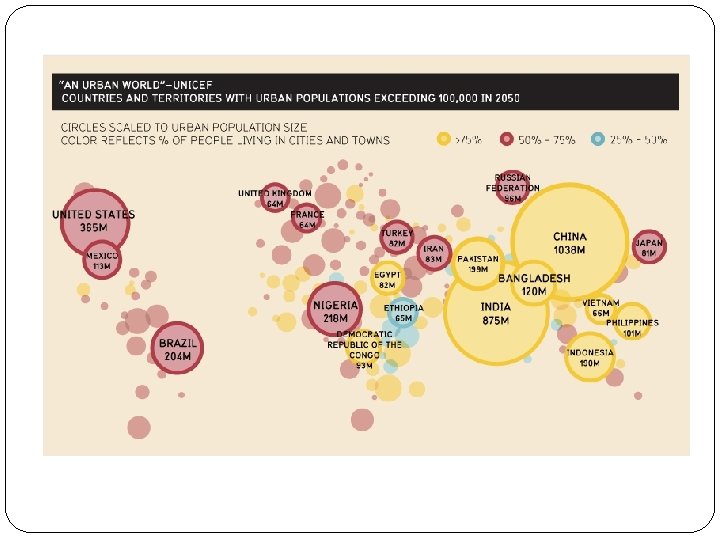
Natural Disaster Risk
Natural Disaster Risk �Climate change
Natural Disaster Risk �Urbanization and poor land-use planning
Source: Gilles André, Natural hazard mapping across the world. A comparative study between a social approach and an economic approach to vulnerability, Cybergeo : European Journal of Geography , 2012
Impact �In rich countries disasters result in �higher economic losses �fewer people tend to be affected �loss of life is less than in developing countries �Higher levels of preparedness �Resilience and good governance �Faster recovery Source: The Brookings Institution – London School of Economics Project on Internal Displacement Report, Ferris and Petz, 2012
Impact �Economic loss �The UN has estimated the direct economic cost of disasters since 2000 is roughly $1. 4 tn �Natural disasters caused $85 bn global economic loss during the first half of 2013 �Japan's earthquake and tsunami of 2011 was probably the most costly natural disaster in history, causing losses of hundreds of billions of dollars
Disaster Management Mitigation Recovery Preparedness Response
Disaster Management * Source: IFRC website
Response mobilize resources (people, goods, equipment, money and other assets) coordinated and effective logistics planning and preparedness Develop Competencies PPlanning PPublic Information and Warning POperational Coordination PCritical Transportation PEnvironmental Response/Health and Safety PFatality Management Services PInfrastructure Systems PMass Care Services PMass Search and Rescue Operations POn-Scene Security and Protection POperational Communications PPublic and Private Services and Resources PPublic Health and Medical Services PSituational Assessment
Logistics Problem In the immediate aftermath of disaster how to dispatch the clearing teams �Find routes for the teams (vehicles, machinery) �Schedule road clearing and repairing tasks �GOAL: To establish rescue routes as quickly as possible
Objective Restore connectivity in road network in shortest time • Critical O-D pairs • All pairs
Problem
Problem One depot, two vehicles
Problem One depot, two vehicles
Problem One depot, one vehicle
Problem Two depots, two vehicles
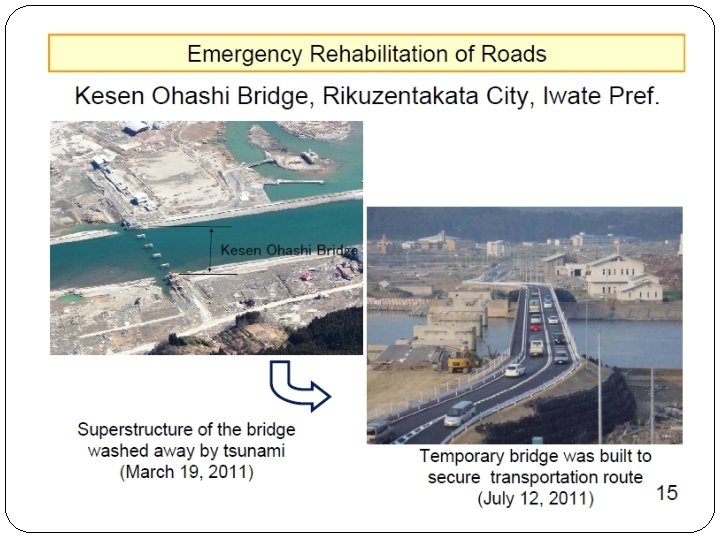
The Great East Japan Earthquake • On March 11, 2011, a 9. 0 M earthquake shook the east coast of Japan Sources: 1) US Do. T, Federal Highway Administration Publication Number: FHWAHRT-12 -00, 2) wikipedia, and 3) www. mlit. gov. jp
Tsunami A massive tsunami deposited huge amounts of debris in downtown areas, requiring road clearing to open rescue routes in four prefectures
Damage • Crippled transportation system • Cellular and landline phone service suffered major disruptions • Damaged power plants causing blackouts • Nuclear power plant damages and radioactive leakage �Catastrophic damage in cities in the Tohoku (northeastern) region of the country
Transportation Japan's transport network suffered severe disruptions Highways �Many sections of Tōhoku Expressway serving northern Japan were damaged � The expressway did not reopen to general public use until 24 March 2011 (13 days later) Railways �All railway services were suspended in Tokyo, with an estimated 20, 000 people stranded at major stations across the city �Most Tokyo area train lines resumed full service by the next day— 12 March Airports and ports �Sendai airport flooded, 10 ports damaged
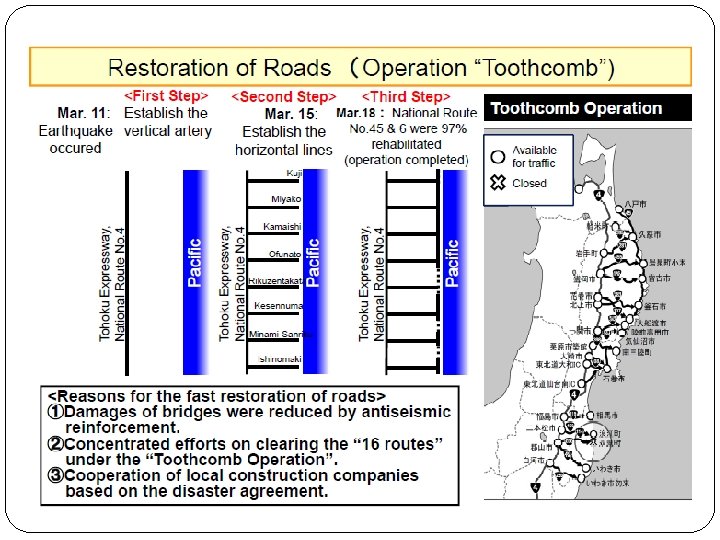
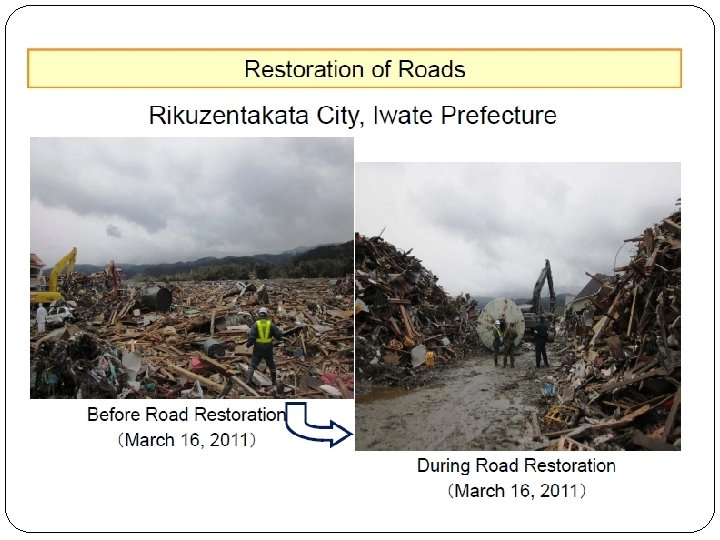
Road Damage �Almost 4, 000 road segments, 78 bridges and 29 railway locations were reported to be damaged �Accumulated debris in the downtown of Kamaishi City, Iwate Prefecture, and a damaged arterial (national highway 45) virtually isolated the community from rescue efforts �About 76 percent of the highways in the area were closed due to damage
Response and Recovery 1. Temporary recovery work in the short term 2. Permanent restoration of roads to pre-disaster conditions in the longer term � Responsible agency: Tohoku Regional Bureau of the Ministry of Land, Infrastructure, Transport, and Tourism (MLIT)
Emergency Response 1 day 2 weeks �An aggressive clearing and reconstruction effort � Almost 100 percent of the affected highways were functional within two weeks
Immediate Response Collect damage information � Personnel in helicopters sent to Tohoku's four affected areas � Followed 1, 880 closed-circuit television cameras already installed throughout the region for monitoring highways and rivers
�The Tohoku Bureau's disaster operations center, shown here receiving video feeds on the night of March 11, 2011
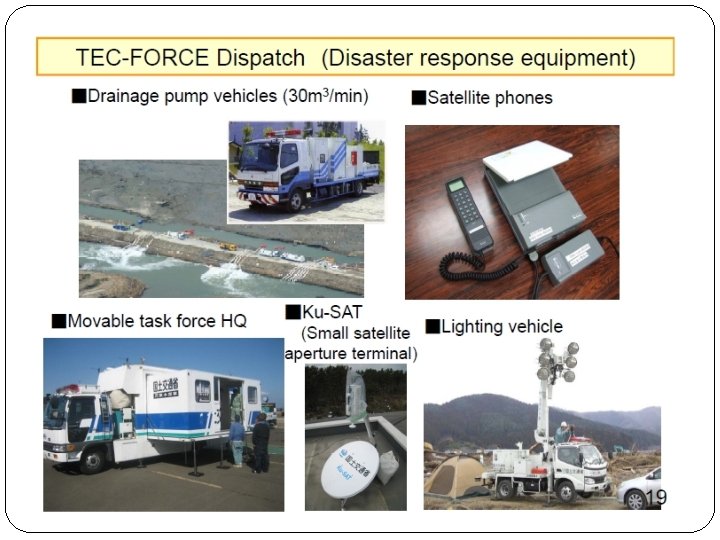
Japan Earthquake and Tsunami Establish routes for rescue and the transport of supplies �The bureau organized 52 teams for the roadclearing operation, each consisting of 10 operators with their equipment
In six days the cratered section of the Great Kanto Highway in Naka was ready to reopen to traffic
• A street in Miyako, left, clogged with destroyed cars, buildings and debris after the March 12, 2011 earthquake and tsunami • The same road has been cleared of damaged buildings and was open to vehicles on March 1, 2013. Kyodo News Service via AP
PROBLEM DEFINITION
Problem Definition Arc Routing for Connectivity Problem (ARCP): �Directed connected and simple graph G = (V, A) �Subset B of A: blocked arcs �Set of disconnected components, Q , of G’= (V, AB) �K vehicles, each deployed in a depot node, d(k) for vehicle k �cij : traversal time through arc (i, j) �bij : additional time of opening a blocked arc (i, j)
Problem Definition �FIND an open walk for each vehicle k �starts at its depot d(k) at time s(k) �opens one or more blocked arcs � FIND a subset R of B: arcs that are opened to restore connectivity s. t. �G*= (V, AB ∪ R ) is strongly connected �All the walks, together, cover the arcs in set R �Objective : Minimize time to reconnect the network �C(k) : Completion time of the walk of vehicle k Min Max k C(k)
Problem Definition Assumption: �While a vehicle is opening an arc, another vehicle cannot enter this arc Observations: �A vehicle arriving to an arc while another one opens it waits until the end of opening �In an optimal solution, if a blocked arc is in the walk of more than one vehicle, then the vehicle that arrives first to the arc opens the arc
� Combination of Arc Routing, Network Design, Scheduling � NP-hard in the strong sense
Related Problems Arc Routing �Rural Postman Problem �Windy Rural Postman Problem �Min-Max K-WRPP �K vehicles should traverse required arcs Scheduling �Scheduling with identical parallel machines, sequence dependent setup times, minimize makespan Network Design �Steiner Tree Problem
Related Work � Min-Max K-WRPP (Benavent et al. , 2009) �Undirected windy graph, K vehicles deployed in a depot �Closed walks starting and ending at the depot, which cover a given required edge set R �Objective: Min-Max travel time � Difference of ARCP: �Connectivity of graph �Opening time => fixed charge �Arcs required to be traversed are not known in advance �Time of arrival of a vehicle at an arc should be considered
Computational Complexity �ARCP with one vehicle and one depot is NP-hard. (Reduction from Rural Postman Problem, RPP) RPP ARCP
SOLUTION METHOD
Formulation Complicating factors for ARCP formulation �Connectivity of the components � By cutset inequalities, or sending flow �Timing of the vehicles and waiting times �We need to keep track of the arrival time of a vehicle to an arc each time an arc is traversed �To calculate this value, we also need to know the preceding arc and how many times it has been traversed
Formulation Variables �Flow to eliminate subtours of vehicle routes �Number of visits to a node �Number of traversals of an arc � 0 -1, which vehicle unblocks which arcs �Time related variables Six indices for arrival times, many binary variables & big M type constraints!
Mathematical Formulation
Mathematical Formulation
Mathematical Formulation
Mathematical Formulation �Objective Function Traversal + Opening + Waiting Time
Mathematical Formulation � Vehicle Balance Equations • For each vehicle, ensures an open walk starting at the depot (could result in subtours)
Mathematical Formulation � Constraints relating xijk and zijk variables • If vehicle k traverses an arc, the arc has to be unblocked by a vehicle • If vehicle k leaves its depot, it has to connect a component by its walk
Mathematical Formulation � Flow balance equations for the walks • Unit flow is left at a node each time it is visited
Mathematical Formulation � Constraints relating fijk and xijk variables � Constraints relating xijk and vik variables • If a vehicle traverses an arc, there has to be positive flow through that arc, else zero flow • No of visits to a node determined by no of traversals of incoming arcs
Mathematical Formulation � Component Connectivity Constraits • In cutset of every subset of components, at least 2 arcs in opposite directions must be unblocked.
Mathematical Formulation � Constraints initializing tijgk, p’, p � Constraints calculating the arrival time at an arc
Mathematical Formulation � Constraints calculating the waiting time � Constraints relating tijgk, p’, p and uijgk, p’, p
Mathematical Formulation � Constraints identifying precedence between variables tijgk, p’, p � Constraints relating uijk, p , xijk and zijk • Summation of variables u over p is equal to the total number of traversals on that arc • If a blocked arc is unblocked by a vehicle, it must be in its first traversal of the arc
Mathematical Formulation � Constraints relating uijgk, p’, p and uijk, p
Mathematical Formulation � Constraints defining the variables
Relaxation Relaxed MIP �Remove time related elements (keep component connectivity constraints) �Gives connected graph �Ignores waiting times
Solution Approach Multi-vehicle problem �Heuristic idea: Convert solution of the relaxed MIP to a feasible solution => Investigate the performance of the relaxed MIP
Solution Approach Single vehicle problem 1. MIP - exact solution 2. Heuristic � Find arcs to be unblocked such that components are connected to each other � Construct a walk including the selected arcs (and others as needed)
Selecting Arcs One depot, one vehicle
Heuristic for Single Vehicle Problem �Initial solution by two stages: 1. Choose R, arcs to be unblocked, by MST on components with costs bij 2. Solve RPP with costs cij and required arcs, R, by modified Christofides/Frederickson heuristic
Heuristic for Single Vehicle Problem �Improvement by local search: 1. Search on R set by � best improvement, or � “targeted” probabilistic exchanges within the component cutsets 2. Local improvement to routing by a hybrid heuristic: Variable Neighborhood Descent with Simulated Annealing and Tabu Search aspects
Search on arcs to be unblocked
ISTANBUL CASE STUDY
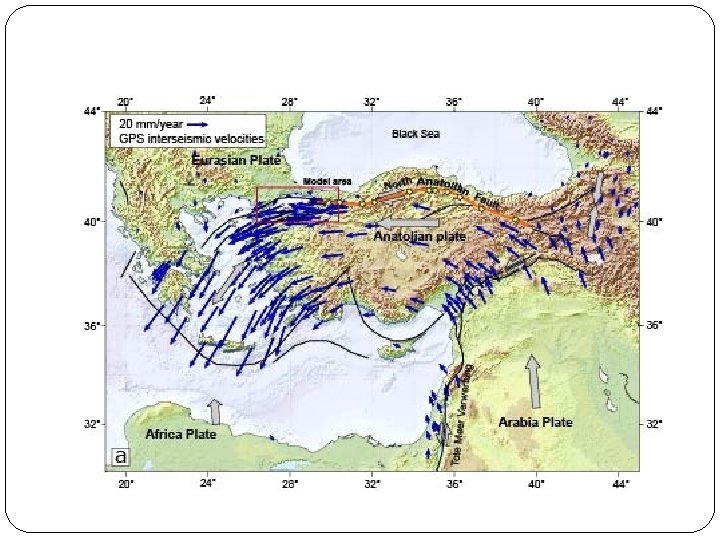
Earthquake Risk in Istanbul
Earthquake Risk in Istanbul �In the last 1500 years, on average, a magnitude M=7 -8 earthquake has occurred every 50 years and M=8 -9 every 300 years �Stresses resulting from the plate motion have not been released since the last major earthquake in 1766 �Parsons et al. (2000): Probability of a major earthquake in Istanbul in the next 30 years is 62. 5± 15% �Risk is high => over 15 million residents, mis- constructed and illegal structures built in the last 40 years
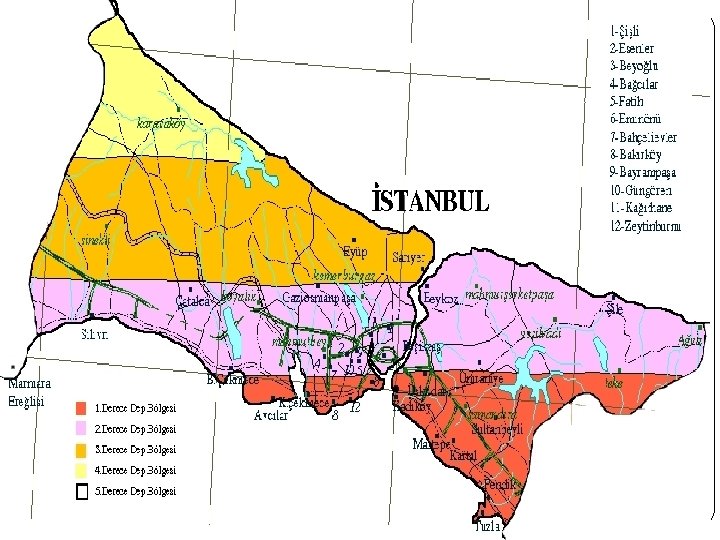
Earthquake Scenarios
Model C: Worst Case Scenario September 17, 2020
Population Density � Population density is high in red zones
Koç University
Data Instances �We use Istanbul highway network to test the models � 74 nodes including 38 province centers � 358 links (716 arcs) �Traversal times are determined by real road distances which are calculated using Google Maps. �Assuming average 50 km/h speed for vehicles, converted road distances to time
Roads in Istanbul City � Main highways in red, other roads and streets in grey
DATA INSTANCES
DATA INSTANCES
Data � 10 different instances created from the network � Blocked roads selected randomly within the risky areas Number of Disconnected Scenarios Blocked Arcs Components 1 2 3 4 5 6 7 8 9 10 30 32 40 42 52 60 76 80 82 84 3 3 4 4 5 6 6 5
Data �Defined high/low unblocking time randomly �Multiplied traversal times by a factor α �Determined α randomly with respect to estimated damage factors and repair times High Unblocking Time High damage Medium Low damage Low Unblocking Time High damage Medium Low damage 0. 6 0. 3 0. 1 0. 3 0. 6 U(10, 50) U(5, 10) U(2, 5) U (10, 50) U (5, 10) U (2, 5)
Computational Experiments �Platform: two processors, Intel Xeon CPU E 5 -2643, 3. 30 GHz. 64 -bit operating system �GAMS 24. 0, CPLEX 12. 5 �options threads 0, parallelmode 1 �In multiple vehicle case, solved the relaxed MIP �In single vehicle case, solved exact MIP
Numerical Results - Single Vehicle ARCP � Exact solution obtained in very short time # of Com. Blocked ponents Arcs 30 32 40 44 54 60 74 80 80 82 3 3 4 4 5 6 6 5 AVG High Unblocking Time Low Unblocking Time Objective (hr) Gap (%) Time (sec) Objective Gap (hr) (%) 4. 46 2. 96 8. 50 6. 40 3. 34 6. 09 7. 30 11. 16 9. 05 8. 20 6. 75 0 0 0 39 8 8 6 8 13 50 27 23 14 19. 6 2. 51 2. 40 5. 13 3. 42 2. 66 3. 43 5. 49 5. 93 5. 87 3. 51 4. 04 0 0 0 Time (sec) 30 10 9 9 8 9 114 27 17 21 25. 4
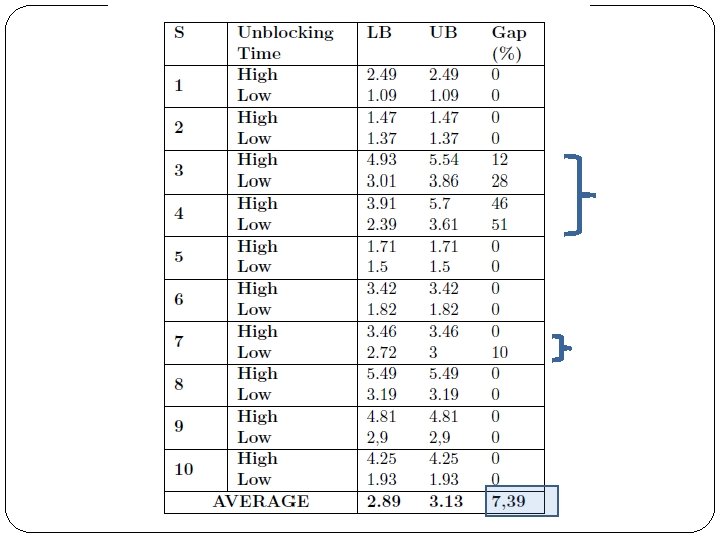
Numerical Results – Multi-vehicle � More solution time with lower blocking times # of Blocked Compo. Arcs nents 3 30 3 32 4 40 3 44 4 54 4 60 5 74 6 80 5 82 AVG High Unblocking Time Low Unblocking Time Obj. (hr) LB (hr) Gap (%) Time (s) Obj. (hr) LB (hr) Gap (%) Time (s) 2. 49 1. 47 4. 93 3. 91 1. 71 3. 42 3. 46 5. 49 4. 81 4. 25 3. 59 0 0 0 866 9 9192 40 9 128 79 590 1684 89 1268 1. 09 1. 37 3. 01 2. 39 1. 50 1. 82 2. 72 3. 19 3. 42 1. 93 2. 24 1. 09 1. 37 3. 01 2. 39 1. 50 1. 82 2. 72 3. 19 3. 32 1. 93 2. 23 0. 00 37 0. 00 349 0. 00 5 0. 00 131 0. 00 6673 0. 00 16863 2. 90 21600 0. 00 118 0. 29 4582
Obtaining Feasible Solutions Instance 3, low blocking time case Infeasible Solution: Vehicle 1: 23 -50 -21 -54 -22 -26 -69 = 25 = 69 -26 -22 -55 -2019 -16 -10 -45 = 40 = 8 Vehicle 2: 23 - 21 - 20 - 19 - 16 - 10 - 45 - 40 - 8 = 5 = 8 Feasible Solution: Vehicle 1: 23 -50 -21 -54 -22 -26 -69 = 25 = 69 Vehicle 2: 23 - 21 - 20 - 19 - 16 - 10 - 45 = 40 = 8 = 5 = 8 No increase in makespan => optimal
Obtaining Feasible Solutions Instance 3, high blocking time case Infeasible Solution: Vehicle 1: 23 - 49 - 48 - 44 - 17 - 12 - 41 - 9 - 40 - 8 = 5 = 8 Vehicle 2: 23 -21 -54 -22 -26 -69 = 25 = 69 -26 -22 -55 -20 -19 -74 -17 -12 -41 -9 -40 = 8 Feasible Solution: Vehicle 1: 23 - 49 - 48 - 44 - 17 - 12 - 41 - 9 - 40 = 8 = 5 = 8 Vehicle 2: 23 - 21 - 54 - 22 - 26 - 69 = 25 = 69 - 26 - 22 - 55 - 20 - 19 - 74 - 17 - 12 - 41 - 9 - 40 - (0: 13 hr) - 8 increased makespan => 12% optimality gap
How does the relaxation perform? �Can we get good feasible solutions from the relaxation? �How far from optimality are the feasible solutions obtained?
Preparedness – System Design �Depot locations �Number of depots �Number of vehicles (equipment and teams)
Numerical Results – Relaxed MIP � Effect of Number of Vehicles (single depot) |Q| 6 6 5 K Obj. (hr) LB Gap(%) Time (s) 1 11. 16 0 27 2 5. 49 0 590 3 4. 07 3. 66 10. 18 3600 4 3. 38 2. 59 23. 51 3600 5 2. 75 2. 12 22. 89 3600 6 2. 56 2. 32 9. 38 3600 7 2. 42 1. 35 44. 21 3600 1 9. 05 0 23 2 4. 81 0 1684 3 3. 61 3. 16 12. 4 3600 4 3. 04 2. 23 26. 49 3600 5 2. 41 2. 26 6. 22 3600 1 8. 2 0 14 2 4. 25 0 89 3 3. 25 2. 91 10. 46 3600 4 2. 54 2. 24 11. 64 3600 5 2. 31 0 2540 AVERAGE 4. 12 3. 76 12. 95 2487 Large Gap
Improvement in Makespan � Instance 8 (single depot) 12 Makespan (hours) vs. Number of vehicles 10 8 6 4 2 0 1 2 3 4 5 6 7
Numerical Results – Relaxed MIP � Effect of Number of Depots (and vehicles) Number of Number Obj. Comp. of Depots (hr) 3 3 4 1 2 3 4 AVG 4. 46 2. 32 1. 53 2. 96 1. 31 0. 98 8. 5 4. 89 3. 49 3. 14 3. 36 LB Gap Time (s) (%) 4. 46 2. 32 1. 53 2. 96 1. 31 0. 98 8. 5 4. 89 3. 49 3. 06 3. 35 0 0 0 0 0 2. 51 0. 25 39 20 37 8 8 135 199 3600 406
RESULTS - Single Vehicle ARCP �Effect of Location of Depot �Scenario 8 (6 components, 80 blocked arcs, one depot) Objective Depot ID (hr) 15 11. 08 11. 16 23 27 11. 16 29 10. 41 32 10. 28 LB (hr) Gap(%) Time (s) 11. 08 0 29 11. 16 0 27 11. 16 0 39 10. 41 0 11 10. 28 0 12
CONCLUSIONS
Conclusions Multi-vehicle ARCP �Relaxing time constraints in MIP seems like a viable approach �Relaxed model gave feasible solutions in 16 out of 20 instances �Open problems �Need an effective heuristic to convert infeasible solutions to feasible �Optimality gap gets larger as the number of vehicles and components increase => exact solution method
Conclusions Single vehicle ARCP �Easy to solve by MIP �At most 25 seconds with 2 vehicles and depots �Istanbul network with 74 nodes, 716 arcs �At most 84 blocked arcs, 6 components �Our heuristic gets very good solutions in much shorter run time in larger instances �Viable approach for real-time use in larger problems
QUESTIONS AND COMMENTS
Data • Istanbul City (Generated using Google Maps) • Albaida and Madrigueras Cities (Taken from Prof. K. Holmberg) • Opening times are assigned to each road according to several factors ü Amount of debris on a road: § light/heavy by-passable/heavy non-by-passable ü Speed of collecting each kind of debris with available machines ü Narrowness of a road ü Being in residential areas ü Flooding or liquefaction after the disaster �
Neighborhood Structures -Deletion/Reconnection • Do not check all exchange pairs for connectivity at each iteration • Assign probabilities for Acceptance:
Different Versions � Ho: MST + Routing Search � H 1: Checking all Alternatives at Each Iteration � H 2: Checking potentially “better” edges
Instance Characteristics Istanbul |V| |E| |B| |Q| S 1 74 358 40 6 S 2 74 358 49 8 S 3 74 358 42 6 S 4 74 358 41 7 S 5 74 358 16 3 S 6 74 358 21 2 S 7 74 358 15 3 S 8 74 358 20 4 S 9 74 358 31 4 S 10 74 358 38 6 MADR 3 1 MADR 3 2 MADR 3 4 MADR 5 5 MADR 3 5 ALBA 31 ALBA 51 |V| |E| |B| |Q| 196 316 86 9 196 316 108 17 196 316 101 12 196 316 147 36 196 316 95 6 116 174 51 88 12 37
Results Instances S 1 S 2 S 3 S 4 S 5 S 6 S 7 S 8 S 9 S 10 Average Percentage Gap H 0 0 0 2. 7 0. 9 0 0 1. 5 0. 7 H 1 0 0 0 0 0 H 2 0 0 0. 6 0 0 Instances H 0 H 1 H 2 MADR 31 MADR 32 MADR 34 MADR 55 MADR 35 ALBA 31 ALBA 51 Average Percentage Gap 0. 4 8 0 -1 0 1. 7 0 0. 1 4. 6 0 -0. 8 0 1. 7 0 1. 3 0. 8
Comparison Algorithm H 0 H 1 H 2 Run Time 1 2 3 Solution Quality 3 2 1 � MIP model (GAMS 24. 0 , Cplex 12. 5): sometimes not time efficient, problem with big M, high variability � Computational platform: 64 -bit, 2 processors, Intel Xeon CPU E 5 - 2643, 3. 30 GHz, 32 GB RAM, Windows 7 operating system
REFERENCES �[1]
REFERENCES � Bakir, P. G. , and Boduroglu, H. M. (2002). "Earthquake risk and hazard mitigation in Turkey. " Earthquake Spectra. , Vol. 18(3, pp. 427 -447. Aug. ). � Parsons et al. (2000) Parsons, T. S, Toda T. S. , Stein R. S. , Barka A. , Dietrich J. H. , Heightened odds of large earthquakes near Istanbul, An interaction-based probability calculation, 2000, Science, 288, 661 -665. � Erdik and Durukal, 2008. Earthquake Risk and its Mitigation in Istanbul. Natural Hazards, 44, 181 -197. � Erdik et al, 2003. Earthquake risk assessment for Istanbul metropolitan area. Eartquake Eng Vibra 2: 1, 1 -25.