Chapter 5556 Notes Chapter 55 Ecosystems and Restoration

- Slides: 44
Chapter 55/56 Notes
Chapter 55: Ecosystems and Restoration Ecology
Essential Knowledge 2. a. 1 – All living systems require constant input of free energy (55. 2 & 55. 3). 2. d. 1 – All biological systems from cells and organisms to populations, communities, and ecosystems are affected by complex biotic and abiotic interactions involving exchange of matter and free energy (55. 1 – 55. 4) 4. a. 6 – Interactions among living systems and with their environment result in the movement of matter and energy (55. 1, 55. 3, 55. 4, 55. 5).
Ecosystem All the organisms and abiotic factors in a community.
Ecosystem Studies 1. Energy Flow – the movement of energy through trophic levels. 2. Chemical Cycling – the movement of matter from one part of the ecosystem to another.
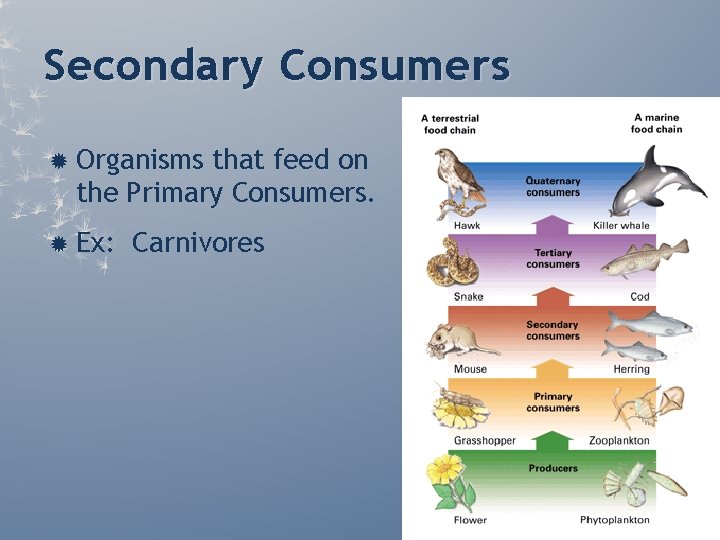
Trophic Levels Division of an ecosystem based on the source of nutrition (energy).
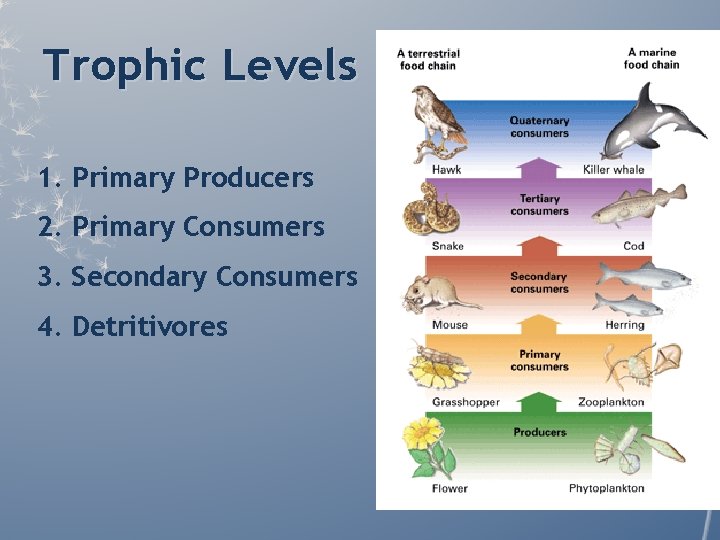
Trophic Levels 1. Primary Producers 2. Primary Consumers 3. Secondary Consumers 4. Detritivores
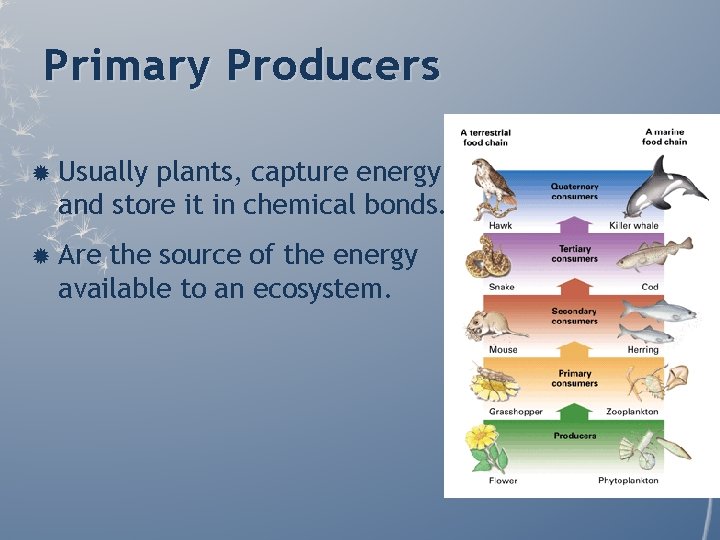
Primary Producers Usually plants, capture energy and store it in chemical bonds. Are the source of the energy available to an ecosystem.
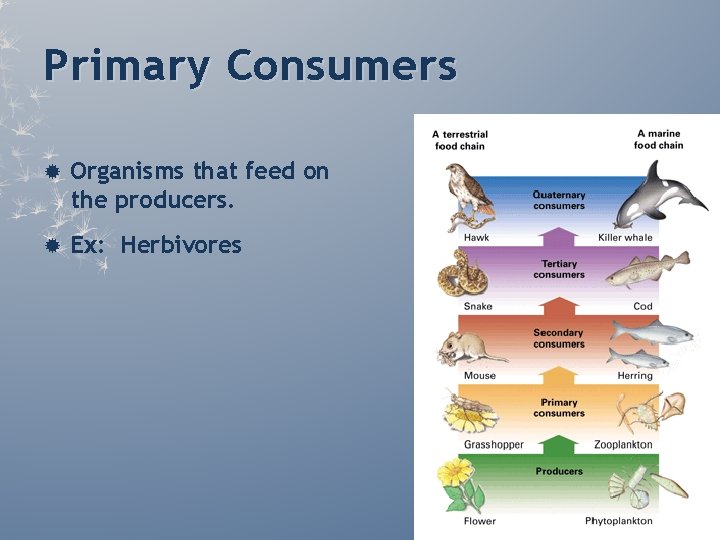
Primary Consumers Organisms that feed on the producers. Ex: Herbivores
Secondary Consumers Organisms that feed on the Primary Consumers. Ex: Carnivores
Detritivores Get their energy from the organic waste produced by all levels. Ex: bacteria and fungi
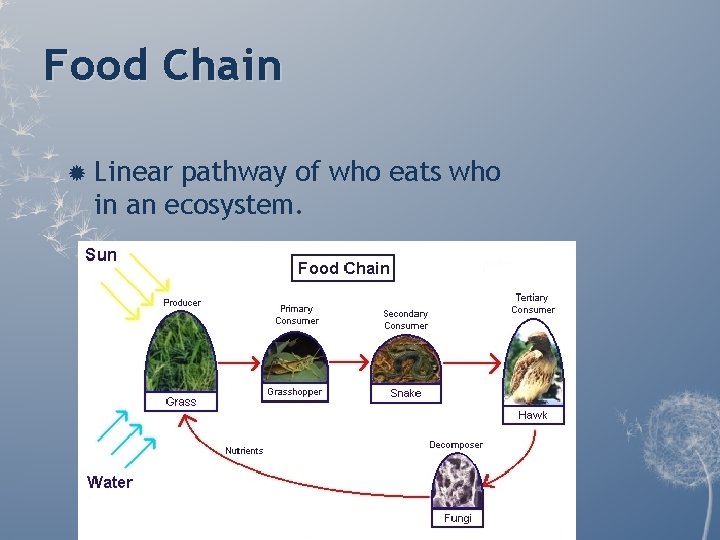
Food Chain Linear pathway of who eats who in an ecosystem.
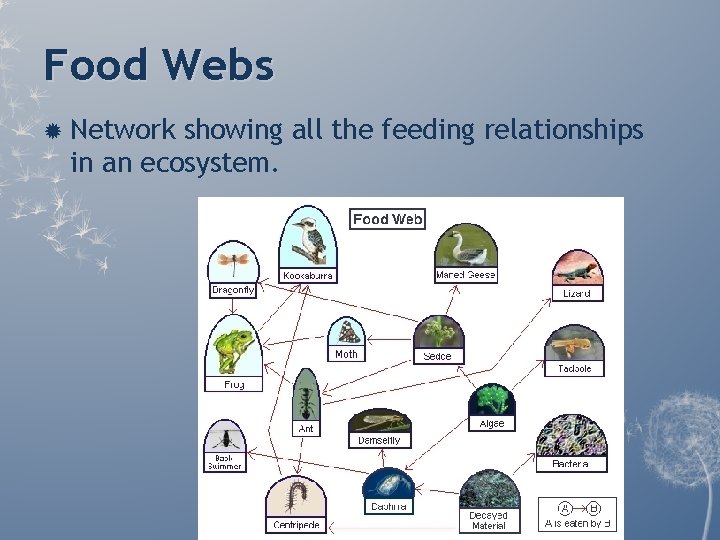
Food Webs Network showing all the feeding relationships in an ecosystem.
Primary Productivity The rate at which light energy is captured by autotrophs or primary producers.
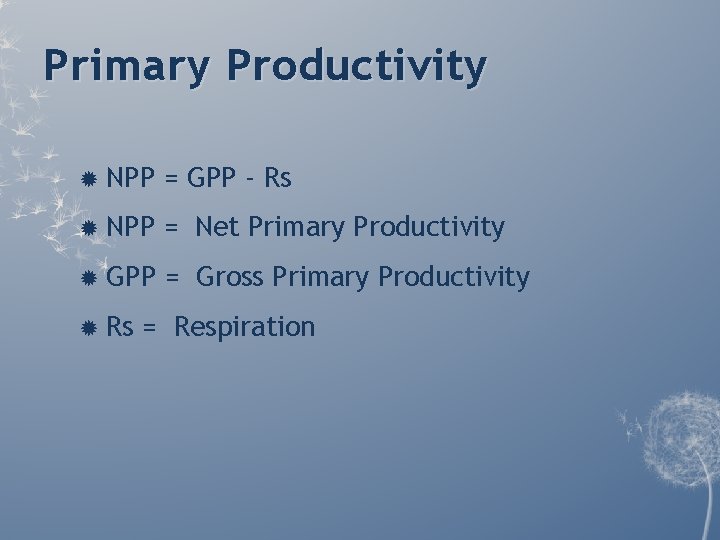
Primary Productivity NPP = GPP - Rs NPP = Net Primary Productivity GPP = Gross Primary Productivity Rs = Respiration
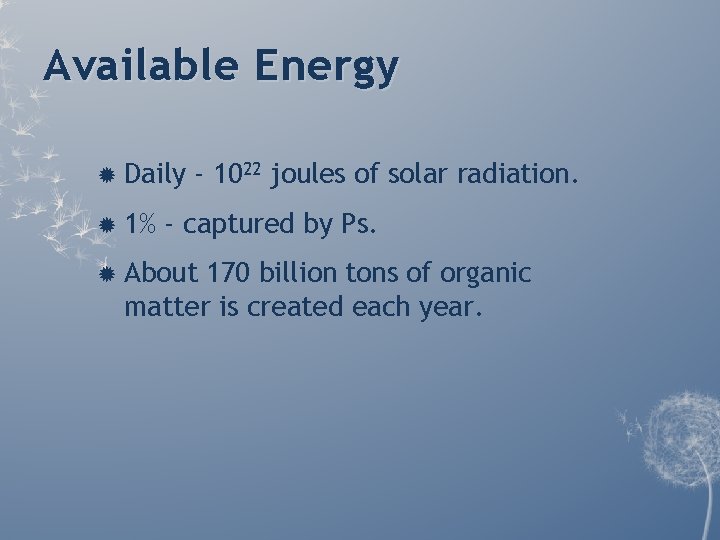
Available Energy Daily 1% - 1022 joules of solar radiation. - captured by Ps. About 170 billion tons of organic matter is created each year.
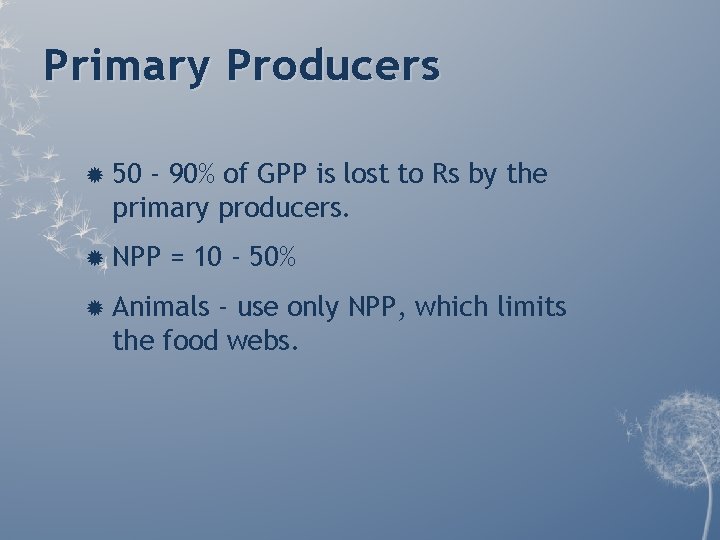
Primary Producers 50 - 90% of GPP is lost to Rs by the primary producers. NPP = 10 - 50% Animals - use only NPP, which limits the food webs.
Limiting Factors Material or nutrient that is not present in sufficient quantity for the primary producers. Ex: N, P, K, Mg Light, CO 2
Energy Transfers Not 100% efficient. Averages change 10% with each tropic level Why? Ë Second law of thermodynamics. Ë Waste. Ë Materials that can’t be digested etc.
Question ? Why do most ecosystems have only 3 - 4 trophic levels? There isn’t enough energy passed up through the food web to support more levels.
Implications There has to be fewer high level consumers in a food web. The higher level consumers usually need a large geographical area.
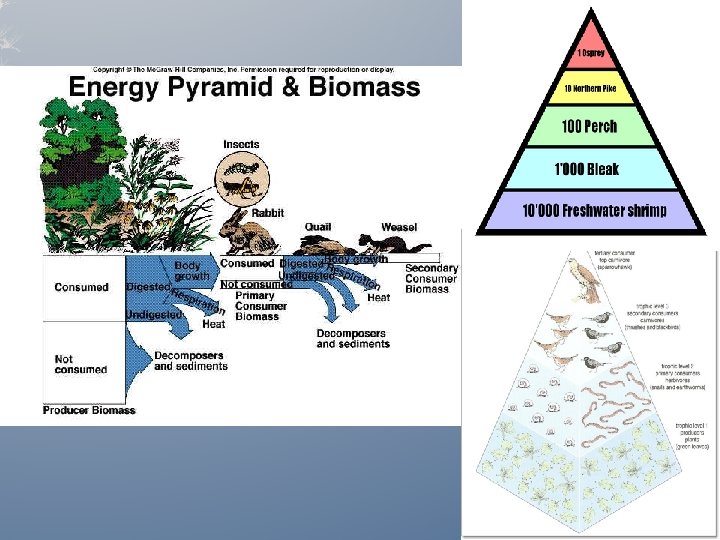
Pyramids Graphical representation of relationships in ecosystems. Ex: 1. Productivity 2. Biomass 3. Numbers
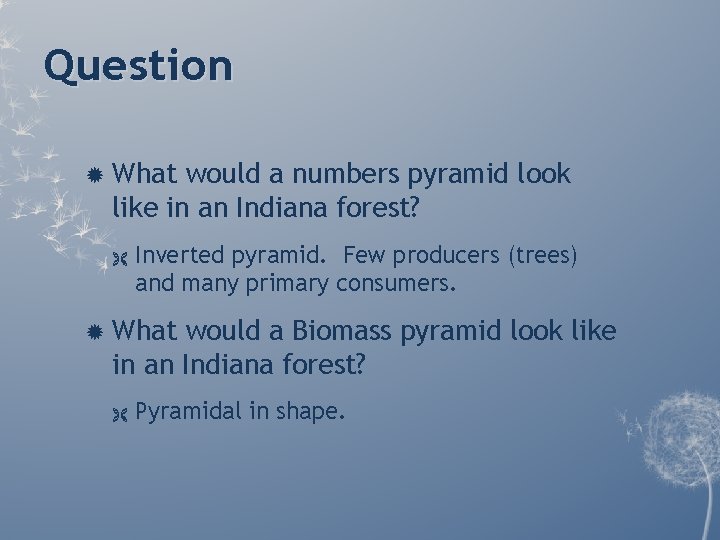
Question What would a numbers pyramid look like in an Indiana forest? Ë Inverted pyramid. Few producers (trees) and many primary consumers. What would a Biomass pyramid look like in an Indiana forest? Ë Pyramidal in shape.
Chemical Cycling Matter Ex: is recycled through ecosystems. Biogeochemical Cycles
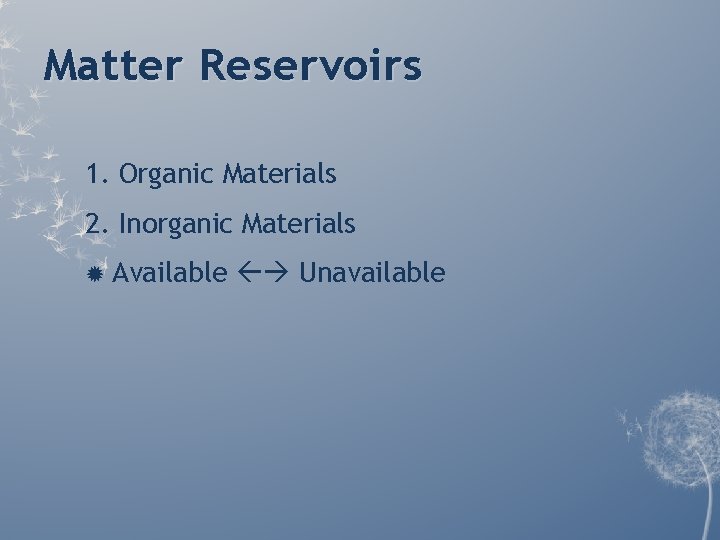
Matter Reservoirs 1. Organic Materials 2. Inorganic Materials Available Unavailable
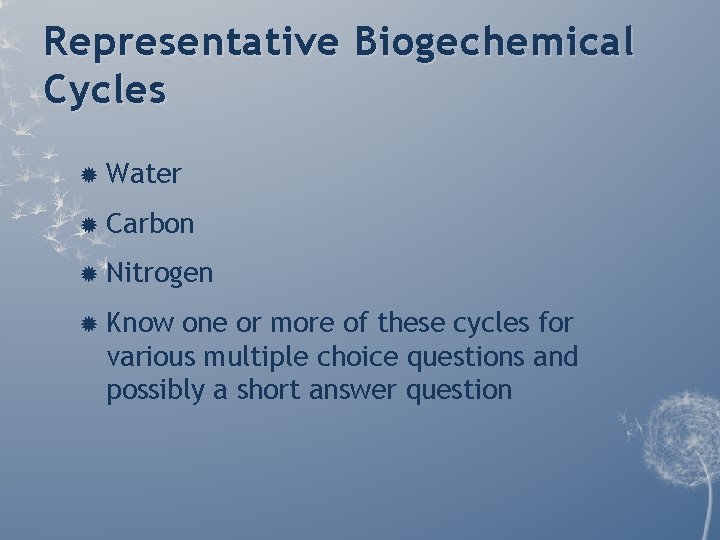
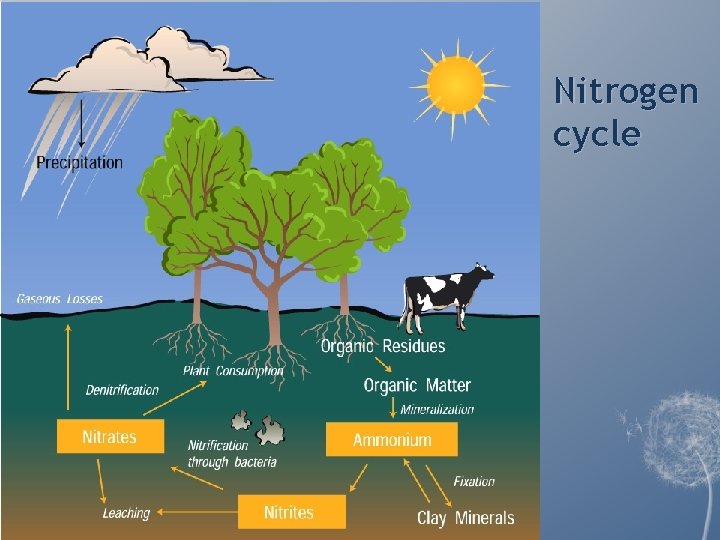
Representative Biogechemical Cycles Water Carbon Nitrogen Know one or more of these cycles for various multiple choice questions and possibly a short answer question
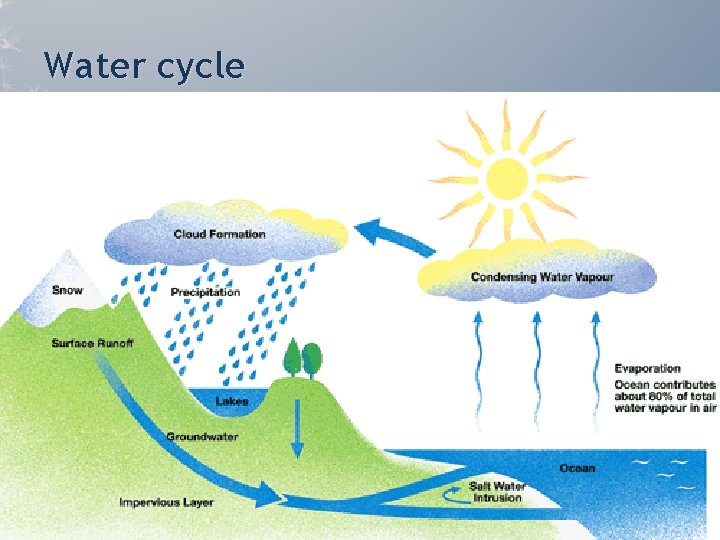
Water cycle
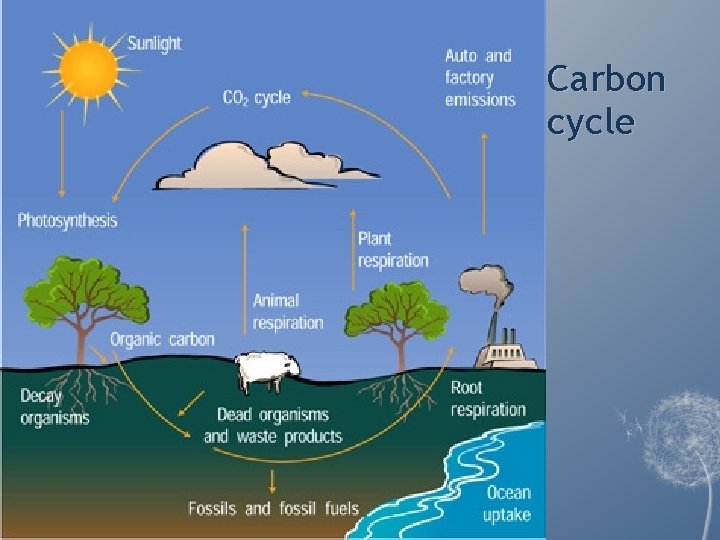
Carbon cycle
Nitrogen cycle
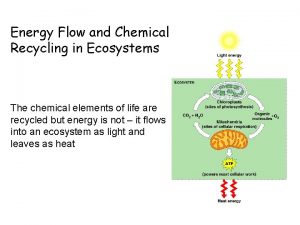
Energy vs Matter Energy - flows through ecosystems and is mostly lost as heat. Matter - cycles in ecosystems.
Chapter 56: Conservation Biology and Global Change
Question ? What is Man's influence on Ecosystems ? Humans have had many negative impacts.
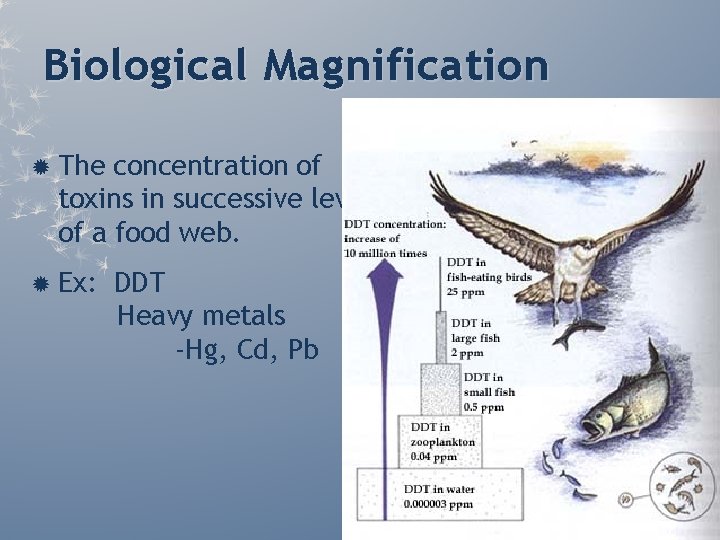
Biological Magnification The concentration of toxins in successive levels of a food web. Ex: DDT Heavy metals -Hg, Cd, Pb
Causes Not broken down by digestion/decomposition. Lipophilic. Concentrates and effects the upper levels of the food web.
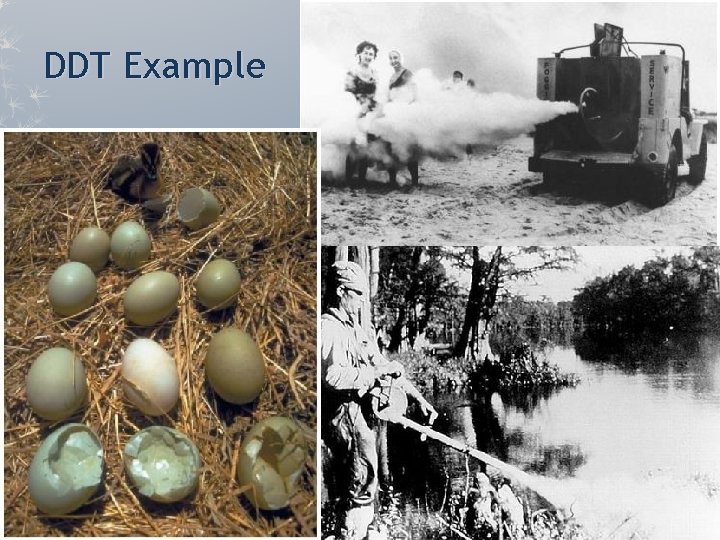
DDT Example
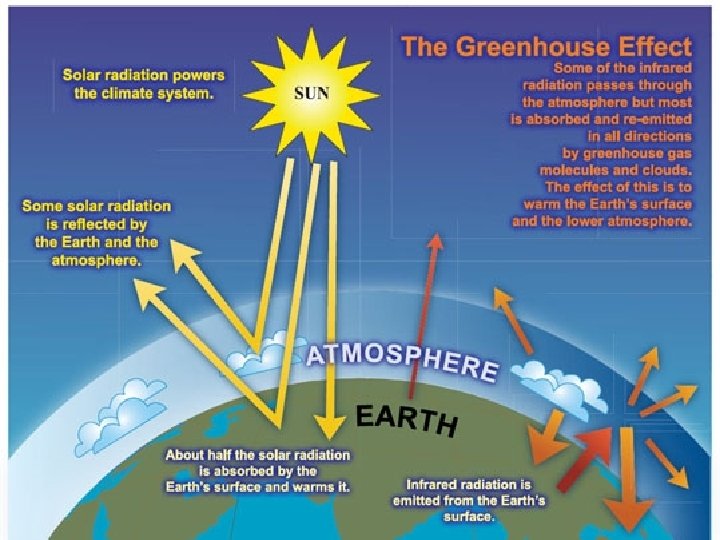
Greenhouse Effects The trapping of heat by the Earth's atmosphere. (CO 2, H 2 O etc. ). Causes: Ë Warms Earth’s temperatures Ë Global warming
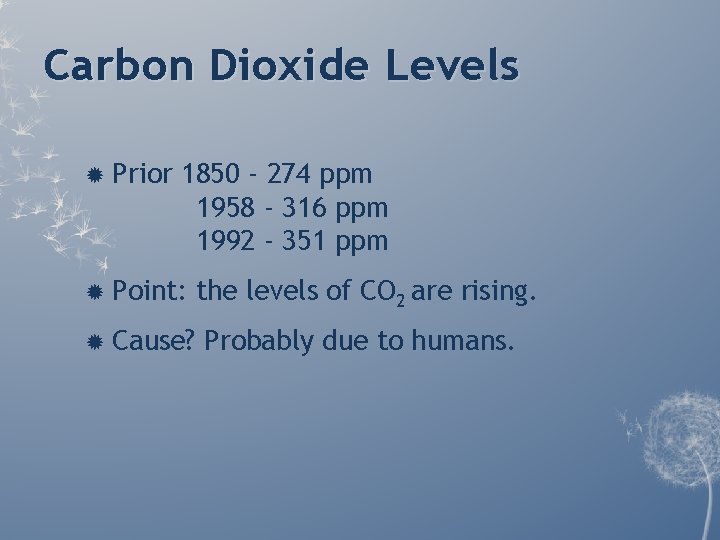
Carbon Dioxide Levels Prior 1850 - 274 ppm 1958 - 316 ppm 1992 - 351 ppm Point: the levels of CO 2 are rising. Cause? Probably due to humans.
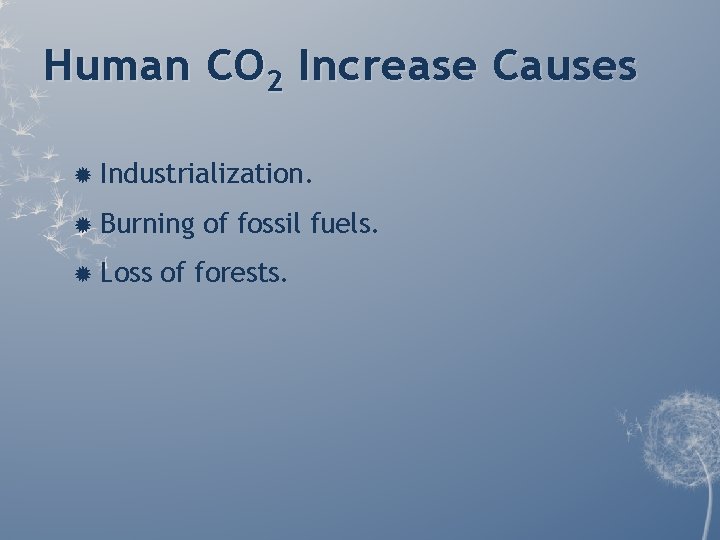
Human CO 2 Increase Causes Industrialization. Burning Loss of fossil fuels. of forests.
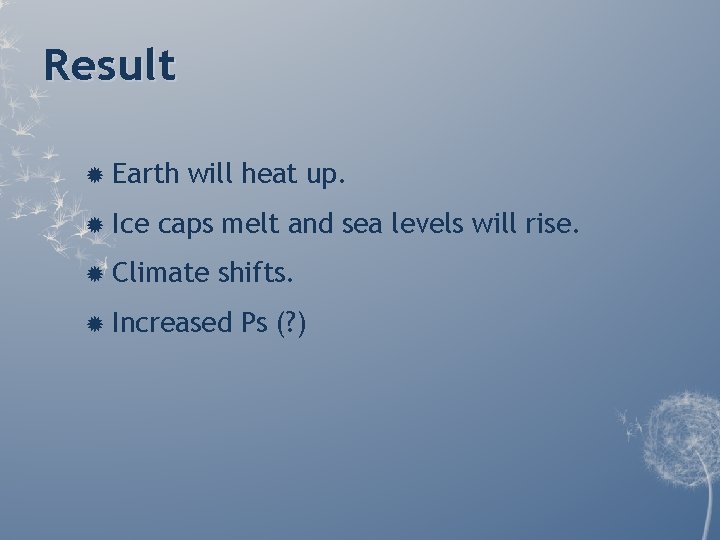
Result Earth Ice will heat up. caps melt and sea levels will rise. Climate shifts. Increased Ps (? )
Exotic Species When transplanted species are too successful and upset the ecosystem in new areas. Ex: Starlings Fire Ants Carp Inv a spe sive c web ies site
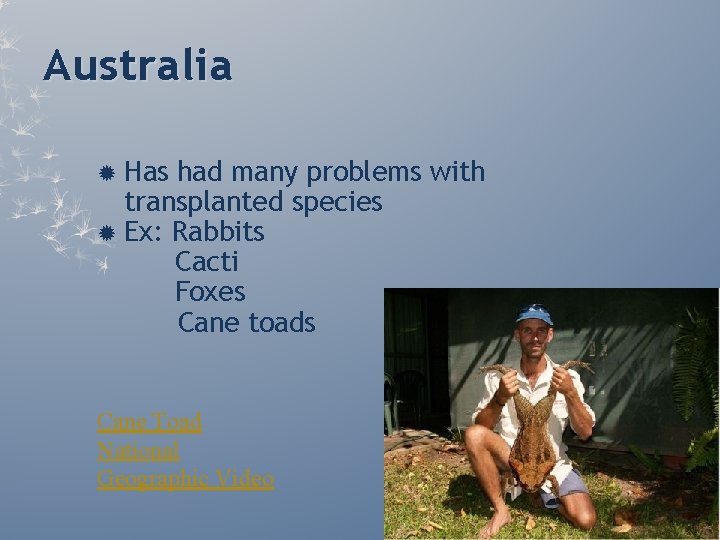
Australia Has had many problems with transplanted species Ex: Rabbits Cacti Foxes Cane toads Cane Toad National Geographic Video
Summary Identify the trophic levels of ecosystems. Recognize the flow of energy through food chains and food webs. Recognize the calculations used in measuring productivity. Recognize how productivity and energy transfers can be diagramed in pyramid form. Recognize that matter cycles in ecosystems. Identify the concept of Biological Magnification. Recognize several current environmental concerns.