Energy and the New Reality Volume 1 Energy


- Slides: 113

Energy and the New Reality, Volume 1: Energy Efficiency and the Demand for Energy Services Chapter 6: Industrial L. D. Danny Harvey harvey@geog. utoronto. ca Publisher: Earthscan, UK Homepage: www. earthscan. co. uk/? tabid=101807 This material is intended for use in lectures, presentations and as handouts to students, and is provided in Powerpoint format so as to allow customization for the individual needs of course instructors. Permission of the author and publisher is required for any other usage. Please see www. earthscan. co. uk for contact details.

Major Industrial Sectors - Iron & Steel - Aluminum - Copper - Cement - Glass - Pulp & Paper - Plastics - Petroleum refining - Chemicals (including fertilizers – Chapter 7) - Food processing (Chapter 7) - General manufacturing

Figure 6. 1 Industrial Energy use in 2005 as a percent of total energy use in various regions

Figure 6. 2 a Industrial energy use in OECD countries in 2005 Note: “Non-metallic minerals” includes the production of cement

Figure 6. 2 b Industrial energy use in non-OECD countries

As seen in the preceding two slides, a large part of total industrial energy use (~ 2/3) is in the production of processed materials from raw materials (steel, aluminium, cement, chemicals, plastics, paper products)

Figure 6. 3 Global primary energy use for production of the 12 commodities (other than the production of fuels) using the most energy

Definitions: • Primary metals: made from virgin ores (raw materials) • Secondary metals: recycled from scrap • Feedstock energy: The energy content of fossil fuels that become part of the material in a commodity (such plastics). It is equal to the heating value (that is, the heat released when it is burned)of the final product • Process energy: energy (in the form of heat or electricity) used to power a chemical transformation. It is equal to the total energy inputs to the production process minus the heating value of the final products • Embodied energy: the total amount of energy (process + feedstock) that went into making something

Figure 6. 4: Trends in production of major commodities (solid lines use the left scale, dashed lines the right scale)

Processing of Minerals • Most minerals of interest occur as oxide minerals in ores (rock bodies with various minerals mixed together, besides the ones of interest) • For example, iron ore consists of the iron oxide minerals hematite (Fe 2 O 3) and magnetite (Fe 3 O 4) mixed in with mineral grains consisting of alumina (Al 2 O 3) and silica (Si. O 2) and possible others • The “grade” of an ore is the mass fraction of the metal in the ore. For example, iron ore might consist of 80% iron oxide minerals, and within these minerals, the mass fraction of iron is 69% for hematite and 73% for magnetite, so the grade of the iron ore would be ~ 0. 8 x 0. 7 = 56% (typical grades for iron ore are 30 to __70%, but only 1 -2% for copper ores)

Processing of Minerals (cont’d) • The steps in processing minerals are thus – separation of the minerals of interest from the other minerals in the ores, done by grinding followed by some separation technique (higher grade ores tend to have larger mineral grains, so less grinding is needed to separate them and less energy is required) - removal of oxygen from the minerals (reduction) - purification (easier if we’re starting from higher grade ores)

Reduction of oxide minerals to make pure metals produces CO 2 because a C-containing fuel is used (today) as the reducing agent. • Iron: 2 Fe 2 O 3 +3 C → 4 Fe+3 CO 2 • Aluminum from alumina (made first from bauxite): 2 Al 2 O 3 + 3 C → 4 Al+3 CO 2 • Copper from cuprite (made first by roasting Cucontaining minerals): 2 Cu. O+C→ 2 Cu+CO 2

In the case of iron, aluminum and copper, the C used for reduction comes from fossil fuel inputs, or from materials (such as C anodes) made from fossil fuels, and so is accounted for in the energy use data combined with the emission factors (kg. C/kg fuel) for these energy inputs. Thus, fossil fuel energy inputs play two roles in producing Fe, Al, or Cu: – as a source of C for the reduction reaction and as a source of heat (through combustion) to drive the reaction.

In the case of calcination of limestone in making cement or in transformation of the raw materials for glass into glass, there is C in the raw materials that reacts to form CO 2 and is released to the atmosphere: • Calcination of limestone to make cement: Ca. CO 3→Ca. O+CO 2 • Production of glass: n. Si. O 2 + m. Ca. CO 3 + x. Na 2 CO 3 +. . → Glass + CO 2

As this CO 2 comes from non-fuel inputs rather than from the fossil fuel inputs, it is not accounted for in the energy use data. Thus, you will find that national CO 2 emission data are given separately for coal, oil, natural gas, and production of cement. In sum, there are 2 sources of CO 2 emissions associated with the production of cement and glass: - from the chemical reactions involving non-fuel inputs, and from the burning the fossil fuels used to power the chemical reactions.

Iron and Steel

Figure 6. 5 a: World production of primary + secondary raw steel

Traditional Steps in Making Steel: • • Beneficiation of iron ores (removal of impurities) Agglomeration of fine particles Reduction of iron ore to make crude iron Refining of crude iron to make steel (removing impurities, adding trace elements) • Shaping of steel into final products

Reduction of iron ore • Commonly done in a blast furnace • C from coke (which is like charcoal, and made from coal by driving off volatile materials) and coal is used as a reducing agent • Theoretical minimum energy requirement is 6. 8 GJ/t • Practical lower limit is 10 GJ/t, best blast furnaces use about 12 GJ/y, world average is about 14. 4 GJ/t • The output is pig iron, which is contaminated with about 4 -5% C and other impurities

Blast furnace and related units: Blast furnace placed in an installation 1. Iron ore + limestone sinter 2. Coke 3. Elevator 4. Feedstock inlet 5. Layer of coke 6. Layer of sinter pellets of ore and limestone 7. Hot blast (around 1200 °C) 8. Removal of slag 9. Tapping of molten pig iron 10. 17. Coke oven

An alternative to reduction of liquid iron ore in a blast furnace is to reduce fine iron minerals in the solid state by reacting them with a mixture of CO and H 2 that is produced from natural gas or coal. This produces direct reduced iron (DRI). One can go one step further and use H 2 as the reducing agent, with the H 2 produced electrolytically from renewably based electricity. The net reduction reaction for hematite would be: Fe 2 O 3 + 3 H 2 2 Fe + 3 H 2 O

Production of DRI using natural gas requires about 25% less energy than producing pig iron in a blast furnace, and further reduces CO 2 emissions because the emission factor for natural gas is ~ 13 kg. C/GJ vs ~ 25 kg. C/GJ for coal. Using pure H 2, the energy requirement is reduced by 40% and, as long as the H 2 is produced from Cfree energy sources, eliminates CO 2 emissions both for the reduction reactions and in supplying the heat to drive the reactions.

Refining (purification) of iron The iron is turned into crude steel by refining it in a basic oxygen furnace, in which the C in the iron is oxidized to CO 2 and various impurities are removed. This step actually generates energy – the oxidation of the C contamination in the iron releases energy. To avoid overheating, steel scrap will be added and melted along with the iron, so we get some “free” processing of scrap too.

Source: da Costa et al. (2013, J. Cleaner Prod)

Scrap steel is already in elemental form (~ pure Fe) and so does not need to be reduced, and instead needs only be melted and poured into new shapes to be re-used. The melting is done in an electric arc furnace (EAF) which, as the name suggests, largely uses electricity. The energy requirement (as electricity) is quite small (< 4 GJ/t in the most-efficient EAFs, compared to 15 -20 GJ/t to make crude steel from virgin iron ore in a blast furnace). However, scrap steel invariably has contaminants or other problems, so some pig iron or DRI has to mixed in with the scrap steel in the EAF.

Trend in best-practice EAF energy use (GJ/t) compared to theoretical and practical minimums and average use in India and US (early 2000 s) Source: IIASA, Global Energy Assessment (2014)

Shaping of Steel, Traditional Method Produce steel in cubical blocks, small bars, or slabs using a continuous caster, then convert into final products using various hot mills (heating and cooling occurs between steps, with an energy loss each time) This step uses ~ 2 GJ/t, mostly as heat from burning fossil fuels

Shaping of Steel, Alternative approaches: Cast the molten steel closer to the desired final shape, using thin-slab casting, thin-strip casting, or powder metallurgy • Thin-strip casting has the potential to reduce energy use for shaping by 90 -95% • In thin-strip casting, the length of the production line has been reduced from 500 -800 m to 60 m – about a factor of ten reduction!

Steel Summary: Primary Energy Requirements • Primary Steel (from virgin ores): - 36 GJ/t world average today, assuming electricity supplied at 40% efficiency • Secondary Steel (from pure scrap): - 7 GJ/t world average today – a reduction by about a factor of 5 compared to primary steel

Steel Summary (continued): • Current average with 32% recycled steel: 26. 3 GJ/t • Future average with 90% recycled steel and current best practice as average: 6. 9 GJ/t This is a reduction by almost a factor of 4 • Future average with 90% recycled steel, best projected energy intensities for primary and secondary steel: 5. 9 GJ/t This is a reduction by a factor of 4. 5 • All of the above plus 60% electricity supply efficiency instead of 40%: 4. 5 GJ/t This is a reduction by a factor of ~ 6 • Thus, the overall potential reduction in the average primary energy intensity of steel is a factor of 4. 5 to 6

Aluminium

Figure 6. 11 a World production of primary aluminium

Figure 6. 11 c End uses of aluminium in the US in 2003

Production of Aluminium • Mining of bauxite (mostly Al(OH)3 and Al. O(OH)) (most of the mining is through strip mining) • Refining of bauxite into alumina (Al 2 O 3) -grinding, then digestion with caustic soda at high temperature and pressure • Smelting of alumina into aluminium, through electrolysis of alumina that has been dissolved into cryolite (Na 3 Al. F 6) at 900 o. C -both the cathode and anode are made of C -the net reaction is 2 Al 2 O 3+3 C→ 4 Al+3 CO 2, so this is the reduction step – occurs after refining rather than before it (as in production of iron)

Smelting step (continued) • Like any electrolysis process, an electrolyte is required – the material that conducts ions between the anode and cathode in order to complete an electrical circuit • The electrolyte used is Ca. F 2, which can react at the anode (when there are problems in the operating conditions) to produce CF 4 and C 2 F 6 (referred to as PFCs or perfluorinated hydrocarbons) • PFCs are extremely strong GHGs (about 7000 and 19000 times stronger than CO 2 on a molecule-by-molecule basis) and have average lifespans in the atmosphere of 50, 000 and 10, 000 years, respectively • Strong measures have been taken to reduce PFC emissions per tonne of primary aluminum • There are no PFC emissions in producing secondary Al (recycled from scrap)

Figure 6. 12 Aluminium Mass Flow in 2005 From this diagram it can be seen that a little over 5 t bauxite are mined for every tonne of primary aluminium that is produced Source: IAI (www. world-aluminium. org)

Figure 6. 14: World average electricity use for the production of aluminium

Figure 6. 15 Efficiencies of individual processes in producing aluminium Source: Thekdi (2003, Aluminum 2003, The Minerals, Metals & Materials Society, 225– 237)

Figure 6. 16: World production of primary and secondary aluminium, and the secondary share of total production

Aluminium Primary Energy Requirements • Primary aluminium: - 193 GJ/t world average today, assuming electricity supplied at 40% efficiency • Secondary aluminium: - 17 GJ/t world average today – more than a factor of 10 smaller than for primary aluminium • Average of the above (with 18. 7% recycled) is 160. 3 GJ/t (more than 5 times that of steel)

Aluminium Summary (continued): • Future average with 90% secondary and current average energy use separately for primary and secondary Al: This is a reduction by a factor of 4. 6 • Future average with 90% secondary, best projected energy intensities for primary and secondary steel: This is a reduction by a factor of 6. 9 • All of the above plus 60% electricity supply efficiency instead of 40%: This is a reduction by a factor of 8. 4 34. 5 GJ/t 23. 3 GJ/t 19. 1 GJ/t • Thus, the potential reduction in the average primary energy intensity of aluminium is a factor of 5 to 8

Copper

Figure 6. 17 b Copper mining in 2007

Figure 6. 17 c End uses of copper in the US in 2003

Production of Copper Metal • Copper minerals occur either as oxides (combined with CO 3 or Si. O 2) or as sulfides (combined with S). • A given ore body tends to have oxide minerals in the upper zone (close to air) and sulfide minerals in the lower zone • There are two different production routes: Hydrometallurgy (acid related) – tends to be applied to oxide minerals Pyrometallurgy (heat related) – tends to be applied to sulfide minerals • In the transition zone of the ore body, either technique can be applied, but there has been a shift to more use of hydrometallurgy

Steps in Pyrometallurgy (1): • Extraction from the mine, crushing, and grinding • Froth flotation – mix with chemical foaming agents, as ore minerals adhere to bubbles and float to surface and can be skimmed off. Produces a concentrate of 25 -30% copper, mostly Cu. Fe. S 2. • Smelting – heating the concentrate in oxygen-enriched air to 1200 -1250 o. C, with addition of silica (Si. O 2), partially oxidizing the Fe and S, releasing SO 2 gas, and producing a molten copper matte (Cu 2 S*Fe. S) and molten slag (Fe. O*Si. O 2): Cu. Fe. S 2 + O 2 + Si. O 2 → Cu-Fe-S + Fe. O*Si. O 2 + SO 2 + heat

Steps in Pyrometallurgy (2): • Converting – separating the Cu 2 S from the Fe. S in the copper matte and oxidizing the S. Produces blister copper (99% copper) and further iron slag Cu 2 S + O 2 → 2 Cu° + 2 SO 2 + heat 2 Fe. S + 3 O 2 + Si. O 2 → 2 Fe. O • Si. O 2 + 2 SO 2 + heat The smelting and converting reactions are exothermic – and the heat released is sufficient to maintain the required temperature once the process has started. This eliminates the need for fuel energy in state-of-the-art smelters & converters, but requires continuous rather than batch processing.

Steps in Pyrometallurgy (3): • Fire refining. This is a process for removing most of the remaining O and S and, like previous steps, is carried out at a temperature of about 1200 o. C. The O is removed as CO 2 through reaction with a hydrocarbon reducing agent (typically 5 -7 kg per tonne of copper), while S is removed as SO 2 through reaction with atmospheric oxygen. Fire refining is carried out in special rotating furnaces that are heated by combusting hydrocarbon fuels. The liquid product is directly cast into thin anodes that are interleaved with cathodes in electro-refining cells. The copper anodes still contain about 0. 15% O and 0. 002% S.

Steps in Pyrometallurgy (4): • Electro-refining. This is an electrolysis process that involves electrochemically dissolving copper from impure copper anodes into a Cu. SO 2 -H 2 SO 4 -H 2 O electrolyte and electroplating pure copper from the electrolyte onto a cathode without the impurities. After 7 -14 days the cathodes are removed from the cell and the pure metal is scrapped off. The reactions are: Cuºanode → Cu 2+ + 2 e- at the anode, and Cu 2+ + 2 e- → Cuº at the cathode.

Steps in Hydrometallurgy: • Leaching – excavate ores, pile in a heap, and add acid to dissolve the ore, or drill holes into the ore body and pump in acid, and weeks to months later, pump out the leachate • Concentration – add organic solvents to the acid solution, to selectively absorb copper from the solution • Refining – an electrolysis process called electrowinning, similar to electro-refining except that the anode consists of an inert Pb-Sn-Ca mixture. The copper is electroplated onto the cathode from the Cu solution supplied from the concentration step rather than supplied by dissolution of a copper anode. The combination of acid leaching and electro-winning is called the solvent-extraction electro-winning process, or SX-EW.

Copper being purified in an electrolytic bath (not sure if this is electrorefining or electro-winning). In any case, a lot of electricity is used. Source: Kerr (2014, Science 343: 722 -724)

As previously noted, SX-EW (hydrometallurgy) is being used more and more. There are three disadvantages with this process: • Any gold, silver, or molybdenum in the ore is lost • The fraction of the Cu present in the ore that can be extracted is much less than using pyrometallurgy • Electro-winning requires much more electricity (18002800 k. Wh/t) than the electro-refining process (300 -400 k. Wh/t) used in pyrometallurgy

On the other hand, hydrometallurgy only requires crushing the mined ore to a 10 -13 cm size, rather than grinding it down to the size of individual mineral grains (100 -200 μm) (as in pyrometallurgy). The grinding stage is very energy intensive. If 20 k. Wh of electricity are required per tonne of ore, the amount require per tonne of copper is 20 k. Wh/(copper fraction in the ore). Thus, for ore with 1% copper (a grade of 1%), the grinding energy requirement is 2000 k. Wh/tonne – comparable to the energy used for electro-winning (1800 -2800 k. Wh/t) in the hydrometallurgy route.

Thus, the amount of energy used in producing copper increases rapidly with decreasing grade of ore. This is because mining and concentrating the Cu account for 1/3 to 1/2 half of the total energy used in producing the pure metal for 1% ores, in contrast to iron and aluminum, where the metal concentrations in the ores are high (4050% for Al, 60 -70% for Fe) and mining and concentrating are a very small fraction of the total energy use

Figure 6. 19 Estimated primary energy requirement to produce rolled copper tubes

Table 6. 12: Average grade of the remaining Cu ores in different parts of the world Source: Giurco (2005, Towards sustainable metal cycles: The case of copper’, Ph. D Thesis, Department of Chemical Engineering, University of Sydney)

Energy Use in Producing Secondary Copper • Depends strongly on the extent to which the scrap copper is contaminated with other materials • Purest copper can be simply melted and recast • Less pure copper is re-melted and cast as anodes, followed by electro-refining • Impure copper must be smelted and converted

Figure 6. 20 Flowchart for refining and smelting of contaminated copper Source: Davenport et al (2002, Extractive Metallurgy of Copper, Elsevier Academic Press, Amsterdam)

Energy requirements for recycling Cu: • ~ 4 GJ/t for Grade 1 scrap • ~ 20 GJ/t for Grade 2 scrap (≥ 94% Cu) • ~ 50 GJ/t for Grade 3 scrap (contaminated) By comparison, 80 -90 GJ/t are required for 1% ore and ~ 180 GJ/t for 0. 3% ore So: - recycling saves a lot energy, potentially reducing the energy requirement by a factor of 45 (comparing clean scrap against primary copper from low-grade ores) - sorting of copper and other materials to avoid contamination is very important – makes a huge difference in the energy requirement for recycling!

Figure 6. 21 a Global production of primary and secondary copper, and scrap flow

Figure 6. 22 Distribution of the copper stock in the US of 238 kg person

Figure 6. 21 b Global recycling rate of scrap copper

This dismal picture will likely change soon, as Cu mining is expected by some analysts to peak in about 20 years, due to supply constraints

A projection of the future rise and fall of global copper supply Source: Kerr (2014, Science 343: 722 -724)

Ways to limit demand for copper: • More compact and smaller housing – less length of wire needed • Smaller growth in electricity demand • Replacement of copper with glass fibre in telecommunications • Replacement of copper with PVC pipes in plumbing (PVC pipes are less energy-intensive)

Cement

Figure 6. 24 a World cement production

Figure 6. 24 b Cement production in 2007

Production of Cement • Crushing, grinding, and blending of raw materials into a homogenous powder • Heating the raw materials to over 1400ºC in a kiln to produce clinker • Grinding the clinker to a fine powder and mixing it with additions to form cement Concrete is a mixture of about 10% cement and 90% aggregates (sand gravel), with cement serving as the binding material. When stronger concrete is required, the proportion of cement is increased, so this increases the embodied energy of the concrete (as cement is the energy-intensive part of concrete).

Traditional cement is called Portland cement (named after the Peninsula Portland in England). It consists of about 95% clinker, which is produced by heating the raw materials in a kiln and then grinding the resulting product to a very fine powder (the other 5% is gypsum) The binding properties of cement occur when it is mixed with water, which forms hydrated molecules that cling to each other. The binding requires materials with a high surface area (which is why the clinker must be ground to a very fine powder) and materials that can form hydrates. This is relevant to the possibility of producing lowerenergy alternatives to traditional Portland cement. These alternatives include: - slags generated during the production of pig iron and DRI - fly ash from coal powerplants (but we will be phasing out the use of coal) - some volcanic materials

Current national average energy use for producing cement: • • • Theoretical minimum for clinkering: 1. 67 GJ/t Japan, 3. 1 GJ/t Germany, 3. 8 GJ/t European average, 4. 1 GJ/t China, 5. 0 GJ/t India, 5. 0 GJ/t Canada, 5. 1 GJ/t USA, 5. 5 GJ/t Columbia, 6. 1 GJ/t World average: 4. 8 GJ/t

Note that, although the energy used to produce a tonne of cement is relatively small compared to other materials, we produce a lot of it! • • Steel: 1300 Mt/yr at 26. 5 GJ/t = 35 EJ Cement: 2600 Mt/yr at 4. 8 GJ/t = 12. 5 EJ Aluminum: 38 Mt/yr at 160 GJ/t = 6. 1 EJ N fertilizer: 90 Mt/yr at 42 GJ/t = 3. 8 EJ Total global industrial energy use in 2005: 87 EJ

Options for reducing energy use in making cement: • • Shifting from wet to dry kilns Better recovery of waste heat from kilns Improved grinding techniques Reducing the clinker portion (95% in Portland cement) by blending in other materials, such as -blast furnace slag -fly ash from coal-fired powerplants -volcanic materials -natural limestone (easy to grind) -ordinary quartz sand (hard to grind)

Figure 6. 26 Supply of fly ash and blast furnace slag Source: Humphreys and Mahasenan (2002, Toward a Sustainable Cement Industry, Substudy 8: Climate Change, World Business Council for Sustainable Development, Cement Sustainability Initiative, www. wbcsdcement. org

Other options: • Development of entirely new cements • Integrated production of cement and electricity (using waste heat at 300ºC from the clinker cooler) • Use of concentrated solar energy • Improved durability of cement (or of steel reinforcing) • Reduced use where feasible without compromising safety (i. e. , baffled basement walls)

Paper and Paper Products

Figure 6. 28 a Production of different kinds of paper and paper products

Figure 6. 28 b Production of paper and paper products by region

Figure 6. 29 Annual per capita paper consumption

Figure 6. 30 Rates of paper recycling

Production of Paper and Paper Products • • Acquisition of fibres Pulping Bleaching Manufacture of paper from pulp

Sources of Fibre for Paper: • Roundwood (wood removed from forests or other areas) • Sawmill residues • Discarded paper

Pulping Processes • Mechanical • Chemical • Semi-chemical

Mechanical Pulping • Breaks apart the wood by grinding • Both fibre and lignin are turned into pulp, so the pulp yield is high - 85% of the original wood mass. • Lots of heat is generated that can be used elsewhere in the paper mill

Chemical Pulping • Soften wood chips with steam • Then cook for several hours at 160 -170 o. C under pressure in a highly alkaline solution (contains Na. OH and Na 2 S) called white liquor • This dissolves the lignin, leaving only the fibres (40 -55% of the wood) to form pulp • The spent liquor (now called black liquor) and bark are burned to produce heat and electricity for use by the pulp and paper mill

Bleaching • Process of removing residual lignin from the pulp, which otherwise causes the pulp to be dark • Requires a chemical (Cl 2, Cl. O 2, H 2 O 2 or O 3) that oxidizes the lignin but not the fibre (cellulose and hemi-cellulose) • Cl 2 bleaching causes severe water pollution, so there is a move toward elemental chlorine-free (ECF) bleaching (using Cl. O 2) or totally chlorinefree (TCF) bleaching (using H 2 O 2 or O 3)

Steps in making paper from pulp • Addition of water sufficient to give a water: fibre ratio of 100: 1 (i. e. , a consistency of 1%). • Forming – spread stock over a wire screen, then remove sufficient water through gravity and suction to give a consistency of 20% • Pressing – increase consistency to 40 -45% by passing the sheet with felt through 3 -4 pairs of press cylinders • Drying – pass sheet through 40 -50 steam-heated cylinders, to give a consistency of 90 -95%

Options to reduce energy use per unit of paper made • Integration of pulp and paper mills • Heat recovery from mechanical pulping • Reductions in market demand for bleached paper products (through consumer awareness) • More efficient drying of initial pulp sheets • More efficient cogeneration of electricity and heat from the wood and pulp wastes • Increased recycling

Cogeneration in the pulp and paper industry • Currently very inefficient – only 10 -15% electrical efficiency, in part to avoid producing excess electricity because it can’t be sent to the grid in many jurisdictions due to monopolistic practices by power utilities • Potential electrical efficiency of 27 -30% (and 72% overall efficiency) with gasification of black liquor followed by combined-cycle power generation. Some problems still to be worked out • This could make the pulp and paper mill a net source of energy – this would be renewable, biomass-based energy

The energy balance in recycling of paper includes: • The net energy required to make paper from virgin fibres, taking into account the energy that can be produced from black liquor and forestry residues and the energy required to make any fertilizers that are applied to plantation forests • The energy that can be obtained from incineration of waste paper to cogenerate heat and electricity if it is not recycled (landfilling is totally out of the question) • The energy required during recycling of waste paper, including the energy required to collect waste paper and transport it to the recycling plant • The energy that could be supplied from the biomass that is saved when waste paper is recycled

Rough energy balance: • Paper from wood: gross energy requirement: Potential energy production: Net energy requirement: • Energy required to make paper from waste paper: ~ 29 GJ/t ~ 31 GJ/t -2 GJ/t ~ 20 GJ/t So, in terms of gross energy requirements, recycling gives only a 30% savings. However, in terms of net energy use, recycling increases the energy requirement.

There is, of course, more to it • Incineration of waste paper with cogeneration saves ~26 GJ/t of primary energy, so the overall energy gain with production of paper from virgin fibres and later incineration is ~ 28 GJ/t • BUT – for each tonne of waste paper that is recycled, 2. 2 tonnes of biomass are saved. • For the set of assumptions in Table 6. 29, this saves 52 GJ of primary energy, for a net energy gain of ~ 32 GJ/t • Thus, recycling is slightly better from an energy point of view, but for slightly different assumptions, it could be slightly worse.

Plastics

Energy Use in Making Plastics • Feedstock Energy: 20 -40 GJ/t • Process energy: 20 -120 GJ/t • Total energy: 50 -160 GJ/t Energy is used for heating the raw materials to up to 1000 o. C (to “crack” the hydrocarbon raw materials), for chilling (sudden cooling to as low as -150 o. C is needed for some of the reaction and separation steps), and for pumps and motors

Energy Savings Through Recycling • The feedstock energy is saved (except possibly for small material losses during the recycling process) • Some (often large) portion of the process energy is also saved (no need to crack hydrocarbons again) • Energy savings is typically 85 -90% according to the one source • Obstacle: the need to separate different kinds of plastic from one another

Figure 6. 36 Disposition of plastics waste in Europe Source: Plastics Europe (2008, The Compelling Facts about Plastics 2007: An Analysis of Plastics Production, Demand Recovery for 2007 in Europe, www. plasticseurope. org)

Where was this photo was taken?

Answer: in the middle of the Pacific Ocean, 1400 km north of Hawaii!

Eastern and Western Pacific Garbage Patches – about 3 -5 Mt each?

Floating debris occasionally washes ashore on Hawaii Urban runoff

Source: Law et al (2010, Science 329, 1185)

Source: Law et al (2014, Env Sci & Techn 48: 4732 -4738)

Contents of the gut of an albatross, killed by ingesting floating plastic garbage

Micro-plastic particles are also a serious problem Source: Law and Thompson (2014, Science 345: 144 -145)

For more information, go to www. greatgarbagepatch. org

Downcycling and Recycling

The previous discussion has highlighted the extreme importance of recycling of materials to reduce energy use. • Steel: 36 GJ/t vs 7 GJ/t today • Al: 190 GJ/t vs 17 GJ/t today • Cu: 90 GJ/t using ores at 1% grade 180 GJ/t with 0. 3% grade ores 4 GJ/t recycling pure Cu, 50 GJ/t ______highly contaminated Cu • Plastics: 50 -160 GJ/t, recycling saves the feedstock energy and greatly reduces process energy

However, there is almost no recycling at all in our society. Instead, we do downcycling, whereby materials are re-used not in the same kind of product but as a product with less exacting composition requirements. For example, the highquality steels used in machinery does not get recycled into new machinery, but rather, might become part of new structural steel in buildings or infrastructure. Aluminimum cans are not recycled as new Al cans.

There are two reasons for this: • The existence of dozens of different alloys of metals such as steel and aluminum, which are all mixed together when scrap is collected, and • Contamination of one kind of material with other materials (such as copper, Al and plastic mixed in with steel when cars are shredded for recycling)

When different alloys are mixed together • The composition of the resulting mixture does not correspond to that of any given alloy • The scrap steel (for example) needs to be with steel made from virgin ores in order to dilute the concentration of unwanted elements down to acceptable levels for the intended use of the recycled steel. • The alloy elements in the steel (such as Cr, Mn, Mg, Zn) are themselves lost in the sense that they are not in materials where they have needed value, and so need to be replaced.

Distinguish between: recovery rate – fraction of EOL (end-of-life) materials that is collected for recycling recycled fraction – the fraction of new material that is made from collected EOL materials If demand is growing, then even if we had 100% recovery of materials that were made 20 years ago and are now being discarded, the recycled fraction will be < 100% - because 100% of the smaller production from 20 years ago would not match current production

Conversely, if we had a steady-state economy with an unchanging stock of materials, where the only new materials made are to replace worn-out materials, then 100% collection of EOL materials would match the demand for new materials. However, unless we had perfect sorting by alloy and no contamination that mattered, we would still have to mine new minerals and dilute the scrap, while at the same time we would be stockpiling (or discarding) scrap that we cannot use (we would no longer be able to funnel unusable alloy scrap down to lower-value uses, because scrap from those uses would have become more available too)

What would be needed for near 100% recycling? • Identifying the allow composition of every component of every thing we make, for future generations when the disassemble it • Carry out a much higher degree of separation of scrap materials than is done today • Get the well sorted materials to the specific places where they can be re-used In other words, a complete reorganization of much of the industrial production process would be needed – and the barriers to this happening are largely behavioural (and economic), not technical
 Energy energy transfer and general energy analysis
 Energy energy transfer and general energy analysis
 Cardiac output
 Stroke volume ejection fraction
 Solute
 Lung capacity
 Volume kerucut = .....x volume tabung *
 Evaluation of large volume parenterals
 Hình ảnh bộ gõ cơ thể búng tay
 Bổ thể
 Tỉ lệ cơ thể trẻ em
 Gấu đi như thế nào
 Thang điểm glasgow
 Chúa sống lại
 Các môn thể thao bắt đầu bằng tiếng đua
 Thế nào là hệ số cao nhất
 Các châu lục và đại dương trên thế giới
 Công thức tính độ biến thiên đông lượng
 Trời xanh đây là của chúng ta thể thơ
 Mật thư anh em như thể tay chân
 Làm thế nào để 102-1=99
 Phản ứng thế ankan
 Các châu lục và đại dương trên thế giới
 Thể thơ truyền thống
 Quá trình desamine hóa có thể tạo ra
 Một số thể thơ truyền thống
 Cái miệng bé xinh thế chỉ nói điều hay thôi
 Vẽ hình chiếu vuông góc của vật thể sau
 Biện pháp chống mỏi cơ
 đặc điểm cơ thể của người tối cổ
 Thứ tự các dấu thăng giáng ở hóa biểu
 Vẽ hình chiếu đứng bằng cạnh của vật thể
 Tia chieu sa te
 Thẻ vin
 đại từ thay thế
 điện thế nghỉ
 Tư thế ngồi viết
 Diễn thế sinh thái là
 Dot
Dot Bảng số nguyên tố lớn hơn 1000
 Tư thế ngồi viết
 Lời thề hippocrates
 Thiếu nhi thế giới liên hoan
 ưu thế lai là gì
 Khi nào hổ con có thể sống độc lập
 Khi nào hổ mẹ dạy hổ con săn mồi
 Sơ đồ cơ thể người
 Từ ngữ thể hiện lòng nhân hậu
 Thế nào là mạng điện lắp đặt kiểu nổi
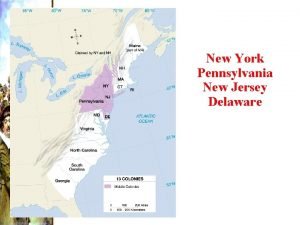
 New york pennsylvania new jersey delaware
 New oil and new wineskin
 Strengths of articles of confederation
 Kotler e keller
 New classical and new keynesian macroeconomics
 Chapter 16 toward a new heaven and a new earth
 Leanne keene french ambassador arrives from paris
 New classical and new keynesian macroeconomics
 Cefrcv
 Virtual reality output devices
 Appearance vs reality merchant of venice
 Zoos connect us to the natural world
 What is ironic contrast
 Augmented reality: principles and practice
 Vision focuses on the current reality and maintaining it
 Shapes that have smooth even edges and are measurable
 Shadow reality
 Pros and cons of virtual reality in healthcare
 Np-complete problems and physical reality
 Hilda tresz
 Split speech example
 Marquee new hartford ny
 New-old approach to creating new ventures
 Njbta
Njbta Venn diagram roosevelt taft wilson
 Pressure x volume = energy
 Control volume analysis
 Glasser's basic needs
 Virtual reality modeling language
 Augmented reality big data
 Freudian ideas
 Ultimate reality
 The process of making an expectation a reality.
 Excess reagent def
 Hp reveal studio
 The thomas theorem
 Product placement reality tv
 Wdep model
 What does this
 Oman drydock company logo
 Humanistic approach
 Characteristics of metaphor
 Tom campbell experiments
 Theme of macbeth
 Ego reality principle
 Reality therapy questions
 Capturing reality documentary
 The sacramental nature of reality
 Gestalt therapy techniques examples
 Jacob kounin quotes
 Reality therapy
 Dsm 5 vs dsm 4
 Narrative vs reality
 Project dtf reality kings
 Pathogram theory
 View of human nature in reality therapy
 Reality assumption
 Transactional analysis group therapy
 Reality of assent
 Virtual reality remote maintenance
 Augmented reality architecture diagram
 Make augmented reality business card
 Ciri ciri augmented reality
 Augmented reality table
