Angelina Njegu Full Professor at Singidunum University Course


")


 § Configured to: • collect • manipulate • store •")
 • Support operational processes that constitute the core business and")


 – Provides")

 is a set of theories,")

: – A fully normalized data")
 - Describes processing at operational")


 OLAP Servers (Tier 2) Clients (Tier")
 is a system that pulls")


 between every pair of adjacent levels")


.")


 vs. Massively Parallel Processing (MPP) systems • Symmetric Multi-Processing (SMP) is")
 • Massively Parallel Processing (MPP) is the coordinated processing of")


")
 • DMS does the following: – Transfers data to and")


 is a multinational")


 Exercise")
 Tool & Integration with Data.")


- Slides: 100
Angelina Njeguš | Full Professor at Singidunum University
Course Modules Data Warehouse for Business Intelligence 01 | Introduction 05 | Data Warehouse Feed Project 02 | Data Warehouse Development Lifecycle 06 | Real Time Data Warehouse 03 | Dimensional Modeling 07 | Data Warehouse Appliance 04 | Physical Design of Data Warehouse 08 | Access to Data Labs: Design and implementation of Business Intellligence BI Suite
01 | Introduction
Module 1 Overview • • • Relationship between main models, systems and technologies Definitions of BI and DWH Characteristics of a DWH Architectures of the DWH General architectural features of a DWH Organization in levels of a DWH DBMS architectures for DWH Reference architectures Basic characteristics of the main architectural components Principles of parallel architectures Lab exercises : 1, 2 and 3
The position of BI systems Source: Swindoll, 2011 (Available at: http: //www. pursuant. com/blog/tag/dikw-model/)
What is an information system? • Organised and integrated set of: – Database – Processes – Interfaces – Networks – Technologies – People Cloud Computing § that are correlated in order to: ú support and improve everyday business operations ú support decision-making and improve overall business effectiveness.
Types of Information Systems Business Operations Support Operations Information Systems Transaction Processing Systems Business Process Management Systems Processing Business Systems for Process Modelling, Simulation, Transactions Execution, Control and Optimisation Geographic Information Systems Expert Systems Intelligent Maps Emulates Expert Problem Solving Business Intelligence Systems Decision making support Office and Collaboration Systems Management Information Systems Decision Support Systems Executive Information Systems Office and Team and Workgroup Collaboration Systems Prespecified Reporting for Managers (OLAP cubes, Operational BI…) Interactive Decision Support (Data Mining method analysis. . . ) Critical Information for Senior Management (BSC, KPI, Strategic BI …) Specialised Information Systems Knowledge Management Systems Virtual Reality Manage Organisational Knowledge 3 D Simulation of a Real or Imaginary Environment
Operations Information Systems (OIS) § Configured to: • collect • manipulate • store • process data into information, and support an organisation’s day-to-day business activities Data People Technologies Processes Any organised combination of … Communication networks Interfaces Policies and procedures
Operations Information Systems (OIS) • Support operational processes that constitute the core business and create the primary value stream • Typical operational processes are: – – Finance Manufacturing Marketing Human Resources. . . Source: Rosen, 2006
Business Intelligence Systems • Set of tools and systems for gathering, extracting, storing, analyzing and translating business information into knowledge to support decision-making and improve overall business effectiveness Information Operational data Knowledge workers
OIS vs BIS
Decisions
General architecture of Business Intelligence System
BI architecture
Why Business Intelligence? • • • ERP What happened? What is happening? Past Why did it happen? What will happen? What do I want to happen? CRM SCM 3 Pty Present Future Data
Frontend tools 16
BI Pyramid Complexity Executives, Top Managers Professionals, Problem solvers, Middle manager Front-line manager Transactors METRICS STRATEGIC KPIs, Scorecards, Dashboards PERFORMANCE, PRODUCTION TIMES, CUSTOMER CHURN TACTICAL OLAP, Mining, Forecasting SALES TOTALS, LEADS ANALYSIS, CLICK THROUGH RATIOS, BUDGETS Management Reports OPERATIONAL INVOICES, SHIPPING DOCUMENTS, PICK LIST REAL TIME Detailed Operational Reports Quantity
Types of Business Intelligence Systems • Operational BI: Management Information Systems (MIS) – Provides routine information to managers and decision makers – Primary focus is operational efficiency – Reports and displays – Example: daily sales analysis reports • Tactical BI: Decision Support Systems (DSS) – Used to support problem-specific decision making – Focus is on decision-making effectiveness – Interactive OLAP and ad hoc decision support, data mining method analysis, predictive analytics – Example: where to spend advertising dollars • Strategic BI: Executive Information Systems (EIS) – Critical information for executives and senior managers – Example: easy access to actions of competitors, BSC, KPI. . .
Bi users
Definition of Business Intelligence System • Business intelligence (BI) is a set of theories, methodologies, architectures, and technologies that transform information into knowledge for business purposes. • BI is an information system supports decision makers at different levels of organisation (operational, tactical, strategic levels).
Role of BI • Provide decision makers with the ability to understand (i. e. , the intelligence to gain insights into) the relationships of presented facts in the form of data, information, and knowledge in order to guide action toward a desired actionable goal (Thierauf, 2001)
Why BI systems? • Issues with transactional systems (OLTP): – A fully normalized data model can perform very inefficiently for queries. – Historical data are usually large with static relationships: – Unnecessary joins may take unacceptably long time – Historical data are diverse – Data volume rises – Number of customers rises – Database becomes complex and difficult to maintain
OLTP vs OLAP • OLTP (On Line Transaction Processing) - Describes processing at operational sites • OLAP (On Line Analytical Processing) - Describes processing at warehouse
OLTP vs OLAP § The database design for an OLTP application fits the relational model very well and they tend to be very normalized. § OLAP analyse data that are stored in data warehouse.
OLTP vs OLAP data model
OLAP System Architecture with tools Source: Kuper et al, 2008
Tiers Information Sources Data Warehouse Server (Tier 1) OLAP Servers (Tier 2) Clients (Tier 3) e. g. , MOLAP Semistructured Sources Data Warehouse extract transform load refresh etc. Analysis serve Query/Reporting serve e. g. , ROLAP Operational DB’s serve Data Marts Data Mining
What is data warehouse? • A data warehouse (DW) is a system that pulls together data from many different sources within an organization for reporting and analysis in order to support decision makers. • A data warehousing is a technique for collecting and managing data from varied sources to provide meaningful business insights.
What are Data Marts? • Data Warehouse: collects all information about subjects (customers, products, sales, assets, personnel) that span the entire organization • Data Marts: Departmental subsets that focus on selected subjects – Marketing data mart: customer, product, sales. . .
Characteristics of a Data warehouse § Subject-oriented multidimensional data: § § data are organized around the subject of decision making a multidimensional data model is denormalized § Integrated: store integrated data from many sources in consistent form § Time-variant: need more historical data, not just the current values § Non-updatable/non-volatile: data are added periodically
Denormalized data in DWH
Aggregate Functions • AVG • COUNT_BIG • MAX • MIN • STDDEV • SUM • VARIANCE. . .
Hierarchy • 1: M relation (via attribute relationships) between every pair of adjacent levels • Examples: – – Country-State-City Age-Gender-Customer Year-Quarter-Month How many quarters and months?
Facts/Measures § A fact table is the central table in a star schema of a data warehouse. § A fact table stores quantitative information for analysis i. e. measures or facts. § Facts are: - data columns (usually numeric) that can be used to perform calculations needed to answer business questions. - stored in Fact Tables or Base Tables - used to create metrics - business measurements (i. e. Dollar Sales, Units Sold, Gross Margin and etc. ) used by businesses to analyze and report their performance.
DW Architectures Dim. Sales. Person. Key Sales. Person. Name Store. City Store. Region Star Schema • A star schema has a single table for each dimension • Each table supports all attributes for that dimension Dim. Customer. Key Customer. Name City Region • Typically a de-normalized solution Dim. Product. Key Product. Name Product. Line Supplier. Name Fact. Orders Customer. Key Sales. Person. Key Product. Key Shipping. Agent. Key Time. Key Order. No Line. Item. No Quantity Revenue Cost Profit Dim. Date. Key Year Quarter Month Day Dim. Shipping. Agent. Key Shipping. Agent. Name
An example
Snowflake Schema • More normalized solution • Typically contains multiple tables per dimension • Each table contains dimension key, value, and the foreign key value for the parent Dim. Store. Key Store. Name Geography. Key Dim. Geography. Key City Region Dim. Customer. Key Customer. Name Geography. Key Dim. Product. Line. Key Product. Line. Name Dim. Sales. Person. Key Sales. Person. Name Store. Key Fact. Orders Customer. Key Sales. Person. Key Product. Key Shipping. Agent. Key Time. Key Order. No Line. Item. No Quantity Revenue Cost Profit Dim. Date. Key Year Quarter Month Day Dim. Shipping. Agent. Key Shipping. Agent. Name Dim. Product. Key Product. Name Product. Line. Key Supplier. Key Dim. Supplier. Key Supplier. Name
An example of the snowflake schema
Processing and Performance Considerations • Star schema requires de-normalization during the load process – Can impact the ETL times • Snowflake schema can increase dimension complexity – Can impact Analysis Services solutions, negatively affecting cube performance
Data warehousing process • Step 1: Determine Business Objectives • Step 2: Collect and Analyze Information • Step 3: Identify Core Business Processes • Step 4: Construct a Conceptual Data Model • Step 5: Locate Data Sources and Plan Data Transformations • Step 6: Data warehouse design (Denormalization, Defining hierarchies, Creating aggregations, Creating a logical model, Creating a physical model, Generating metadata) • Step 7: Loading and filling a data warehouse • Step 8: Set Tracking Duration
Extract, Transform & Load • Take data from a source, convert it into data for the warehouse: – import filters – read and convert from data sources – data transformations – join, aggregate, filter, convert data – de-duplication – finds multiple records referring to the same entity, merges them – profiling – builds tables, histograms, etc. to summarize data – quality management – test against master values, known business rules, constraints, etc.
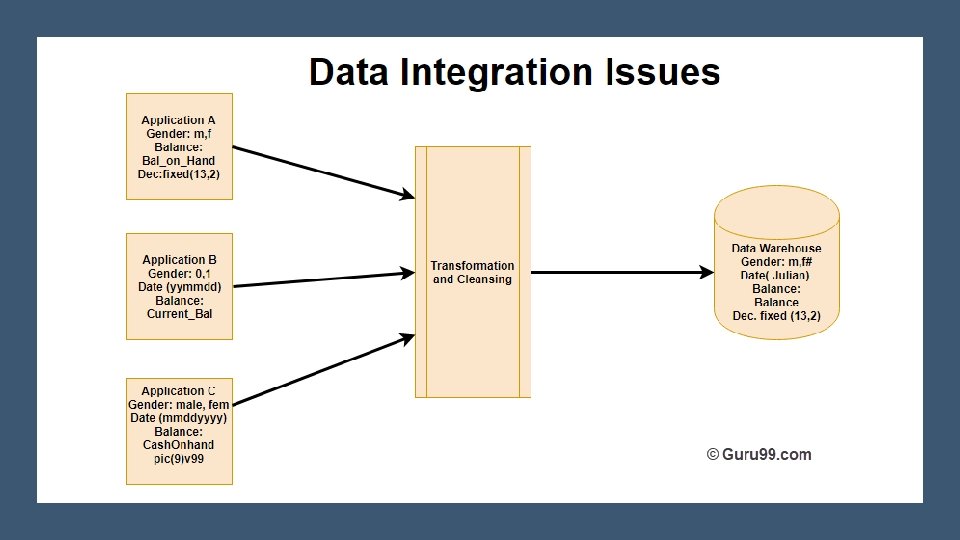
ETL transformation types • Transformation is an important step in the analytic workflow (80/20). • Transformations prepare the data for analysis. • Basic transformations: – Cleaning: Mapping NULL to 0 or "Male" to "M" and "Female" to "F, " date format consistency, etc. – Deduplication: Identifying and removing duplicate records – Format revision: Character set conversion, unit of measurement conversion, date/time conversion, etc. – Key restructuring: Establishing key relationships across tables
Advanced transformations • Derivation: Applying business rules to your data that derive new calculated values from existing data – for example, creating a revenue metric that subtracts taxes • Filtering: Selecting only certain rows and/or columns • Joining: Linking data from multiple sources – for example, adding ad spend data across multiple platforms, such as Google Adwords and Facebook Ads • Splitting: Splitting a single column into multiple columns – for example, date into day, month, year. • Data validation: Simple or complex data validation – for example, if the first three columns in a row are empty then reject the row from processing • Summarization: Values are summarized to obtain total figures which are calculated and stored at multiple levels as business metrics – for example, adding up all purchases a customer has made to build a customer lifetime value (CLV) metric • Aggregation: Data elements are aggregated from multiple data sources and databases • Integration: Give each unique data element one standard name with one standard definition. Data integration reconciles different data names and values for the same data element.
Typical issues of data sources • Incompatible data values - duplicated data have different values • Different data formats - dates or currency data can be stored in different formats • Incorrect data values • Synonyms and homonyms - words that are also written and pronounced, and have different meanings need to be renamed • Built-in process logic - eg, "00" value - the shipment was returned, "FF" the shipment was forwarded at the end of the month.
Source-to-target mapping document
ETL data flow
ETL OR ELT – WHICH APPROACH TO CHOOSE? 1. Data Volume 2. Frequency of Data Load 3. Sources and Destinations 4. Availability of Tools 5. Transformation responsibility 6. Flexibility to adopt new business rules 7. Scalability 8. Data 9. License fees 10. Available knowledge base and training needs
Dimensional modeling • The concept of Dimensional Modelling was developed by Ralph Kimball and is comprised of "fact" and "dimension" tables. • A Dimensional model is designed to read, summarize, analyze numeric information like values, balances, counts, weights, etc. in a data warehouse. • Fact - Facts are the measurements/metrics or facts from your business process. For a Sales business process, a measurement would be quarterly sales number • Dimension - Dimension provides the context surrounding a business process event. In simple terms, they give who, what, where of a fact. In the Sales business process, for the fact quarterly sales number, dimensions would be – Who – Customer Names – Where – Location – What – Product Name
Dimensional modeling • There are two types of tables involved: – Fact Table - a primary table in a dimensional model that contains • Measurements/facts • Foreign key to dimension table – Dimension table - contains dimensions of a fact. • • • They are joined to fact table via a foreign key. Dimension tables are de-normalized tables. The Dimension Attributes are the various columns in a dimension table Dimensions offers descriptive characteristics of the facts with the help of their attributes No set limit set for given for number of dimensions The dimension can also contain one or more hierarchical relationships
Industrial DW models
Symmetric Multi-Processing (SMP) vs. Massively Parallel Processing (MPP) systems • Symmetric Multi-Processing (SMP) is a tightly coupled multiprocessor system where processors share resources – single instances of the Operating System (OS), memory, I/O devices and connected using a common bus.
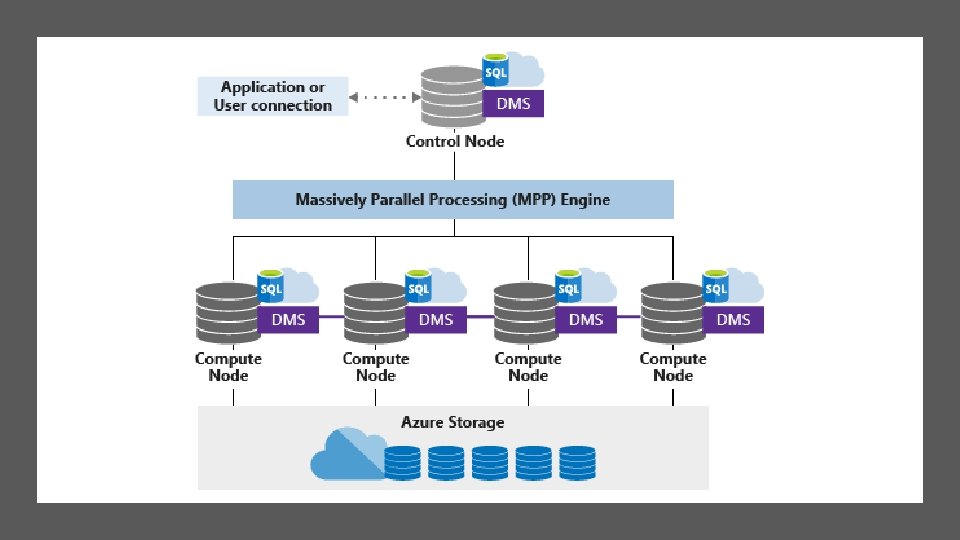
Massively Parallel Processing (MPP) • Massively Parallel Processing (MPP) is the coordinated processing of a single task by multiple processors, each processor using its own OS and memory and communicating with each other using some form of messaging interface. • MPP can be setup with a shared nothing or shared disk architecture. • In a shared nothing architecture, there is no single point of contention across the system and nodes do not share memory or disk storage. Data is horizontally partitioned across nodes, such that each node has a subset of rows from each table in the database. Each node then processes only the rows on its own disks.
Triggers for migrating from SMP to MPP • High Data Volume and Data Growth: With increasing sales and a growing customer base, the data volume has grown rapidly to cross 10 TB. • Longer Data Loading/ETL times: With the need to produce daily reports to management, the current ETL speed can be inadequate to intake and process the increasing quantity of data flowing from other OLTP and non-relational systems. • Slow Query Execution: Query execution times are slowing down due to the increase of data and it is becoming increasingly difficult to generate insights for daily reporting in a timely manner. • Long Cube Processing Time: With the current cube processing time, it is difficult to meet the real-time reporting needs of the company.
Distributed Tables • A distributed table is one where row data within the table is distributed across the nodes within the appliance to allow for massive scale. Each row ends up in a one distribution in one compute node.
Fact table distribution
Control Node • MPP Engine - the brains of the Massively Parallel Processing (MPP) system. It does the following: – Creates parallel query plans and coordinates parallel query execution on the Compute nodes. – Stores and coordinates metadata and configuration data for all of the databases. – Manages SQL Server PDW (Parallel Data Warehouse) database authentication and authorization. – Tracks hardware and software status.
Data Movement Service (DMS) • DMS does the following: – Transfers data to and from the SQL Server PDW nodes. – Processes query operations that require transferring data among the nodes. – Improves query performance by optimizing data transfer speeds.
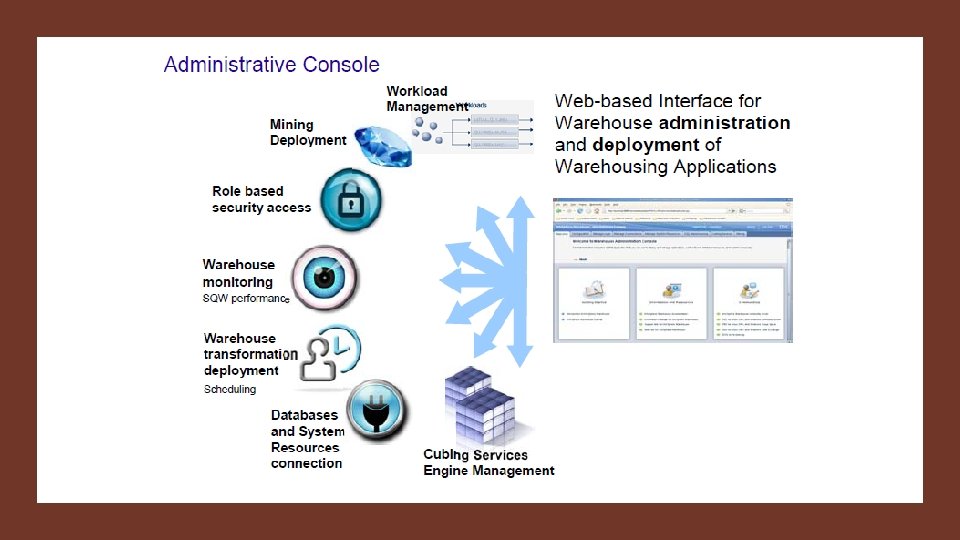
Control Node • Admin Console – The Admin Console is a web application that presents the appliance state, health, and performance information. • Configuration Manager – The Configuration Manager (dwconfig. exe), is the tool that appliance administrators use to configure Analytics Platform System.
Control node databases • SQL Server manages all of the databases on the Control node: – The Shell database manages the metadata for all distributed user databases. – Temp. DB contains the metadata for all user temporary tables across the appliance. – Master is the master table for SQL Server on the Control node.
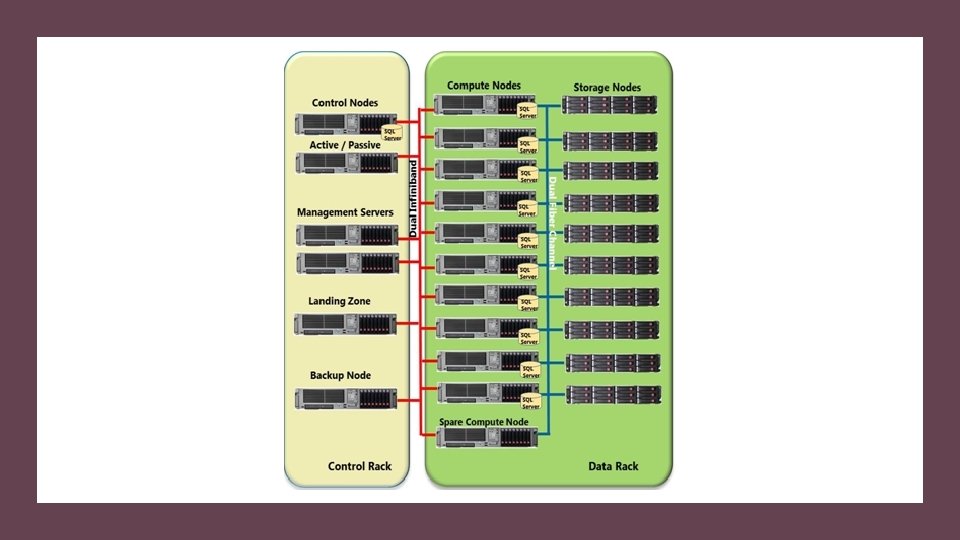
Compute Node • Compute Node – The Compute nodes are parallel data processing and storage units. They have direct attached storage and use SQL Server to manage user data. • Data Movement Service (DMS) runs on each Compute node to do the following: – As part of processing parallel queries, DMS transfer data to and from other Computer nodes and the Control node. – receives data loads in parallel. Data is loaded in parallel directly from the loading server to the Compute nodes – transfers data from each Compute node directly to the backup server. • Compute node databases Each Compute node runs an instance of SQL Server to process queries and manage user data.
02 | Data Warehouse Development Lifecycle
Module 2 Overview • Main risk factors in a DWH project • Business Dimensional Life Cycle by R. Kimball • Basic documents for definition of the requirements • Customer interview
Reasons of failure of business intelligence projects • Focusing mainly on technology instead of business needs, people and processes. • Do not define a scope or this is not accurate. • Undefined and difficult to structure requirements until they have been implemented. • Inability to structure a long-term sustainable architecture. • Impossibility to obtain medium/high quality data. • Lack of scalability and system evolution. • Do not consider future requirements, in terms of new users or data sources. • Must be able to zoom in order to see the details of the data, but without having to replicate the transactional system. • Over-detail (or granularity) of data can make the project an unapproachable problem.
Business Dimensional Life Cycle by R. Kimball • Kimball lifecycle diagram illustrates the flow of data warehouse implementation. • Activities may need to be customized to address the unique needs of the organization. • Not every detail of every lifecycle task will be required on every project - this has to be decided as per need. • As per Kimball Lifecycle, we start building a data warehouse with understanding business requirements and determining how best to add value to the organization. • The organization must agree on what the value of this data is before deciding to build a data warehouse to hold it. Once the requirements are gathered, implementation phase begins with design steps across three different tracks - technology, data, and BI applications. Once we are done with this implementation, the Lifecycle comes back together to deploy the query tools, reports, and applications to the user community. • The incremental approach of the Lifecycle helps to deliver business value in a short span of time and at the same time helps to build a enterprise wide information resource in a long term.
Business Dimensional Life Cycle by R. Kimball
Major pieces of documentation all data warehousing projects should have: • Business Requirements Document defines the project scope and high-level objectives from the perspective of the executive management team and the project sponsor. • Functional / Informational Requirements Document outlines the functions which users must be able to complete at the end of the project. This documentation will include use cases and focus on what information the users need from the warehouse. • Fact/Qualifier Matrix is a powerful tool that will help the team associate the metrics and dimension attributes to the metrics defined in the Business Requirements Document. • Data Model is a visual representation of the data structures of the data warehouse. Data models are visual aids used to ensure the data and reporting needs of the business are captured. Data models are also utilized by the DBAs to create the data structures which will hold the data. • Data Dictionary is a comprehensive list of data elements found in the dimensional model, their business definition and the source database name, table name and field name from which the data element was created. • Source to Target ETL Mapping Document is a list focusing on the target data structure and defining the source of the data (database name, table name and column name) and any transformation which the source element goes through before landing in the target table.
Defining Enterprise-Level Business Requirements Figure: Detail of sub-activities between initial scope and project requirements
The enterprise requirements definition process flow chart
Requirement Analysis
Data Warehouse Bus Matrix • This matrix maps your organizational business processes to the entities or objects that participate in those processes. • Each row in the matrix is a business process. Figure: Example enterprise bus matrix for a retail company
The Prioritization Process • The prioritization process is a planning meeting involving the DW/BI team, the DW/BI project business sponsors, and other key senior managers from across the organization. • In this meeting, you describe the business processes you identified in the enterprise requirements gathering process so everyone has an understanding of the full list of possibilities.
Business Requirements Example: Adventure Works Cycles • Adventure Works Cycles (AWC) is a multinational manufacturer and seller of bicycles and accessories. • The company is based in Bothell, Washington, USA and has regional sales offices in several countries.
1. Interview Preparation at Adventure Works Cycles • Review all the information about the Company that you could find: – – – strategy documents annual reports marketing plans competitive analyses presentations from senior management’s annual offsite planning meeting. . .
Adventure Works Cycles Basic Business Information • Transaction database is called Adventure. Works and is installed as part of the SQL Server samples. • It holds data from January, 2001 through June 30, 2004. • A few queries on this data reveal that Adventure Works Cycles is doing well, at least in terms of orders and growth. • The Grand Total line in Table 1 shows that orders have been increasing rapidly, tripling in 2002 and increasing almost 50 percent in 2003. Based on the first six months, 2004 looks like another banner year. • Adventure Works Cycles sells products in four major product categories: bikes, components, clothing, and accessories. Bicycles account for more than 80 percent of orders, with clothing and accessories making up about 4 percent.
Basic Business Information Table 1. AWC Product Orders by Category The Grand Total line in Table 1 shows that orders have been increasing rapidly, tripling in 2002 and increasing almost 50 percent in 2003. Adventure Works Cycles sells products in four major product categories: bikes, components, clothing, and accessories. Table 2. AWC Product Orders by Country/Region Bicycles account for more than 80 percent of orders, with clothing and accessories making up about 4 percent. Additional database queries tell us where their bike orders come from. Table 2 reveals that AWC has sales in six countries, with about 60 percent of orders coming from the United States.
Basic Business Information Table 3 AWC Product Orders by Sales Channel Table 4: Adventure Works Cycles Customers by Sales Channel Snapshot In terms of sales channels, Table 3 shows that the bulk of orders come from bicycle stores and distributors, also known as Resellers. As the DW/BI system manager, you should continue from here, researching top reseller customers and their historical buying patterns (seasonality, product lifecycle, and so on). Investigate the Internet customers as well because you have demographic information on them that tells you who are they, what they buy, and where they come from.
Interview Planning: AWC organisational chart
2. AWC Enterprise Business Requirements • Example Interview Summary – – – Interviewee: Brian Welker, VP of Sales Date: 7/25/2005 Interviewer: Joy Mundy Scribe: Warren Thornthwaite Additional attendees: Stuart Ozer, Carolyn Chau, Joy Byrd, Dave Wong • Roles and Responsibilities – Brian Welker is head of the sales organization. He’s responsible for sales to Resellers, which was $37 million last year, or about 70 percent of total sales. He has 17 people who report to him, including 3 regional sales managers. Brian is excited about his team and eager for them to be successful. They are all “bike freaks” who love to ride bikes and love to talk about them—perfect bike sales people. Brian is measured on achievement of the total Reseller sales target for the year.
Information Requirements • The major analytic areas that Brian works with are as follows: – Sales planning: § Planning for the year begins in the fall of the previous year with the Sales planning process. § Sales territories are based on geography. § All new customers are assigned to a sales territory when they place their first order based on where they are located. § Sales planning includes looking at the following: – Growth analysis: Overall market, new products, new geographies, new sales people. – Customer analysis: Who are the top customers, how have they changed over the last year? – Territory analysis: Where are top customers located, what are the current sales territories, and how balanced are they? How does this map to sales regions? – Sales performance – Basic sales reporting. . .
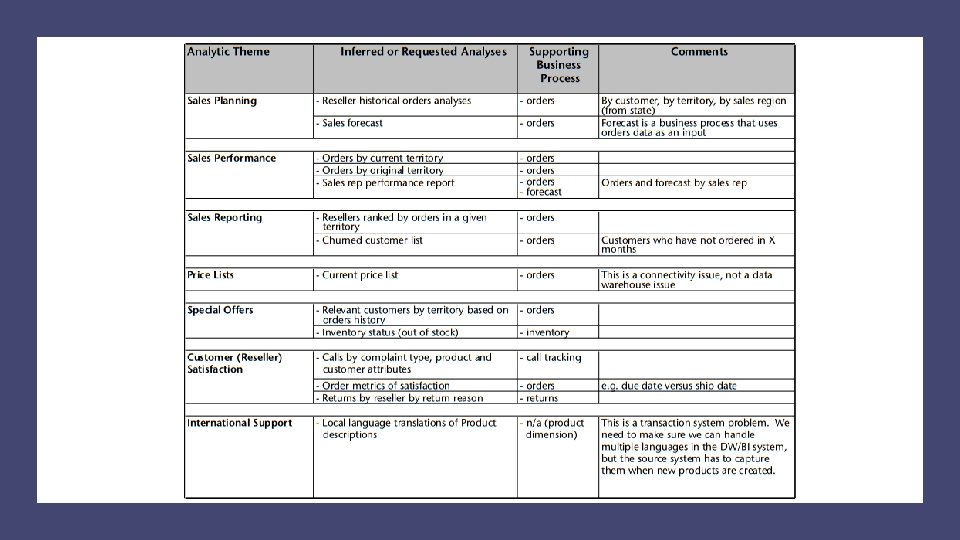
3. Analytic Themes and Business Processes • Group similar requirements into common analytic themes. – For example, Sales Planning is an analytic theme that is supported by information from the orders business process. • Most of the following requirements could be met with data from the orders business process: – – – – – Sales planning input Basic sales reporting Special offers Production forecast input Product planning and monitoring Internet customer demographics (with a well-designed customer dimension) Customer profiling Customer loyalty program Standardized currency reporting
Business Processes Derived from Interview
AWC Bus Matrix The bus matrix shows the business processes and the dimensions needed to support them.
The AWC Prioritization Process
Lab Exercises Exercise 1 – A Tour of the Design Studio (30 min) Exercise 2 – Creating a Physical Data Model in Design Studio (60 min) (5 points) Exercise 3 – Creating and Executing Data Flows (90 min) (7 points)
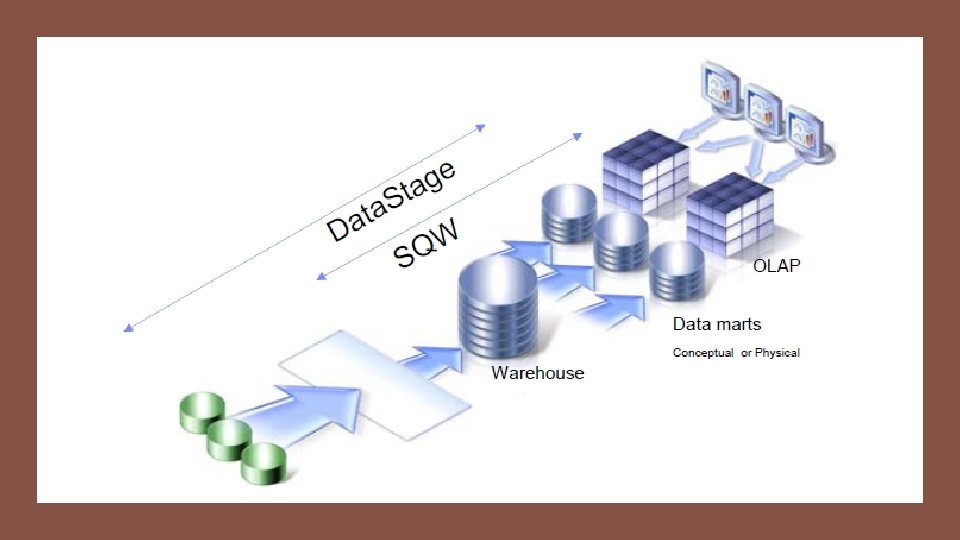
Info. Sphere Warehouse Foundation Technologies • SQL Warehousing (SQW) Tool & Integration with Data. Stage – The SQL Warehousing Tool provides Data Movement and Transformation capabilities based on and optimized for the DB 2 engine. – Transformations and Data Movement jobs are developed in a fully integrated graphical interface within the Design studio. • Data. Stage is an Enterprise ETL that allows integration of data across multiple systems and processing high volume of data. – – – Data. Stage increases the ETL capability of SQW Allows a more deeper analysis of data Extracts from a wider range of data sources (Oracle, SAP, People. Soft, …) into the ISW System. Provides cleansing and advanced ETL Data. Stage works in Tandem with SQW
Info. Sphere Warehouse Topology: 3 -tier Architecture
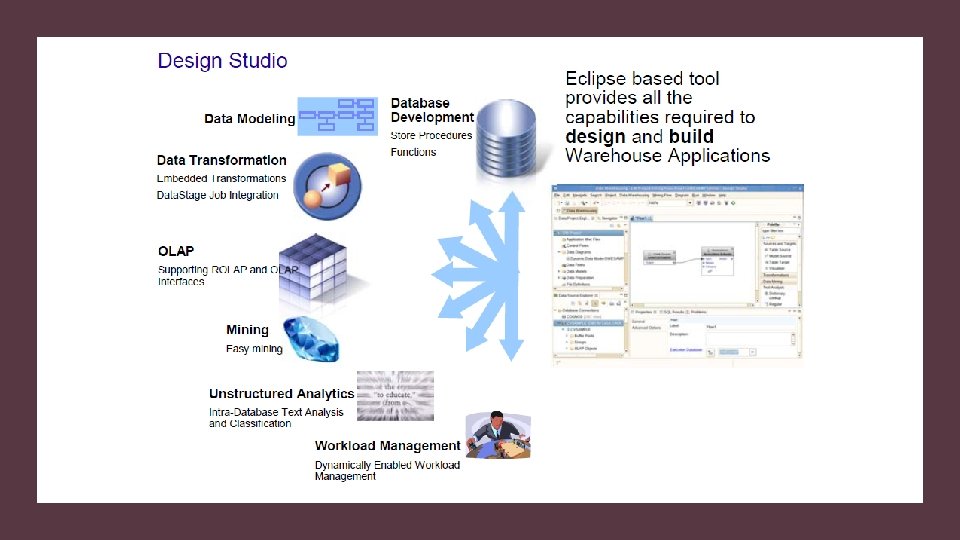
A Tour of the Design Studio
The Data Warehousing Perspective
Exercise 3 – A Tour of the Design Studio • In this exercise, you will: – Open new perspectives – Rearranged dockable windows – Change preferences of the Design Studio – Create a database connection – Expand restore Views
Physical Data Modeling Overview • Physical data model defines data elements for the target – Tables – Views – Primary keys and foreign keys – Stored procedures – Table spaces – And more…
The Data Model A Data Model is required to provide relational table metadata to Data Flows
Data Source Explorer
Info. Sphere Warehouse Physical Data Model Structure