Dear Sir Dear Mr Dear Professor Dear Jack
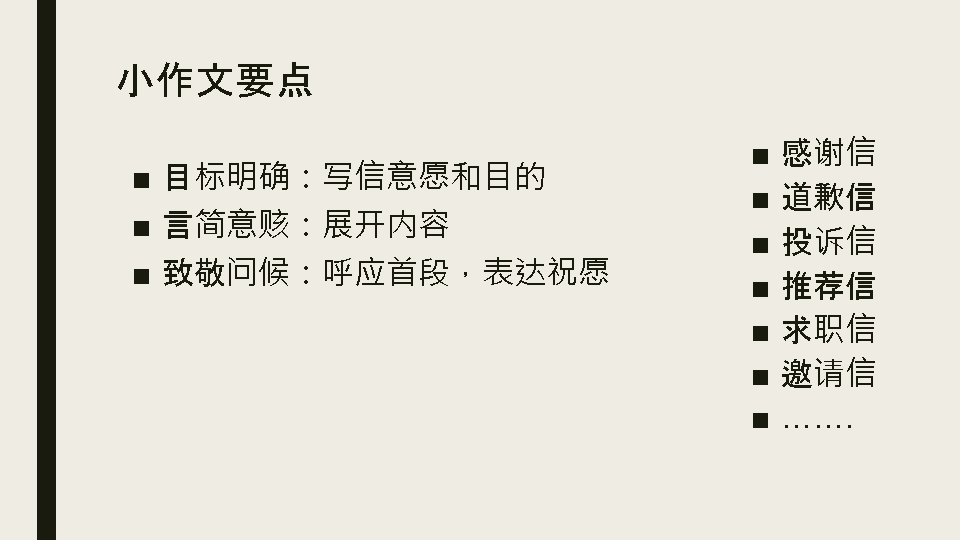

- Slides: 44
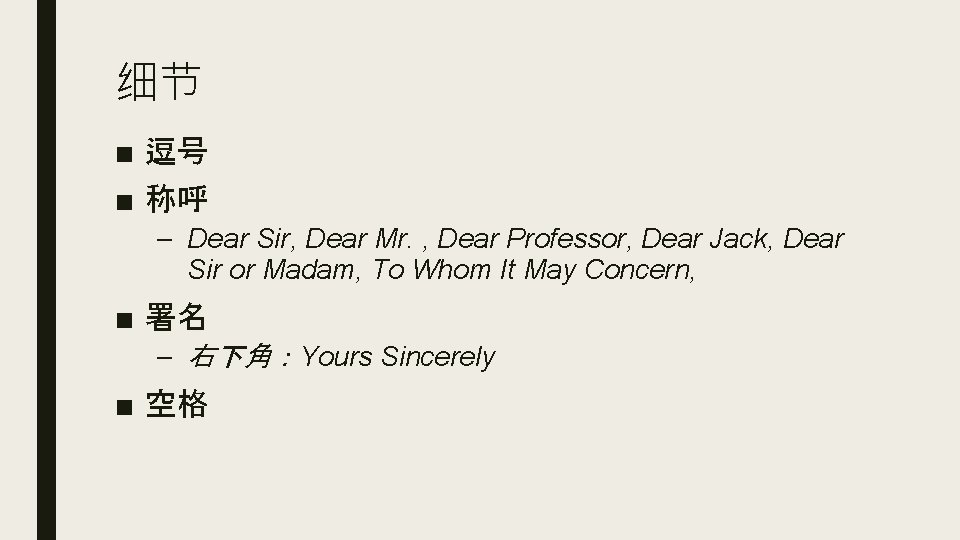
细节 ■ 逗号 ■ 称呼 – Dear Sir, Dear Mr. , Dear Professor, Dear Jack, Dear Sir or Madam, To Whom It May Concern, ■ 署名 – 右下角:Yours Sincerely ■ 空格
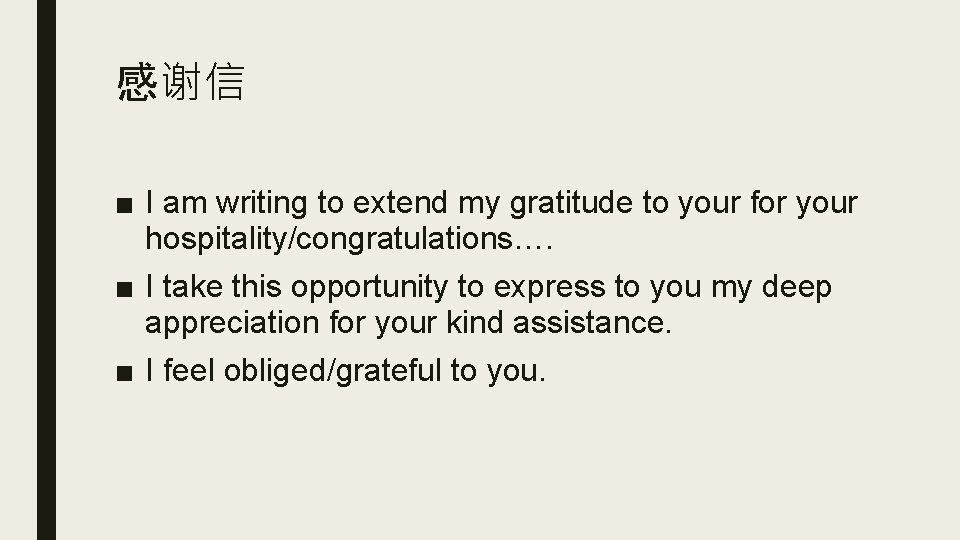
感谢信 ■ I am writing to extend my gratitude to your for your hospitality/congratulations…. ■ I take this opportunity to express to you my deep appreciation for your kind assistance. ■ I feel obliged/grateful to you.
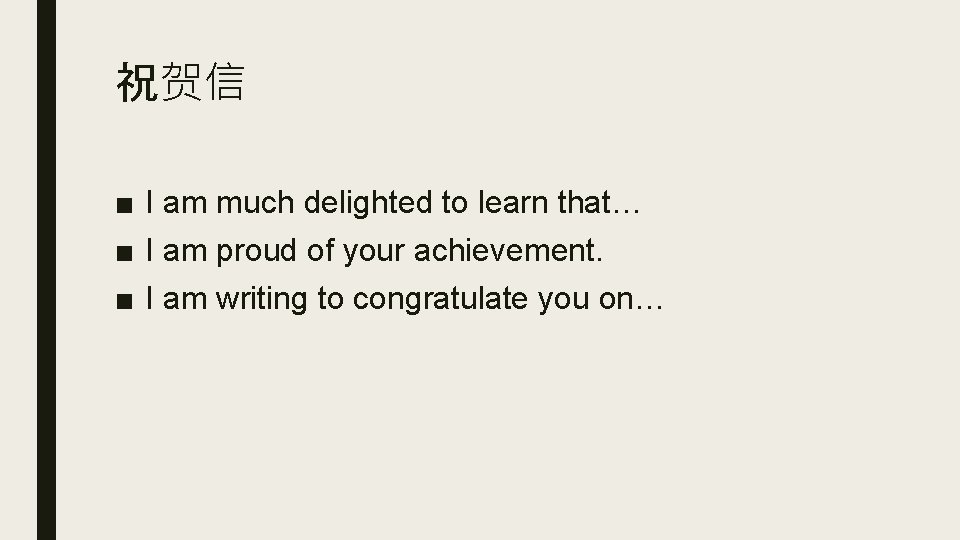
祝贺信 ■ I am much delighted to learn that… ■ I am proud of your achievement. ■ I am writing to congratulate you on…
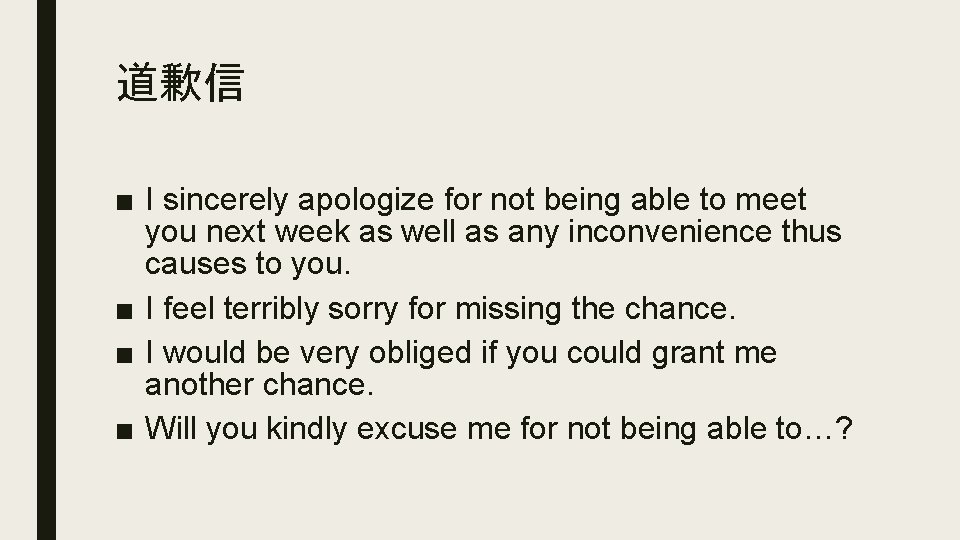
道歉信 ■ I sincerely apologize for not being able to meet you next week as well as any inconvenience thus causes to you. ■ I feel terribly sorry for missing the chance. ■ I would be very obliged if you could grant me another chance. ■ Will you kindly excuse me for not being able to…?
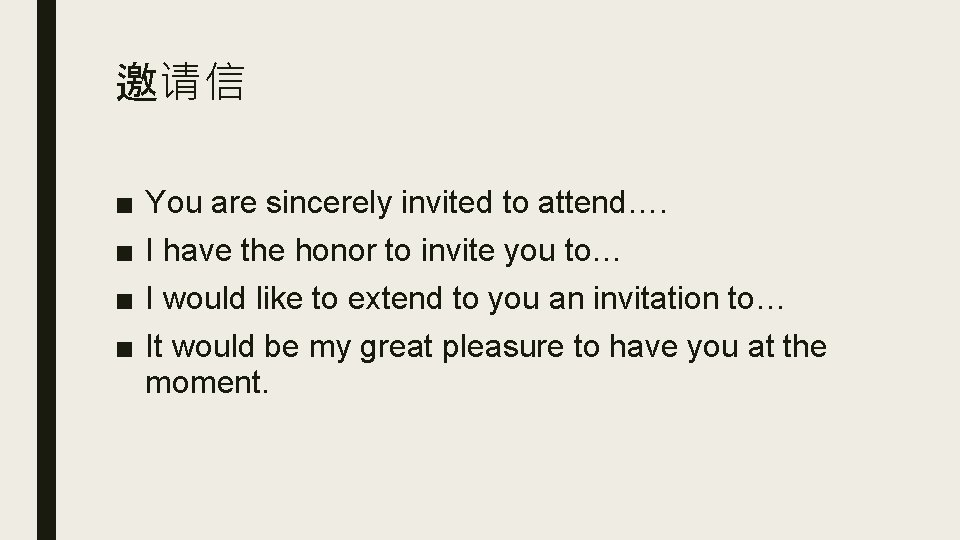
邀请信 ■ ■ You are sincerely invited to attend…. I have the honor to invite you to… I would like to extend to you an invitation to… It would be my great pleasure to have you at the moment.
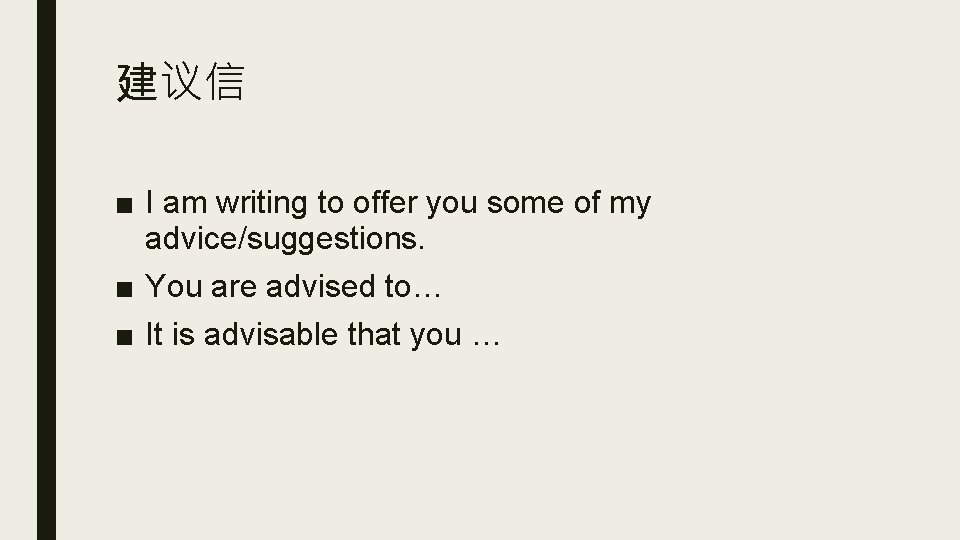
建议信 ■ I am writing to offer you some of my advice/suggestions. ■ You are advised to… ■ It is advisable that you …
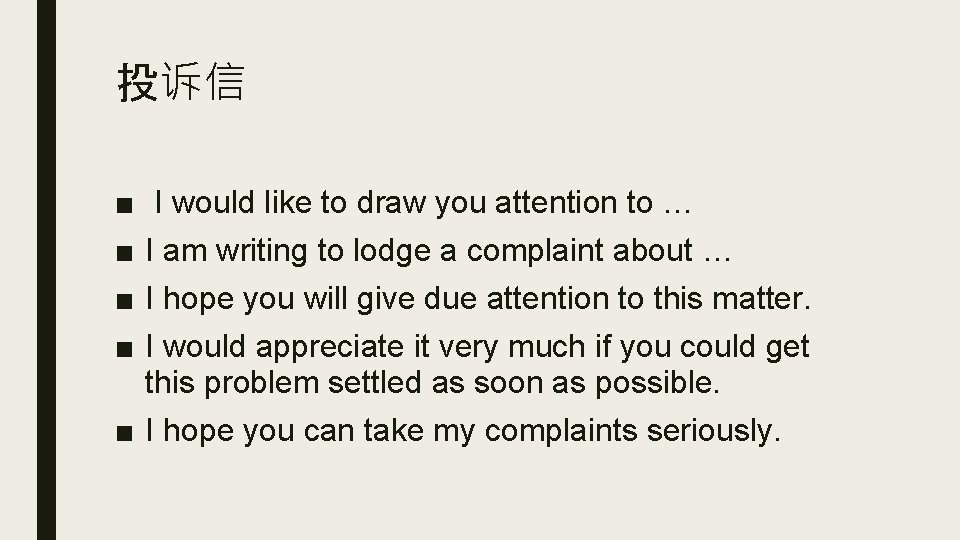
投诉信 ■ ■ I would like to draw you attention to … I am writing to lodge a complaint about … I hope you will give due attention to this matter. I would appreciate it very much if you could get this problem settled as soon as possible. ■ I hope you can take my complaints seriously.
推荐信 ■ I take great pleasure in recommending to you…. ■ I strongly recommend… to you with no reservation. ■ Motivated, energetic, reliable, cheerful, confident, diligent, smart, responsible, independent, potential ■ In closing, it is my belief that …is competent for…
Notice ■ To improve…. , a lecture is going to be held…. ■ All the teachers and students are welcome to attend the lecture. ■ Students’ Union
Feedback Dear Professor Williams, Thanks for you invited me to deliver a lecture on the Chinese culture to the international students, I feel more than happy to accept it. In this letter, I’d like to share the Chinese festival to the international students. Firstly, I will talk about the Chinese festival culture comes from, which it is mysterious. Secondly, I will extend to you what the Chinese people to do in festival, it is very special. Thirdly, I will describe to you the Chinese festival food looks like and how to cook it. I think this lecture will very helpful to the students, if you have some suggestions, please feel free to let me know. I’m looking forward to your respond! Best regards,
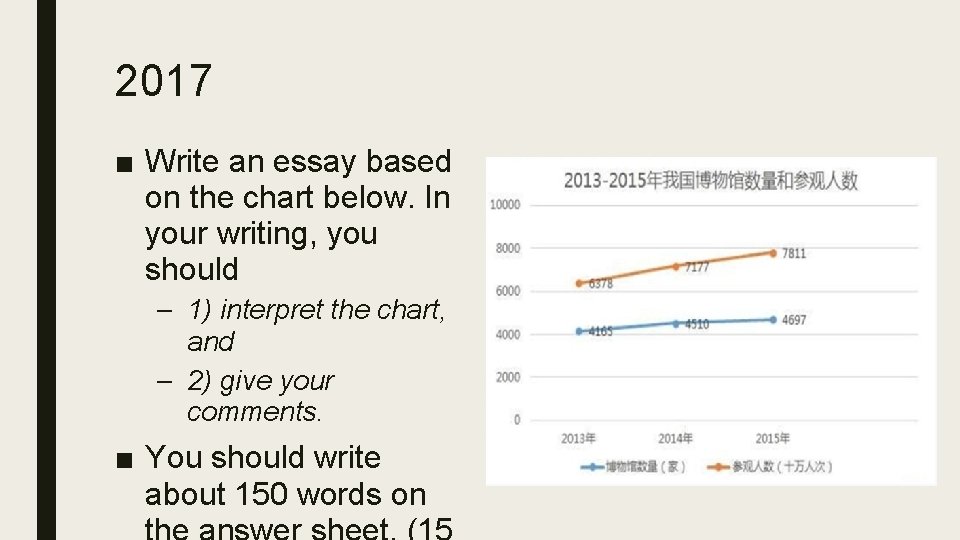
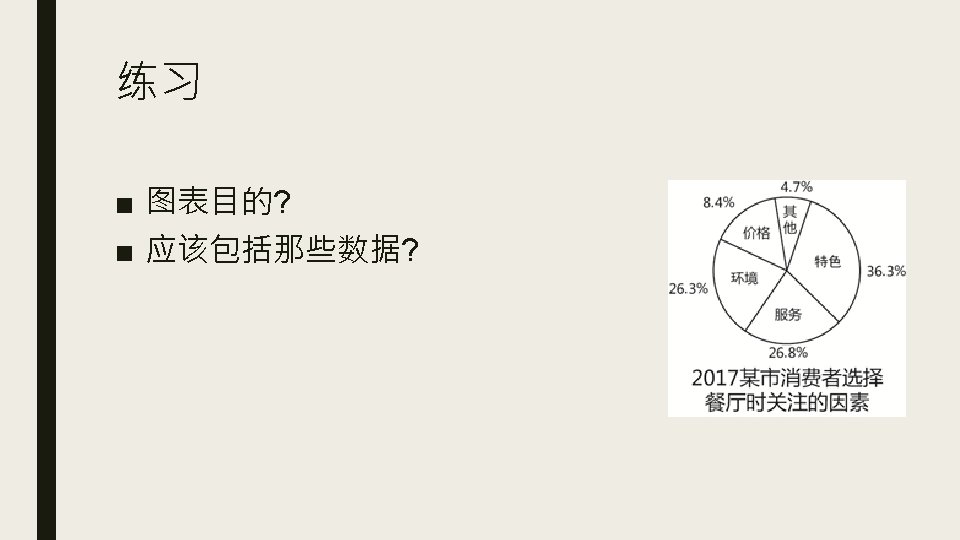
2017 ■ Write an essay based on the chart below. In your writing, you should – 1) interpret the chart, and – 2) give your comments. ■ You should write about 150 words on
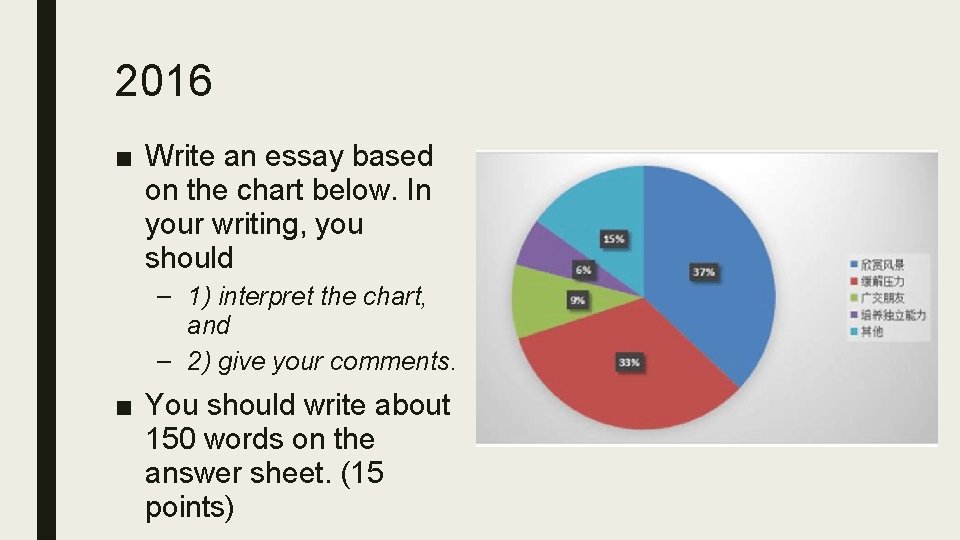
2016 ■ Write an essay based on the chart below. In your writing, you should – 1) interpret the chart, and – 2) give your comments. ■ You should write about 150 words on the answer sheet. (15 points)
My expectations ■ ■ Be complete. Be correct. Be clear. Be concise.
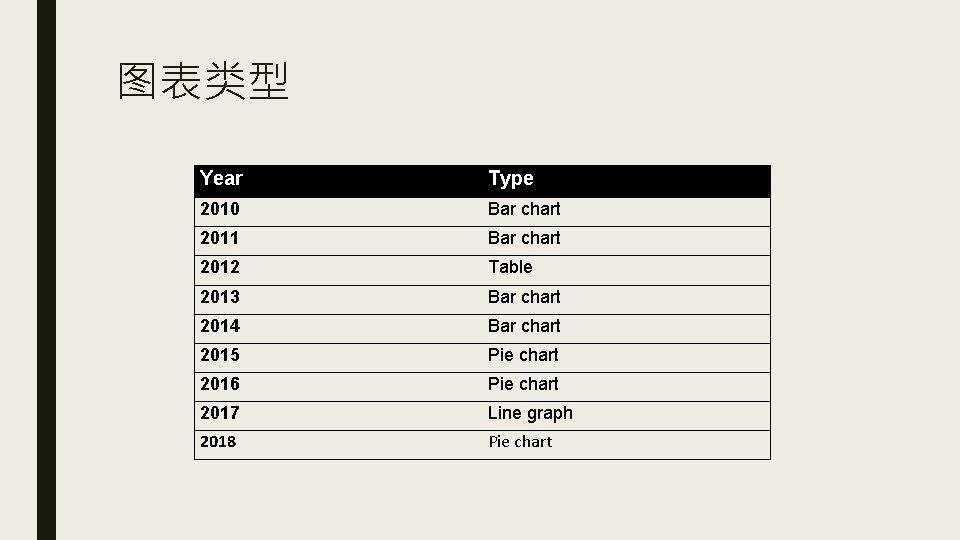
图表类型 Year Type 2010 Bar chart 2011 Bar chart 2012 Table 2013 Bar chart 2014 Bar chart 2015 Pie chart 2016 Pie chart 2017 Line graph 2018 Pie chart
描述什么? ■ Purpose ■ Details: trend + statistics ■ Comparison
Vocabulary Verb Noun Rise Go up Grow Increase Ascend Jump Soar Surge Mount Increase Rise Growth Jump surge
Vocabulary Verb Noun Decline Fall Decrease Drop Descend Sink Plunge Decrease Decline Fall Drop
■ Stabilization: – Level off at… – Stabilize at… – Remain stable at… ■ Ups and downs: – Fluctuate – Rise and fall – Up and down
■ Typical points: – Peak, the highest point, the top – Bottom, the lowest point ■ Degrees of change – Suddenly, rapidly, dramatically, significantly, steadily, gradually, slightly, remarkably, sharply, considerably, noticeably,
■ Percentages – Account for, occupy, make up, constitute ■ 达到某一数量 – Arrive at/get to/reach/amount to/hit ■ Times – 中国人口是美国的四倍。 ■ 表示“大约” – Approximately, around, roughly, just over/below,
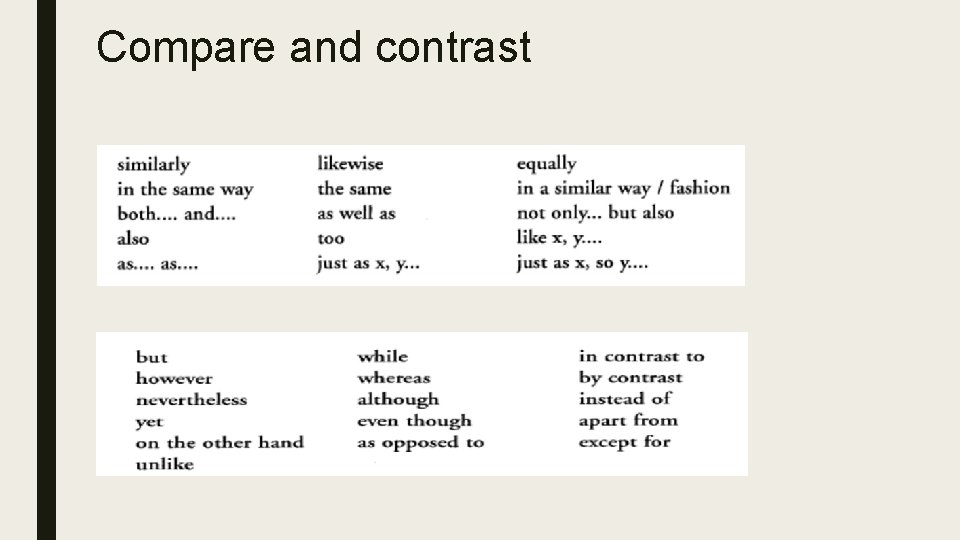
Compare and contrast
■ Preps – By – From…to… – At ■ How to describe: – Trend + statistics – Tense
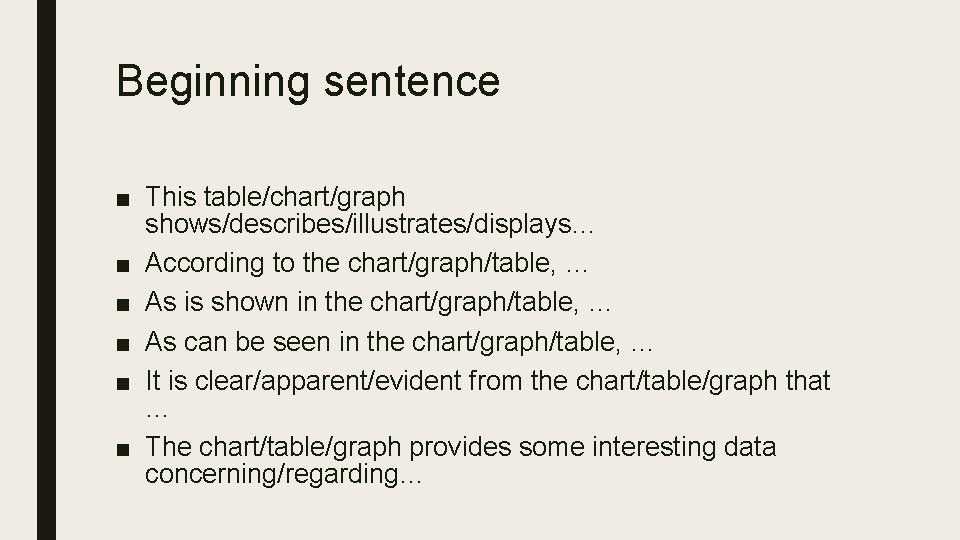
Beginning sentence ■ This table/chart/graph shows/describes/illustrates/displays… ■ According to the chart/graph/table, … ■ As is shown in the chart/graph/table, … ■ As can be seen in the chart/graph/table, … ■ It is clear/apparent/evident from the chart/table/graph that … ■ The chart/table/graph provides some interesting data concerning/regarding…
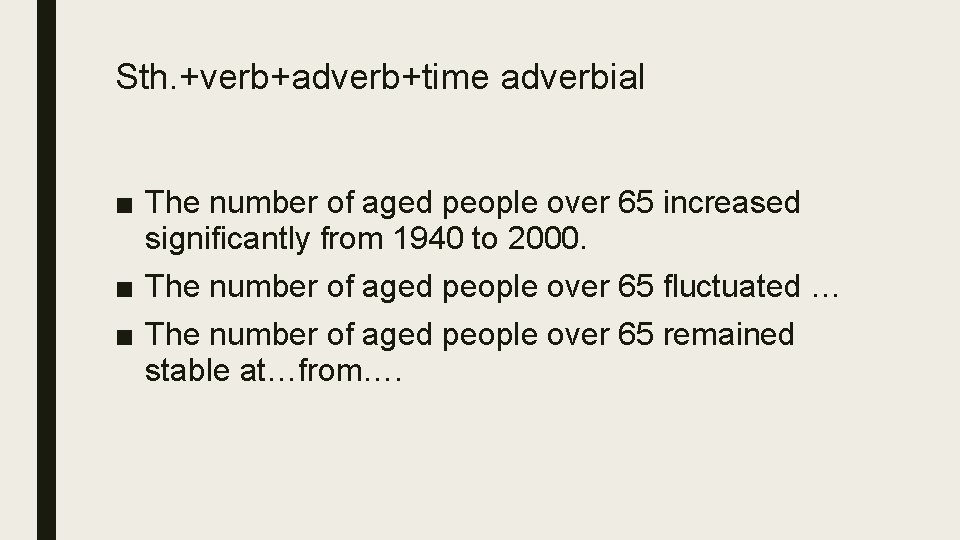
Sth. +verb+adverb+time adverbial ■ The number of aged people over 65 increased significantly from 1940 to 2000. ■ The number of aged people over 65 fluctuated … ■ The number of aged people over 65 remained stable at…from….
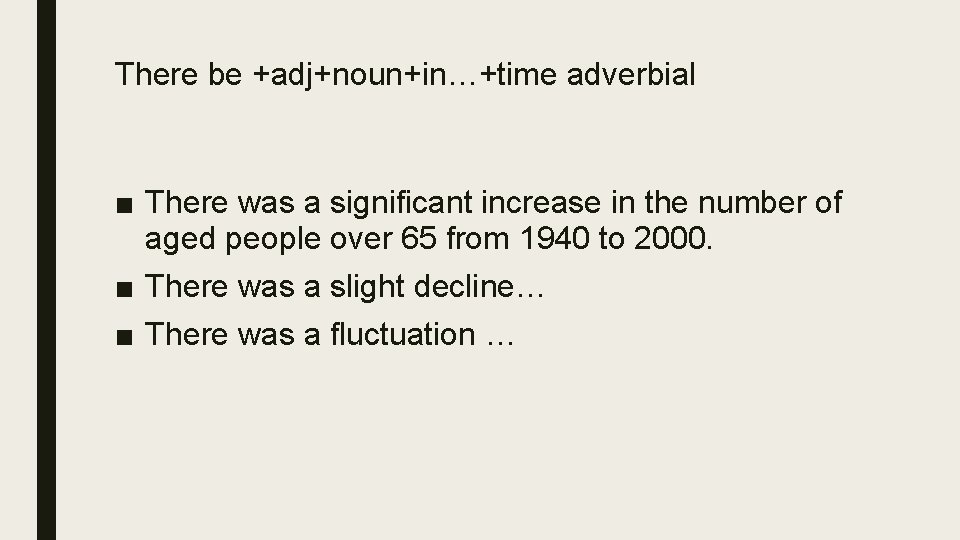
There be +adj+noun+in…+time adverbial ■ There was a significant increase in the number of aged people over 65 from 1940 to 2000. ■ There was a slight decline… ■ There was a fluctuation …
Some notes • Avoid a narrative style – Here are two graphs. They show that there were many changes in the kinds of jobs the people mostly did in the last century. In the 1920 s most people worked in agriculture, as farmers, and they continued in this way for many years. later, however, a change gradually happened in the workforce.
• Avoid redundancy – Twenty percent of car accidents happen after dark, while the other 80% happen during daylight hours. – In contrast, the position of women was just the opposite to that of men. – There are some differences between these two countries. /The trends are not the same/ From the graph we can see the various rates of change. (Topic- sentence-like expressions)
• Use a compact style – Between 1860 and 1900 the temperature remained steady. During that time the temperature rose and fell by no more than 0. 1 degree. – Between 1860 and 1900 the temperature remained steady, rising and falling by no more than 0. 1 degree. – The US had by far the greatest share of the information technology market, accounting for 44% of Internet connections. – The developing countries of Africa, Asia and Latin America experienced the most dramatic growth, with Africa having around 5% per annum.
• Use a compact style (prep & namely) – Between 1920 and 1970 the business sector remained constant at around 10% of the workforce. – By far the greatest proportion of electricity was generated by oil, at 59%. – Less than half as much, namely 26%, was produced from brown coal. – The region with the second highest consumption of cigarettes was the Western Pacific, with nearly 2000 per head, and it also recorded the second highest number of tobacco related deaths, namely 1. 185 million.
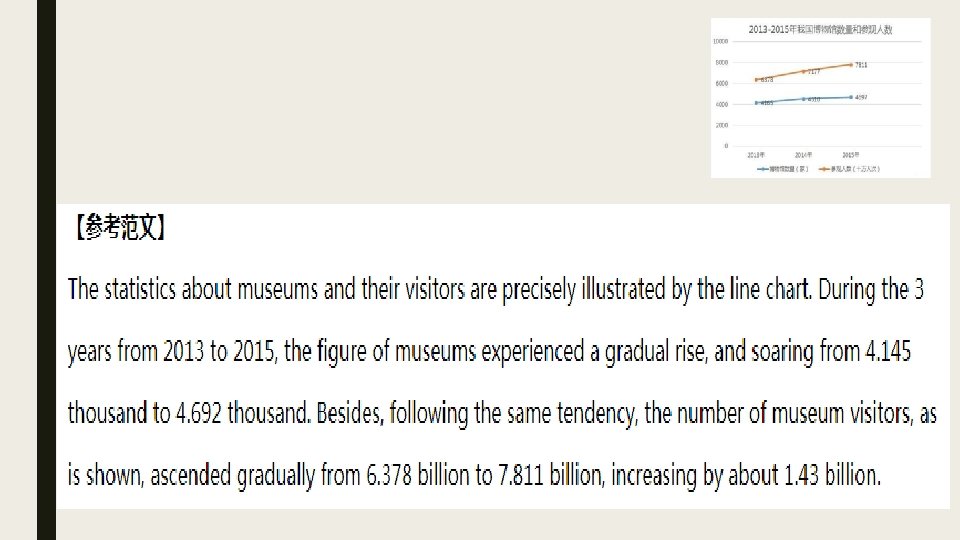
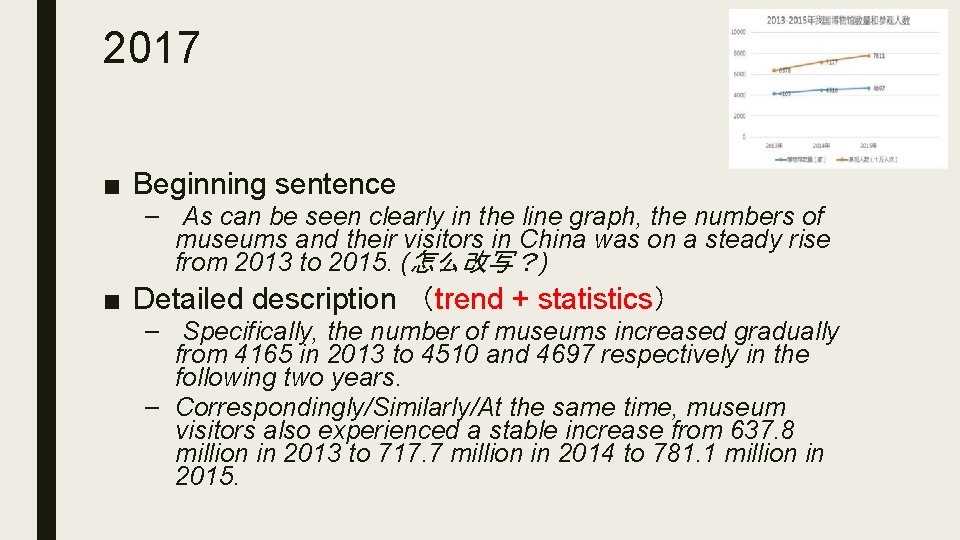
2017 ■ Beginning sentence – As can be seen clearly in the line graph, the numbers of museums and their visitors in China was on a steady rise from 2013 to 2015. (怎么改写?) ■ Detailed description (trend + statistics) – Specifically, the number of museums increased gradually from 4165 in 2013 to 4510 and 4697 respectively in the following two years. – Correspondingly/Similarly/At the same time, museum visitors also experienced a stable increase from 637. 8 million in 2013 to 717. 7 million in 2014 to 781. 1 million in 2015.
Paragraph ■ My health club has become more of a social gathering place than a fitness center. For one thing, people come here to see and to be seen. The men and women wear skimpy outfits that show off their bodies. The women wear makeup, and their hair is attractively styled as if they were going on dates. The men seek to impress the women by trying to outdo each other lifting weights. Also, some people use the health club as a meeting place. Men and women join because they have heard it is a safe place to meet people. They can observe each other’s behavior and get to know each other before going out.