WINTER 2016 VICTORIAN GAS OPERATIONS OUTLOOK 3 May













- Slides: 181
WINTER 2016 – VICTORIAN GAS OPERATIONS OUTLOOK 3 May 2016 SLIDE
AGENDA 1: 00 - 2: 30 3: 00 - 3: 30 - 5: 00 - 6: 00 Session 1 • Introduction • 2015 Review and 2016 Overview • 2016 Weather Outlook • DTS Augmentations • Transmission Operations Afternoon tea Session 2 • Market Operations • Peak Day – Case Study • Emergency Management • Announcement and Q & A Networking SLIDE 2
INTRODUCTION Presented by Matthew Clemow Senior Manager, AEMO Gas Real Time Operations SLIDE 3
WINTER STRATEGY - IMPORTANCE • Winter demand challenges o o o High morning and evening peak flows System linepack utilisation increases Limited support for Gas Powered Generation (GPG) Weather forecast changes Market outcomes change injection locations • Consistent and efficient operations o Predictable outcomes for participants • Manage DTS operational risks o Per the AEMO Gas Safety Case SLIDE 4
WINTER STRATEGY - IMPLEMENTATION • Analysis of transmission system changes o How AEMO will manage these changes • Preparation and Training o Information for Industry Participants § Winter Strategy Presentation § Winter Strategy Paper o AEMO Gas Operations Engineers § Pre-winter training SLIDE 5
WINTER STRATEGY – BENEFITS • Provides participants with information about: o System changes o AEMO’s operations and scheduling o Highlights any potential risks • Increases transparency • Opportunity to ask questions • Provides confidence and assurance that AEMO is prepared and ready to manage winter operations SLIDE 6
AEMO’S ROLES AND RESPONSIBILITIES SLIDE 7
TRANSMISSION OPERATIONS Safe, Secure and Reliable Operation of the DTS • • Maintain System Security o Manage pipeline gas flows using the AEMO Gas SCADA o Operating strategies to maintain pipeline pressures o Adapt based on expected scheduled injections o Engineering modelling tools including Gregg Model o Threats to System Security Emergency Management o Assess, Respond and Communicate Monitor and manage Gas Quality o SCADA Communications with Gas Facilities o Gas Quality Procedures and Management Plans Gas metering data collection via AEMO Gas SCADA SLIDE 8
AEMO OPERATION OF THE APA TRANSMISSION SYSTEM • • Operate the DTS per the Service Envelope Agreement (SEA) o Agreed operations and reliability standards o Incident review and continuous improvement AEMO Releases APA Assets for Maintenance o Manage APA asset outages to maintain supply o Victorian Gas Maintenance Coordination process DTS project review and pipeline capacity modelling o Model pipelines to agree transportation capacities o Operability including SEA requirements New DTS Connections o Distribution offtakes o Facilities including Operating Agreements SLIDE 9
MARKET OPERATIONS • • • Gas Demand Forecasting o Market participant forecasts adjusted against actual flow o Demand Override Methodology o Direct Call to Weather Forecasting Service Monitoring GPG via NEM Pre-dispatch Scheduling Pipeline Injections and Withdrawals o Market Clearing Engine generates schedules o Pricing Schedule § Infinite Tank Model with no DTS pipeline capacity constraints o Operating Schedule § Actual scheduled flows accounting for DTS capacity § Peak Shaving LNG to support system pressure SLIDE 10
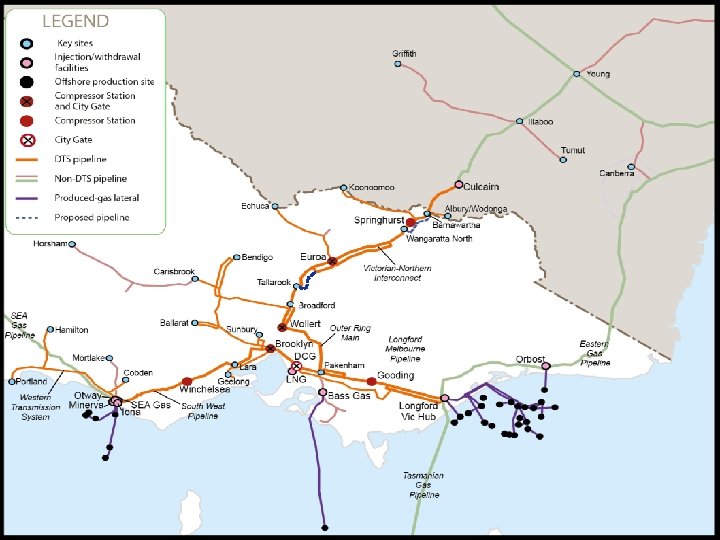
DWGM - DTS Overview SLIDE 11
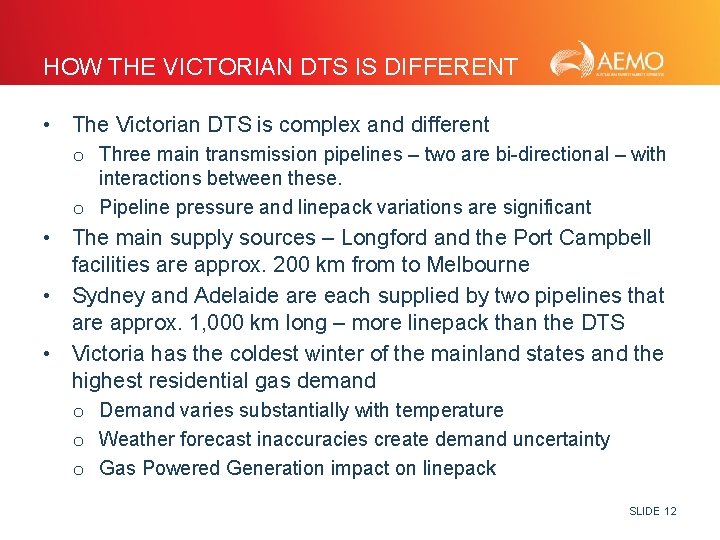
HOW THE VICTORIAN DTS IS DIFFERENT • The Victorian DTS is complex and different o Three main transmission pipelines – two are bi-directional – with interactions between these. o Pipeline pressure and linepack variations are significant • The main supply sources – Longford and the Port Campbell facilities are approx. 200 km from to Melbourne • Sydney and Adelaide are each supplied by two pipelines that are approx. 1, 000 km long – more linepack than the DTS • Victoria has the coldest winter of the mainland states and the highest residential gas demand o Demand varies substantially with temperature o Weather forecast inaccuracies create demand uncertainty o Gas Powered Generation impact on linepack SLIDE 12
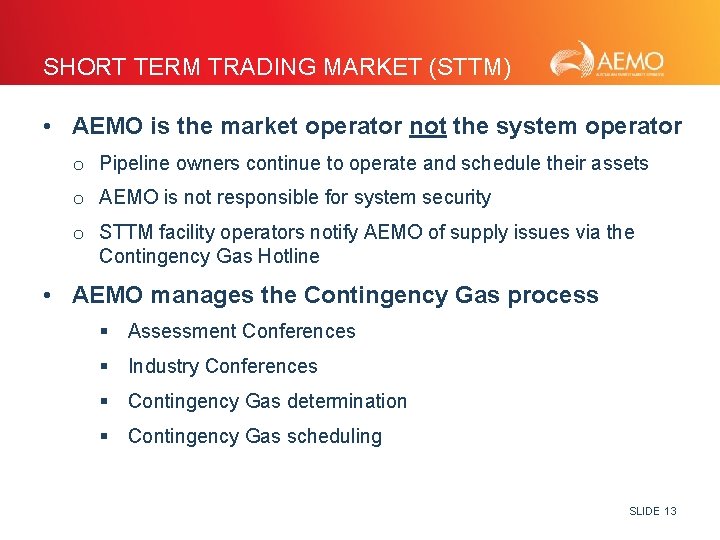
SHORT TERM TRADING MARKET (STTM) • AEMO is the market operator not the system operator o Pipeline owners continue to operate and schedule their assets o AEMO is not responsible for system security o STTM facility operators notify AEMO of supply issues via the Contingency Gas Hotline • AEMO manages the Contingency Gas process § Assessment Conferences § Industry Conferences § Contingency Gas determination § Contingency Gas scheduling SLIDE 13
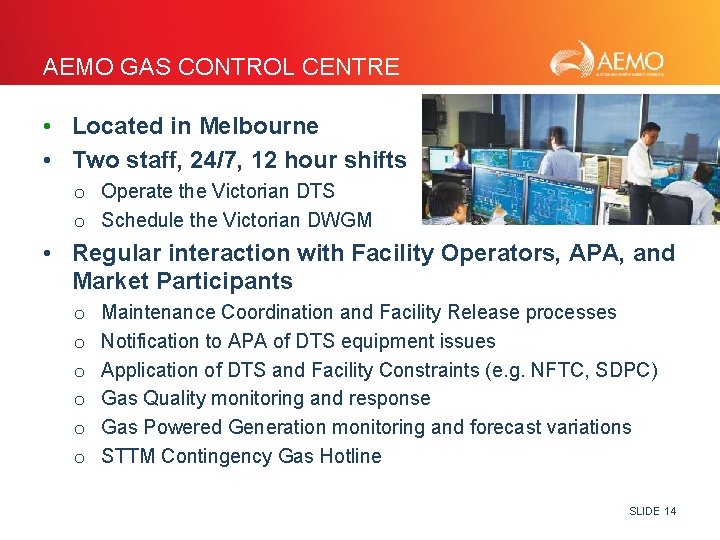
AEMO GAS CONTROL CENTRE • Located in Melbourne • Two staff, 24/7, 12 hour shifts o Operate the Victorian DTS o Schedule the Victorian DWGM • Regular interaction with Facility Operators, APA, and Market Participants o o o Maintenance Coordination and Facility Release processes Notification to APA of DTS equipment issues Application of DTS and Facility Constraints (e. g. NFTC, SDPC) Gas Quality monitoring and response Gas Powered Generation monitoring and forecast variations STTM Contingency Gas Hotline SLIDE 14
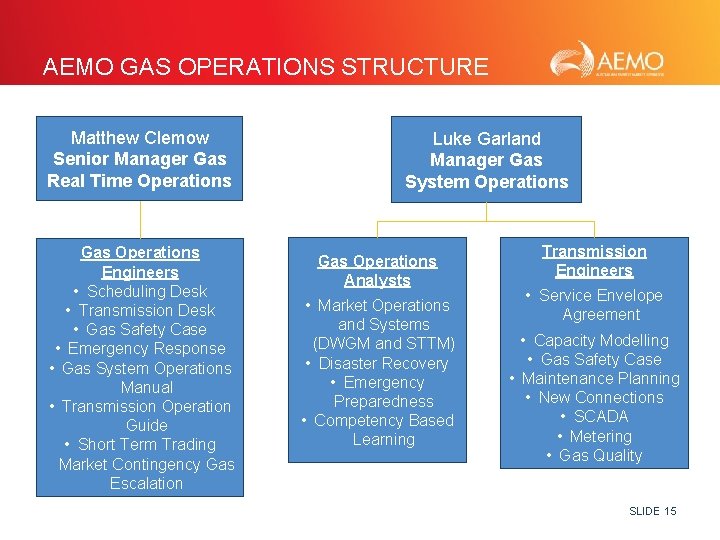
AEMO GAS OPERATIONS STRUCTURE Matthew Clemow Senior Manager Gas Real Time Operations Gas Operations Engineers • Scheduling Desk • Transmission Desk • Gas Safety Case • Emergency Response • Gas System Operations Manual • Transmission Operation Guide • Short Term Trading Market Contingency Gas Escalation Luke Garland Manager Gas System Operations Gas Operations Analysts • Market Operations and Systems (DWGM and STTM) • Disaster Recovery • Emergency Preparedness • Competency Based Learning Transmission Engineers • Service Envelope Agreement • Capacity Modelling • Gas Safety Case • Maintenance Planning • New Connections • SCADA • Metering • Gas Quality SLIDE 15
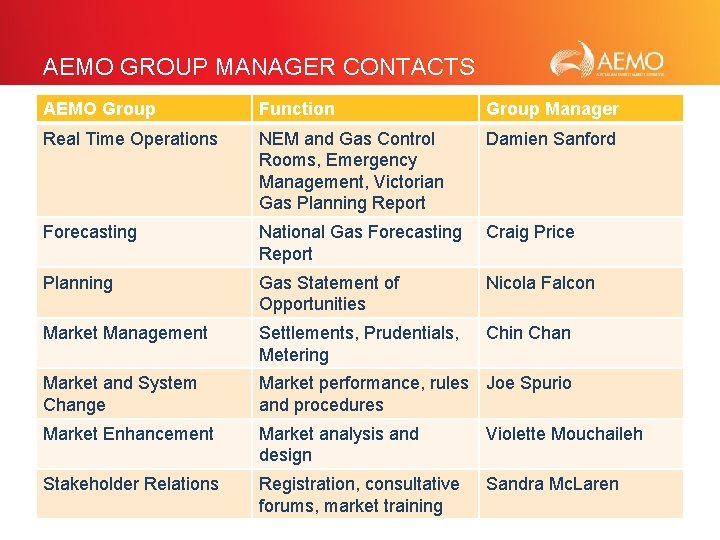
AEMO GROUP MANAGER CONTACTS AEMO Group Function Group Manager Real Time Operations NEM and Gas Control Rooms, Emergency Management, Victorian Gas Planning Report Damien Sanford Forecasting National Gas Forecasting Report Craig Price Planning Gas Statement of Opportunities Nicola Falcon Market Management Settlements, Prudentials, Metering Chin Chan Market and System Change Market performance, rules Joe Spurio and procedures Market Enhancement Market analysis and design Violette Mouchaileh Stakeholder Relations Registration, consultative forums, market training Sandra Mc. Laren SLIDE 16
WINTER 2015 REVIEW AND WINTER 2016 OVERVIEW Presented by Matthew Clemow Senior Manager, AEMO Gas Real Time Operations SLIDE 17
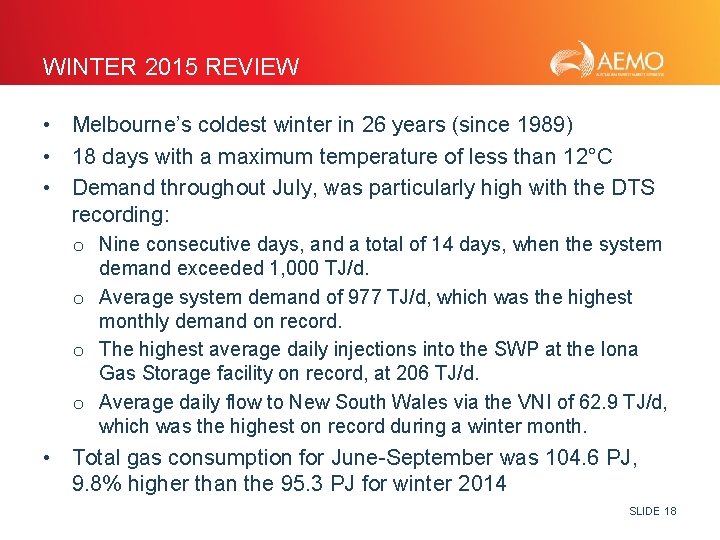
WINTER 2015 REVIEW • Melbourne’s coldest winter in 26 years (since 1989) • 18 days with a maximum temperature of less than 12°C • Demand throughout July, was particularly high with the DTS recording: o Nine consecutive days, and a total of 14 days, when the system demand exceeded 1, 000 TJ/d. o Average system demand of 977 TJ/d, which was the highest monthly demand on record. o The highest average daily injections into the SWP at the Iona Gas Storage facility on record, at 206 TJ/d. o Average daily flow to New South Wales via the VNI of 62. 9 TJ/d, which was the highest on record during a winter month. • Total gas consumption for June-September was 104. 6 PJ, 9. 8% higher than the 95. 3 PJ for winter 2014 SLIDE 18
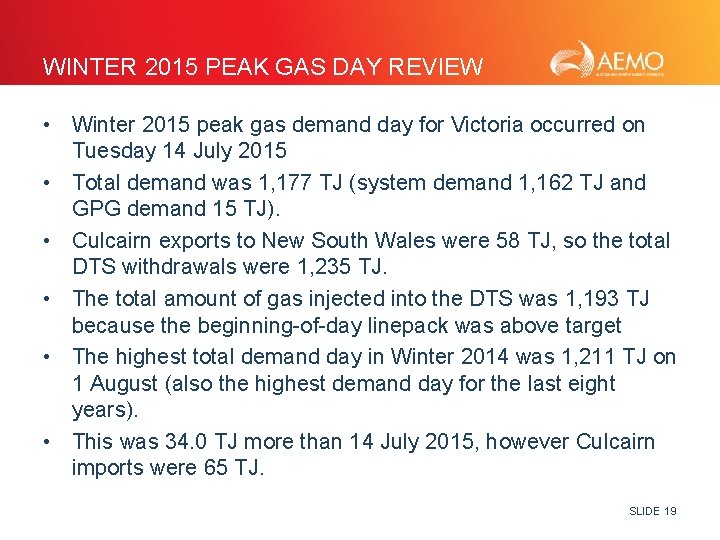
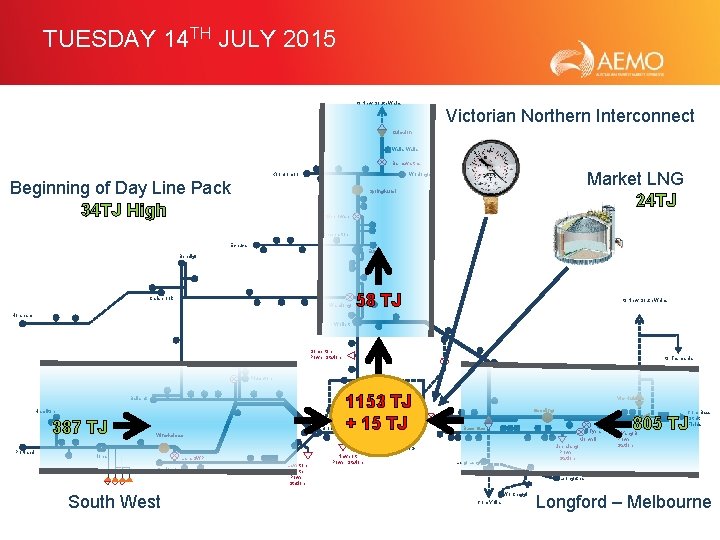
WINTER 2015 PEAK GAS DAY REVIEW • Winter 2015 peak gas demand day for Victoria occurred on Tuesday 14 July 2015 • Total demand was 1, 177 TJ (system demand 1, 162 TJ and GPG demand 15 TJ). • Culcairn exports to New South Wales were 58 TJ, so the total DTS withdrawals were 1, 235 TJ. • The total amount of gas injected into the DTS was 1, 193 TJ because the beginning-of-day linepack was above target • The highest total demand day in Winter 2014 was 1, 211 TJ on 1 August (also the highest demand day for the last eight years). • This was 34. 0 TJ more than 14 July 2015, however Culcairn imports were 65 TJ. SLIDE 19
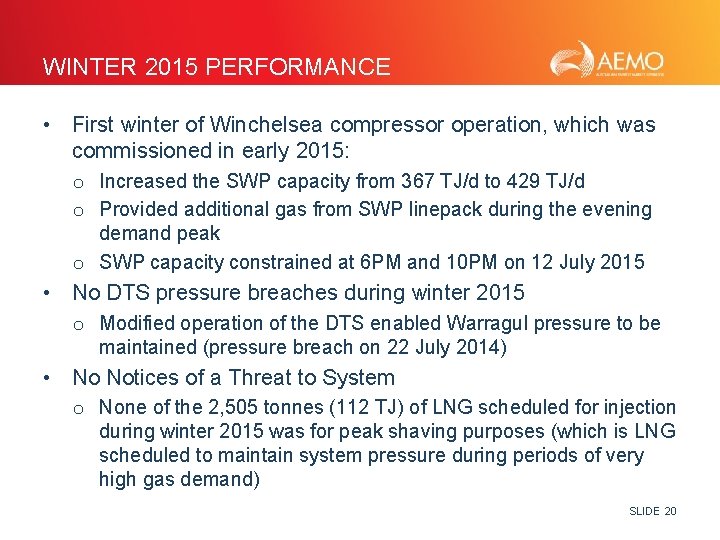
WINTER 2015 PERFORMANCE • First winter of Winchelsea compressor operation, which was commissioned in early 2015: o Increased the SWP capacity from 367 TJ/d to 429 TJ/d o Provided additional gas from SWP linepack during the evening demand peak o SWP capacity constrained at 6 PM and 10 PM on 12 July 2015 • No DTS pressure breaches during winter 2015 o Modified operation of the DTS enabled Warragul pressure to be maintained (pressure breach on 22 July 2014) • No Notices of a Threat to System o None of the 2, 505 tonnes (112 TJ) of LNG scheduled for injection during winter 2015 was for peak shaving purposes (which is LNG scheduled to maintain system pressure during periods of very high gas demand) SLIDE 20
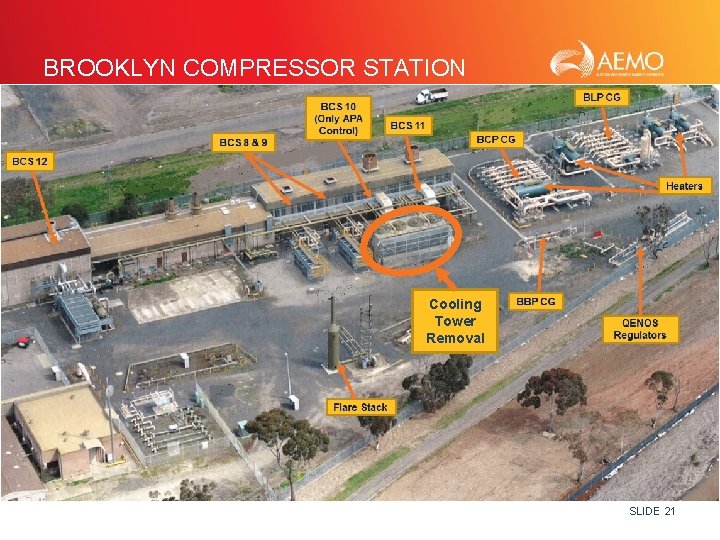
BROOKLYN COMPRESSOR STATION Cooling Tower Removal SLIDE 21
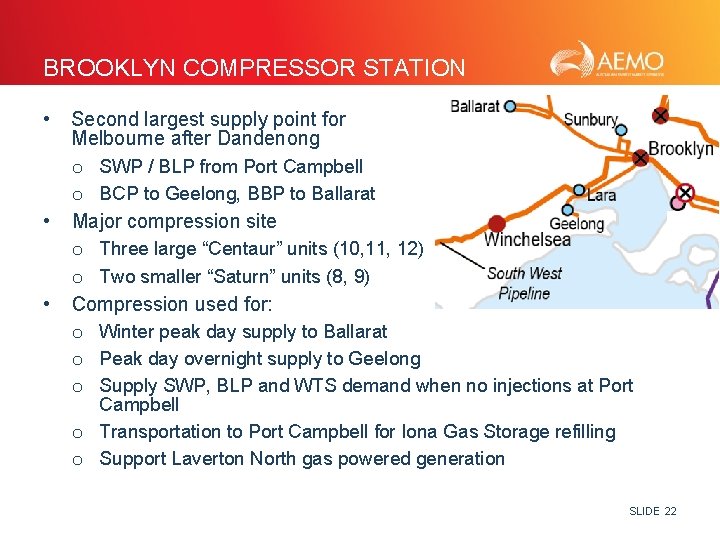
BROOKLYN COMPRESSOR STATION • • • Second largest supply point for Melbourne after Dandenong o SWP / BLP from Port Campbell o BCP to Geelong, BBP to Ballarat Major compression site o Three large “Centaur” units (10, 11, 12) o Two smaller “Saturn” units (8, 9) Compression used for: o Winter peak day supply to Ballarat o Peak day overnight supply to Geelong o Supply SWP, BLP and WTS demand when no injections at Port Campbell o Transportation to Port Campbell for Iona Gas Storage refilling o Support Laverton North gas powered generation SLIDE 22
BROOKLYN COOLER REPLACEMENT PROJECT • Project to replace Unit 10 and 11 Cooling Tower was originally scheduled for October 2015 to January 2016 (4 months) • AEMO required APA to have two large compressors available for system security, as well as Iona Gas Storage and Laverton North Power Station supply • APA procured a temporary cooling tower • Both compressor coolers were found to be leaking, resulting in only one large compressor being available (Unit 12) • APA advised that repairs were not feasible and accelerated the replacement project • Market Notice was issued on 21 October 2015 and AEMO held an Industry Conference Call to inform participants SLIDE 23
BROOKLYN ISOLATION VALVE REPLACEMENT PROJECT • Project to replace the Pipeline Isolation Valves on the three pipelines into the Brooklyn Compressor Station • Safety requirement to replace these original valves. Similar to the LNG Facility valve replacement in January 2014 • Injections at Port Campbell required to support SWP, BLP and WTS demands. Industry Conference call held. • Scheduled for April during the Autumn shoulder period o Compressors required during summer and winter o Originally coincided with a Longford Gas Plant outage o Injections at Port Campbell more probable in April than summer o However April 2016 was 2 o. C warmer than average SLIDE 24
AEMO MAINTENANCE COORDINATION PROCESS • As the independent system operator, AEMO coordinates major outages for DTS connected Gas Plants, Storage Facilities, and Interconnected Pipelines, as well as APA’s DTS pipeline assets • AEMO hosts three meetings during the year that are attended by the Facility Operators and APA • Outages are reviewed and threats to supply are identified, enabling outage timings to be adjusted • AEMO continues to monitor and risk assess facility outages, and APA maintenance activities as schedules change • AEMO will issue a direction to a Facility Operator if there is a threat to gas supply SLIDE 25
AEMO MAINTENANCE COORDINATION MARCH – MAY 2016 • A number of outages are scheduled during shoulder periods – outside of winter heating and summer GPG demand windows • March to May 2016 has required detailed coordination: o Otway Gas Plant outage during March followed by Iona o Longford outage after Iona outage completed o Brooklyn station outage when Iona, Otway and Minerva available o Springhurst compressor upgrade (impacts supply from NSW via Culcairn) when Longford and Iona available o LNG Vaporiser C outage when Springhurst returned SLIDE 26
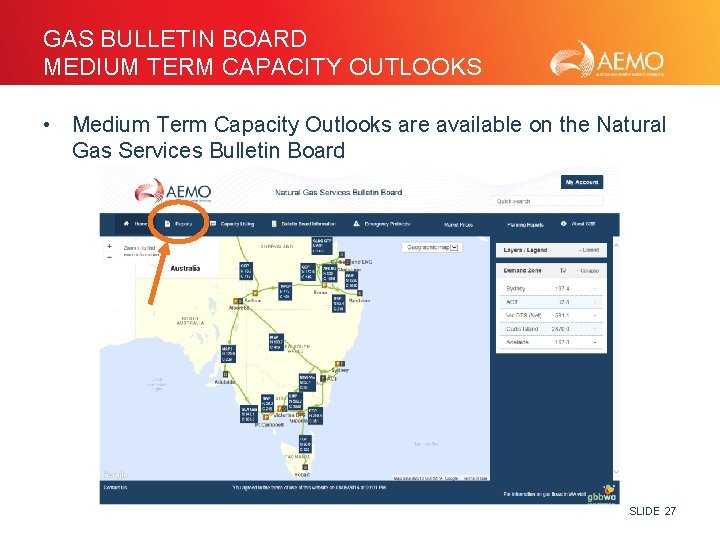
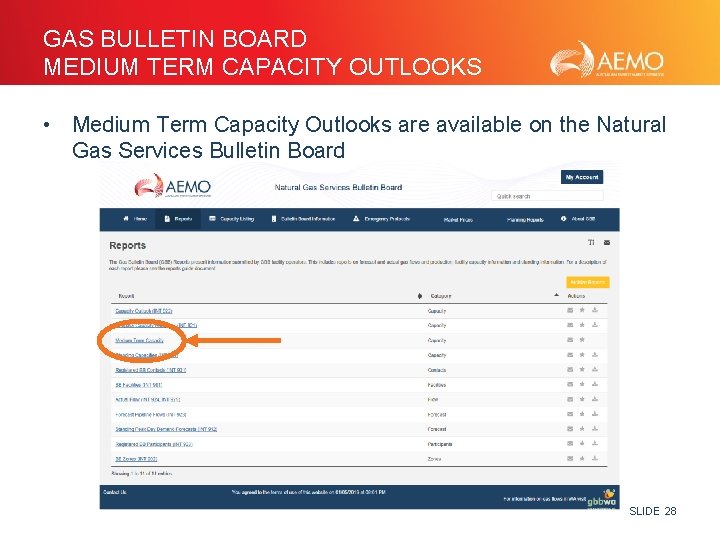
GAS BULLETIN BOARD MEDIUM TERM CAPACITY OUTLOOKS • Medium Term Capacity Outlooks are available on the Natural Gas Services Bulletin Board SLIDE 27
GAS BULLETIN BOARD MEDIUM TERM CAPACITY OUTLOOKS • Medium Term Capacity Outlooks are available on the Natural Gas Services Bulletin Board SLIDE 28
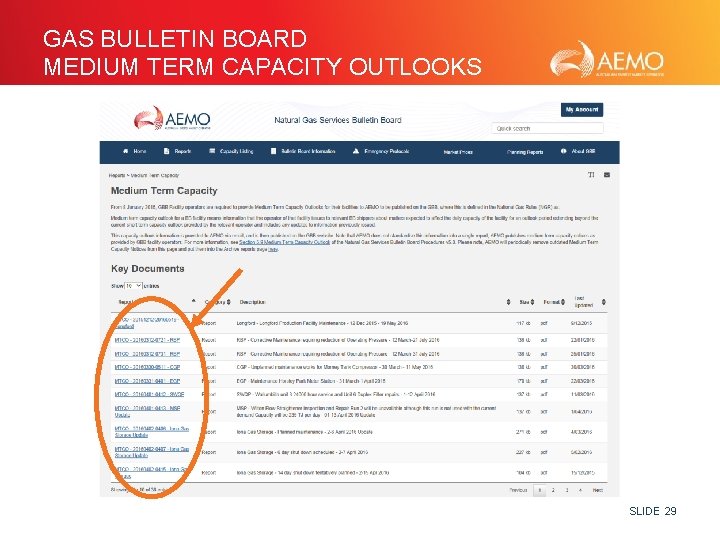
GAS BULLETIN BOARD MEDIUM TERM CAPACITY OUTLOOKS SLIDE 29
2016 VICTORIAN GAS PLANNING REPORT (VGPR) UPDATE • Victorian Gas Planning Report (VGPR) Update published on 29 February 2016. Usually published biennially (last in 2015). • The following changes and issues in the DTS triggered this VGPR Update report: o A further increase in the VNI capacity to NSW that will increase capacity by 25%, to 148 TJ/d during Q 3 2016. o SWP capacity limitation from Melbourne to Port Campbell that will limit flows to South Australia via SEA Gas Pipeline and may impact refilling of the Iona Gas Storage reservoirs. o Iona Gas Storage expansion plans that may require a further increase in the SWP capacity toward Melbourne o Increased demand at Warragul that may require augmentation to maintain the contractual pressure at this connection point. http: //www. aemo. com. au/Gas/Planning/Victorian-Gas-Planning SLIDE 30
2016 VICTORIAN GAS PLANNING REPORT (VGPR) UPDATE • The 2016 VGPR Update includes options for increasing the SWP capacity from Melbourne to Port Campbell using the existing BCS compressors • From 17 February (when two BCS compressors were available) through to 18 April (when the BCS outage started), SWP withdrawals were constrained on 83% of days (excluding the 2 -6 April Iona outage) • The 2016 VGPR Update also includes an analysis of options for increasing the SWP capacity towards Melbourne • AEMO is not the System Planner for the Victorian gas DTS • Market Participants need to reach an agreement with APA to enable the SWP capacity to be increased SLIDE 31
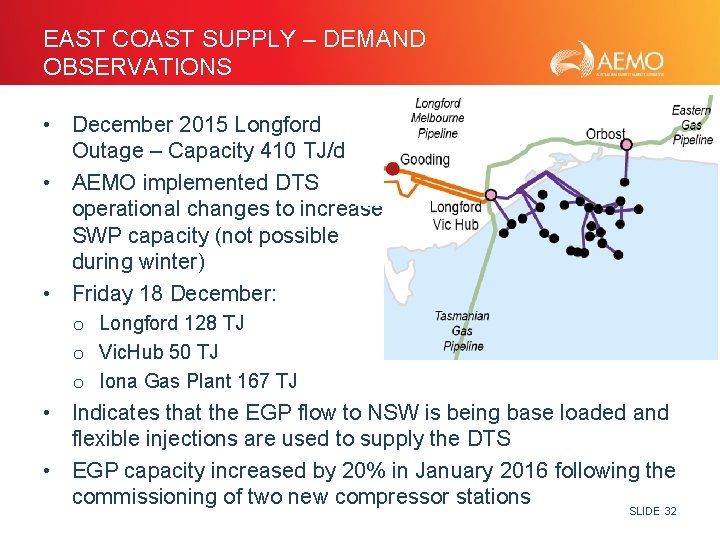
EAST COAST SUPPLY – DEMAND OBSERVATIONS • December 2015 Longford Outage – Capacity 410 TJ/d • AEMO implemented DTS operational changes to increase SWP capacity (not possible during winter) • Friday 18 December: o Longford 128 TJ o Vic. Hub 50 TJ o Iona Gas Plant 167 TJ • Indicates that the EGP flow to NSW is being base loaded and flexible injections are used to supply the DTS • EGP capacity increased by 20% in January 2016 following the commissioning of two new compressor stations SLIDE 32
EAST COAST SUPPLY – BASSLINK OUTAGE • The Basslink electricity interconnector between Victoria and Tasmania became unavailable on 20 December 2015 • Basslink current return to service date is mid-June • Gas flows from Longford to Tasmania via the TGP increased to supply the Tamar Valley Power Station in January • There is sufficient transmission capacity in south-east Australia to transport gas from Queensland if required to satisfy demand • AEMO does not expect this to result in gas supply shortfalls for Victoria – however pricing and supply may tighten SLIDE 33
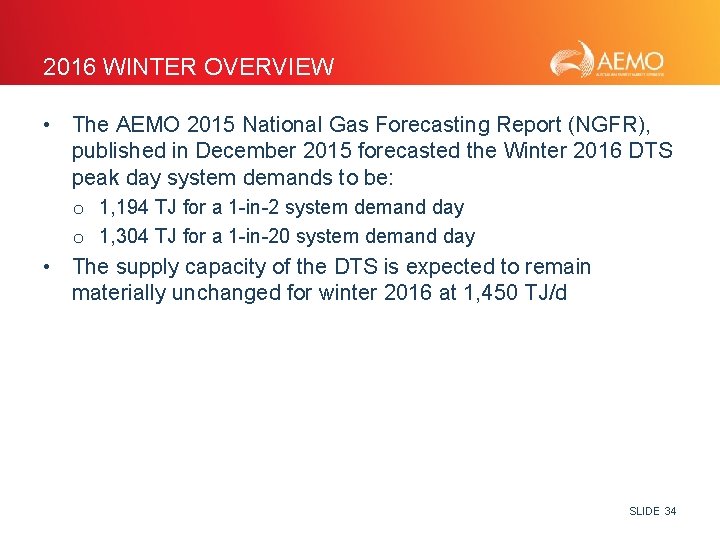
2016 WINTER OVERVIEW • The AEMO 2015 National Gas Forecasting Report (NGFR), published in December 2015 forecasted the Winter 2016 DTS peak day system demands to be: o 1, 194 TJ for a 1 -in-2 system demand day o 1, 304 TJ for a 1 -in-20 system demand day • The supply capacity of the DTS is expected to remain materially unchanged for winter 2016 at 1, 450 TJ/d SLIDE 34
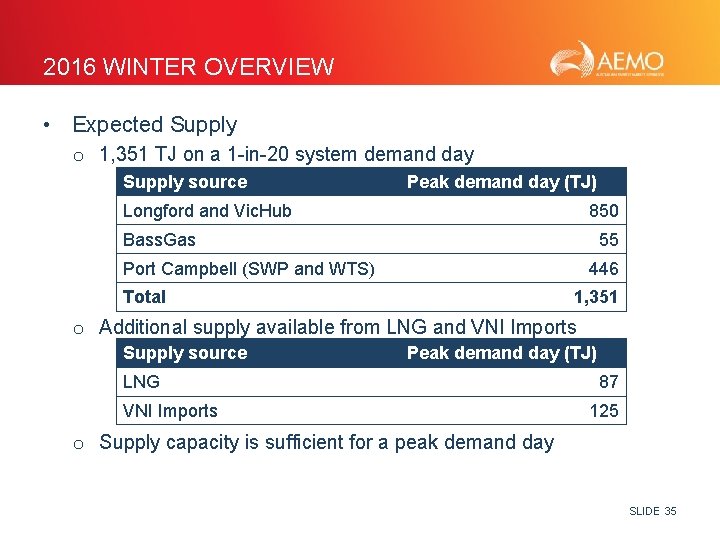
2016 WINTER OVERVIEW • Expected Supply o 1, 351 TJ on a 1 -in-20 system demand day Supply source Peak demand day (TJ) Longford and Vic. Hub 850 Bass. Gas 55 Port Campbell (SWP and WTS) 446 Total 1, 351 o Additional supply available from LNG and VNI Imports Supply source Peak demand day (TJ) LNG VNI Imports 87 125 o Supply capacity is sufficient for a peak demand day SLIDE 35
QUESTIONS? SLIDE 36
TRANSMISSION OPERATIONS Presented by Mark Pollock Gas Operations Engineer, AEMO Gas Real Time Operations SLIDE 37
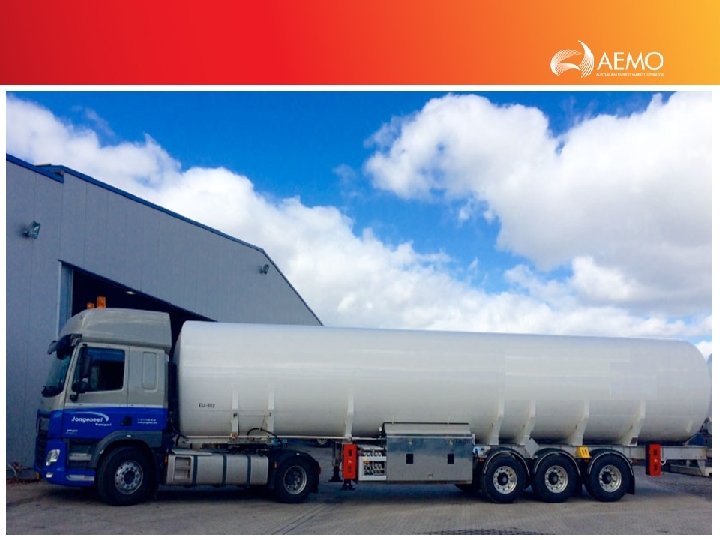
SLIDE 38
SLIDE 39
OVERVIEW • Operations Overview • Fundamentals • Strategies SLIDE 40
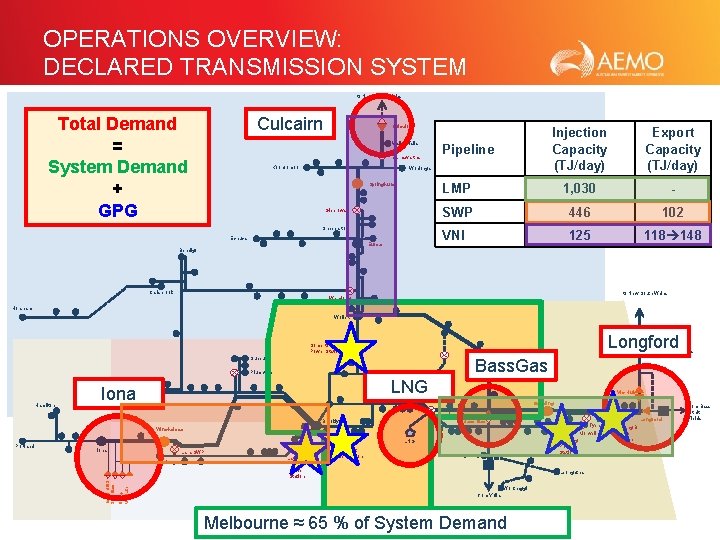
OPERATIONS OVERVIEW: DECLARED TRANSMISSION SYSTEM to New South Wales INJECTION POINTS Total Demand = System Demand + GPG Culcairn Walla Barnawartha Koonoomoo Injection Capacity (TJ/day) Export Capacity (TJ/day) LMP 1, 030 - SWP 446 102 VNI 125 118 148 Pipeline Wodonga Springhurst Glenrowan Shepparton Echuca Euroa Bendigo Carisbrook to New South Wales Wandong Horsham Wollert Longford Somerton Power Station to Tasmania Sunbury Bass. Gas Plumpton LNG Iona Ballarat Hamilton Vic Hub Gooding Dandenong Bass Gas Brooklyn Longford Tyers Winchelsea Jeeralang Power Station LNG Iona Lara SWP Iona UGS SEA Gas Geelong Otway Mortlake Portland Morwell Laverton North Power Station Newport Power Station Lang Loy Yang B Power Station Leongatha Wonthaggi from Yolla Melbourne ≈ 65 % of System Demand SLIDE 41 from Bass Strait Fields
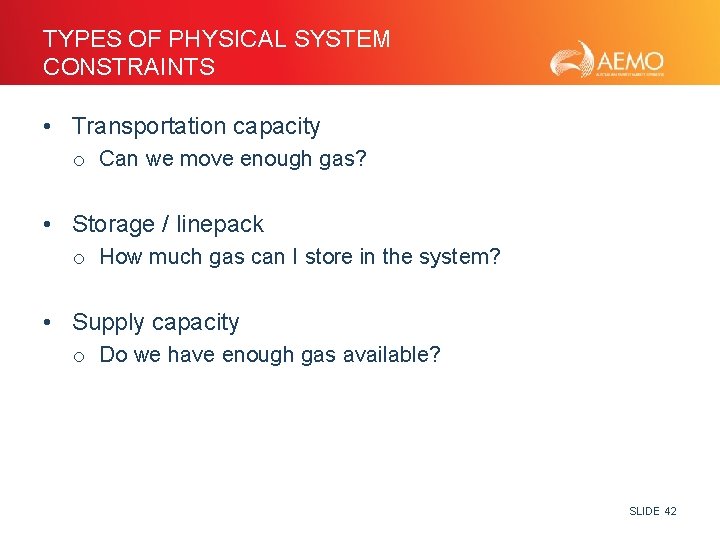
TYPES OF PHYSICAL SYSTEM CONSTRAINTS • Transportation capacity o Can we move enough gas? • Storage / linepack o How much gas can I store in the system? • Supply capacity o Do we have enough gas available? SLIDE 42
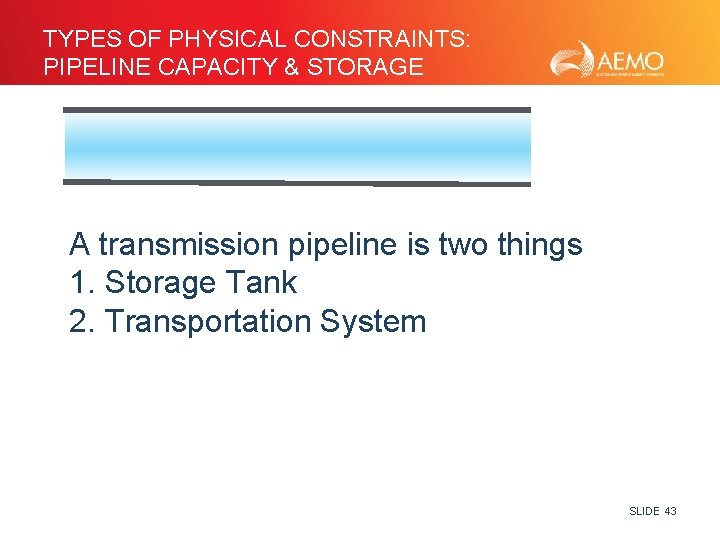
TYPES OF PHYSICAL CONSTRAINTS: PIPELINE CAPACITY & STORAGE A transmission pipeline is two things 1. Storage Tank 2. Transportation System SLIDE 43
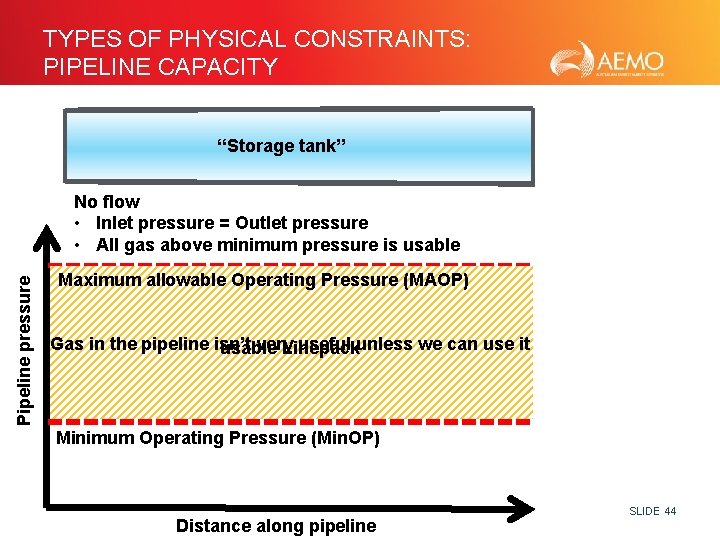
TYPES OF PHYSICAL CONSTRAINTS: PIPELINE CAPACITY “Storage tank” Pipeline pressure No flow • Inlet pressure = Outlet pressure • All gas above minimum pressure is usable Maximum allowable Operating Pressure (MAOP) Gas in the pipeline isn’t very useful unless we can use it usable Linepack Minimum Operating Pressure (Min. OP) Distance along pipeline SLIDE 44
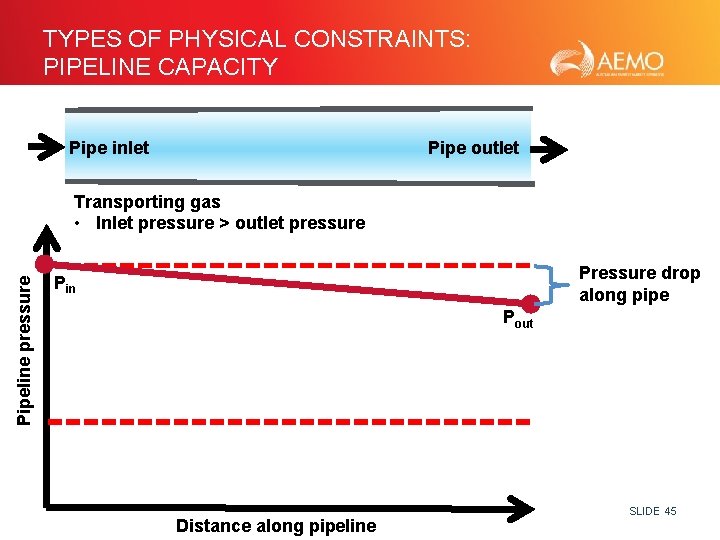
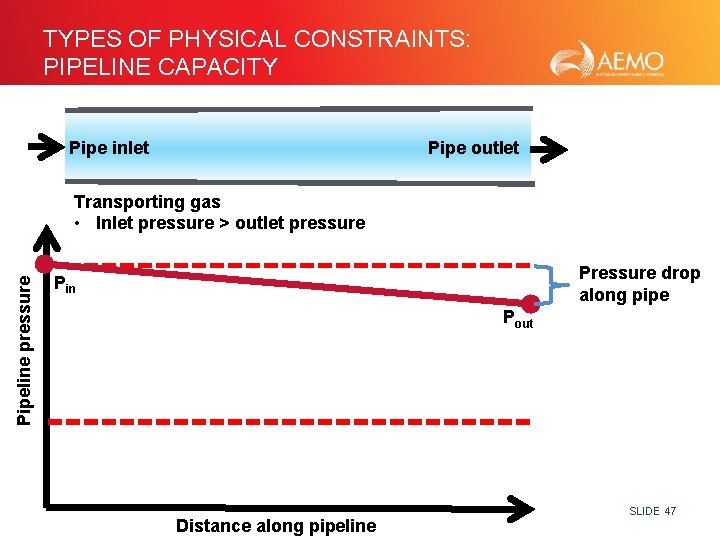
TYPES OF PHYSICAL CONSTRAINTS: PIPELINE CAPACITY Pipe inlet Pipe outlet Pipeline pressure Transporting gas • Inlet pressure > outlet pressure Pressure drop along pipe Pin Pout Distance along pipeline SLIDE 45
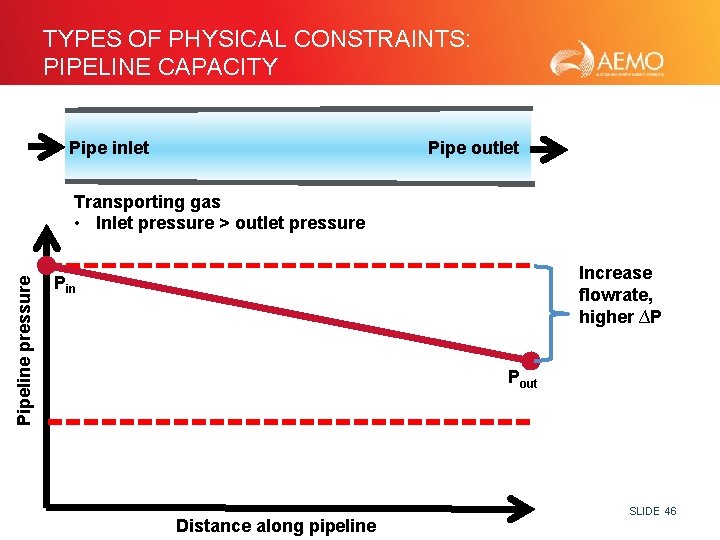
TYPES OF PHYSICAL CONSTRAINTS: PIPELINE CAPACITY Pipe inlet Pipe outlet Pipeline pressure Transporting gas • Inlet pressure > outlet pressure Increase flowrate, higher ∆P Pin Pout Distance along pipeline SLIDE 46
TYPES OF PHYSICAL CONSTRAINTS: PIPELINE CAPACITY Pipe inlet Pipe outlet Pipeline pressure Transporting gas • Inlet pressure > outlet pressure Pressure drop along pipe Pin Pout Distance along pipeline SLIDE 47
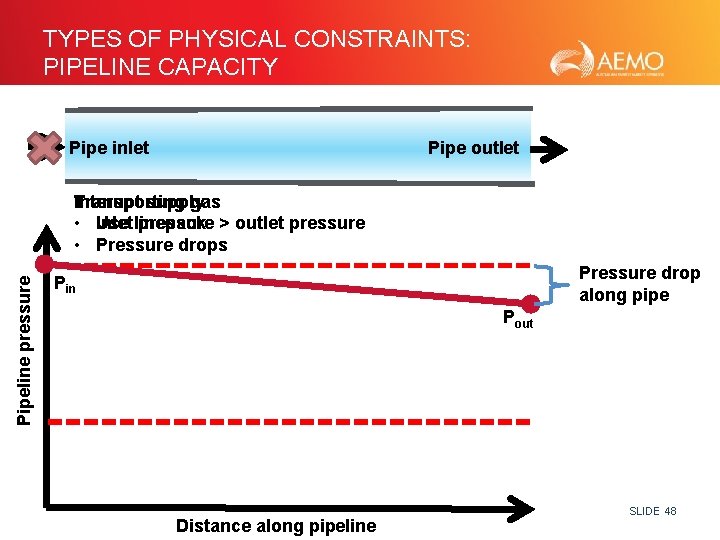
TYPES OF PHYSICAL CONSTRAINTS: PIPELINE CAPACITY Pipe inlet Pipe outlet Pipeline pressure Transporting Interupt supply gas • Inlet Use linepack pressure > outlet pressure • Pressure drops Pressure drop along pipe Pin Pout Distance along pipeline SLIDE 48
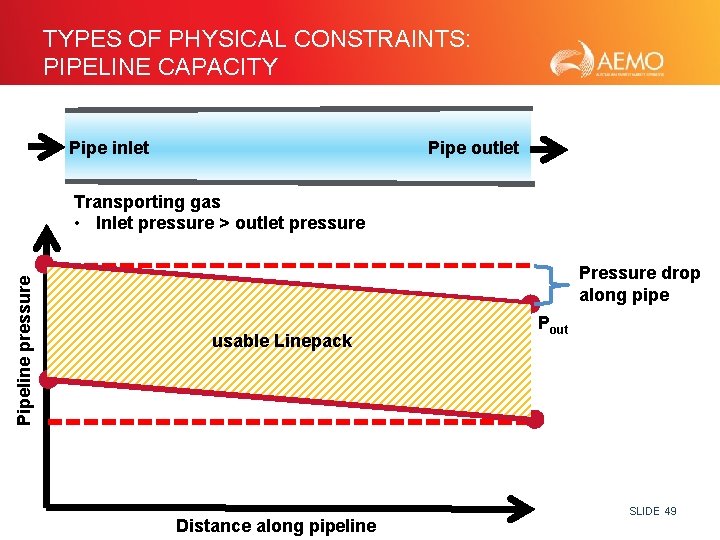
TYPES OF PHYSICAL CONSTRAINTS: PIPELINE CAPACITY Pipe inlet Pipe outlet Pipeline pressure Transporting gas • Inlet pressure > outlet pressure Pressure drop along pipe Pin usable Linepack Distance along pipeline Pout SLIDE 49
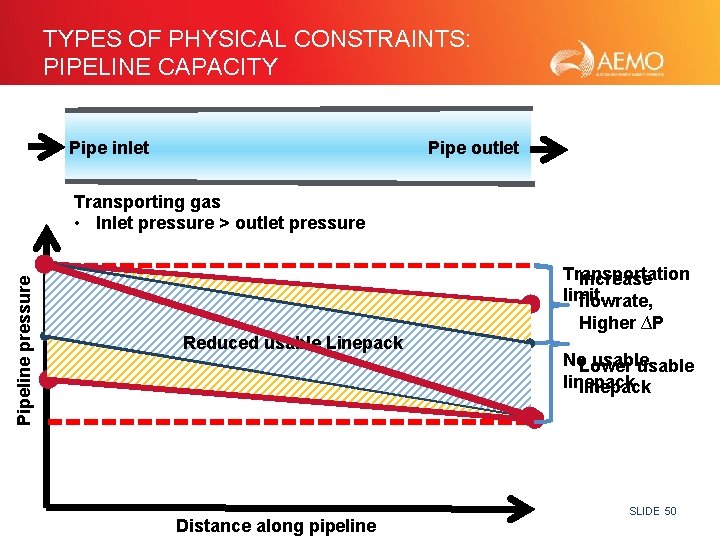
TYPES OF PHYSICAL CONSTRAINTS: PIPELINE CAPACITY Pipe inlet Pipe outlet Pipeline pressure Transporting gas • Inlet pressure > outlet pressure Transportation Increase limit. flowrate, Pin Reduced usable Linepack Lower usable Linepack Distance along pipeline Higher ∆P No. Lower usable linepack SLIDE 50
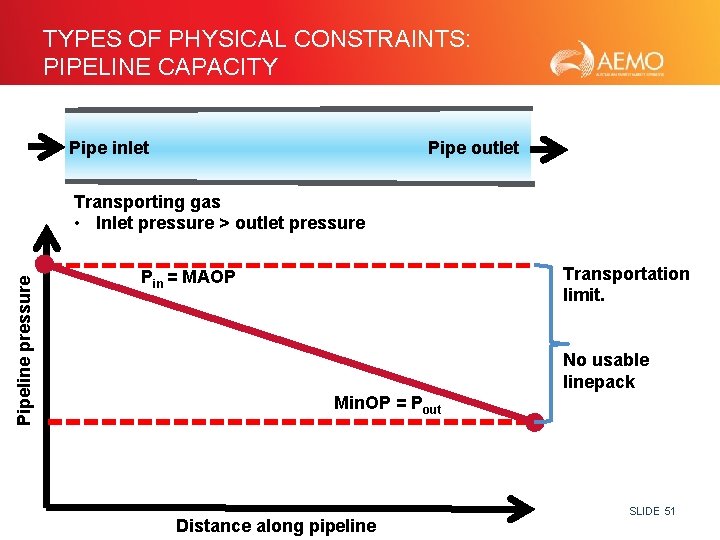
TYPES OF PHYSICAL CONSTRAINTS: PIPELINE CAPACITY Pipe inlet Pipe outlet Pipeline pressure Transporting gas • Inlet pressure > outlet pressure Transportation limit. Pin = MAOP No usable linepack Min. OP = Pout Distance along pipeline SLIDE 51
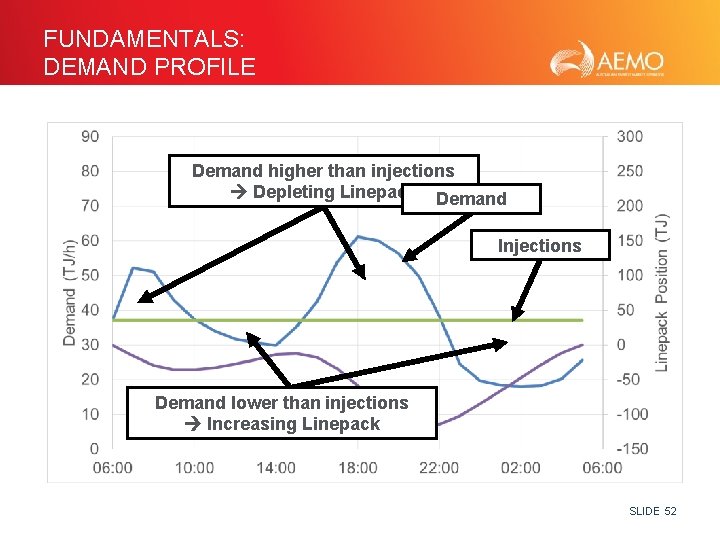
FUNDAMENTALS: DEMAND PROFILE Demand higher than injections Depleting Linepack Demand Injections Demand lower than injections Increasing Linepack SLIDE 52
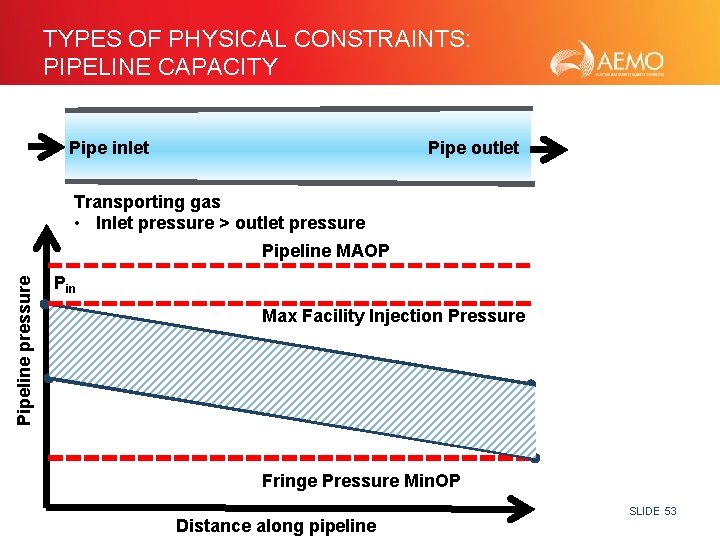
TYPES OF PHYSICAL CONSTRAINTS: PIPELINE CAPACITY Pipe inlet Pipe outlet Transporting gas • Inlet pressure > outlet pressure Pipeline MAOP Pin Max Facility Injection Pressure Fringe Pressure Min. OP Distance along pipeline SLIDE 53
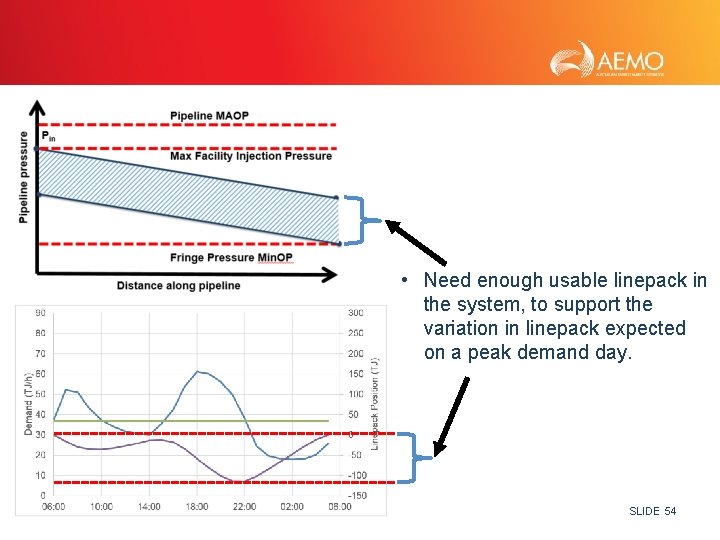
• Need enough usable linepack in the system, to support the variation in linepack expected on a peak demand day. SLIDE 54
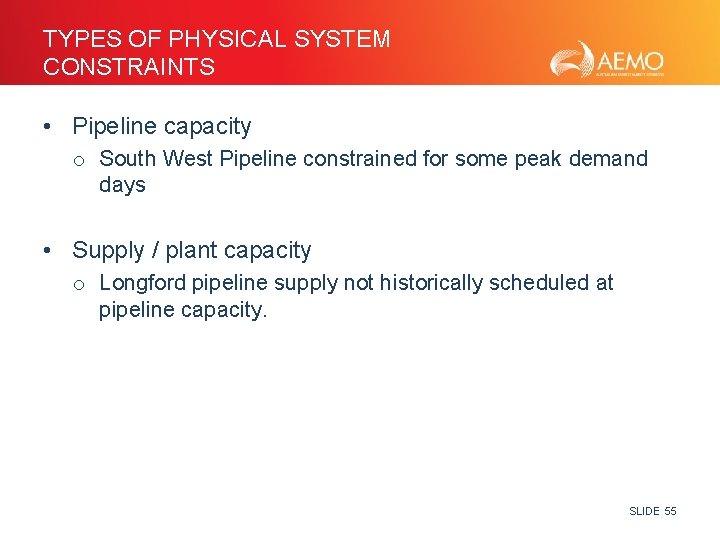
TYPES OF PHYSICAL SYSTEM CONSTRAINTS • Pipeline capacity o South West Pipeline constrained for some peak demand days • Supply / plant capacity o Longford pipeline supply not historically scheduled at pipeline capacity. SLIDE 55
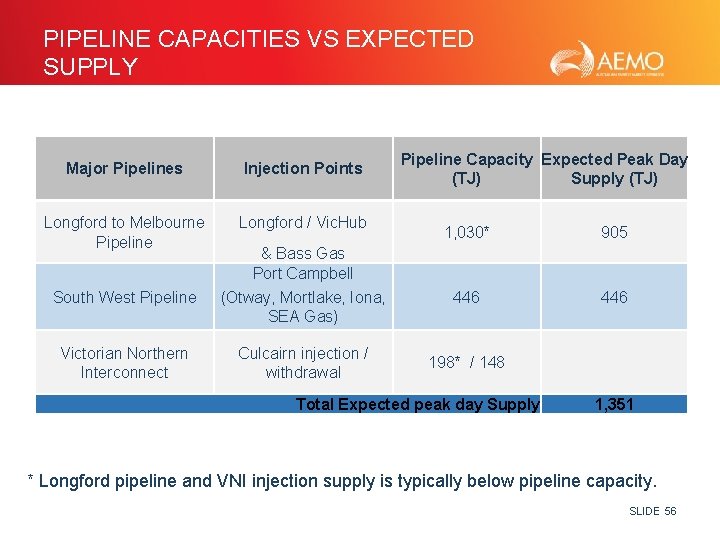
PIPELINE CAPACITIES VS EXPECTED SUPPLY Major Pipelines Injection Points Longford to Melbourne Pipeline Longford / Vic. Hub South West Pipeline Victorian Northern Interconnect & Bass Gas Port Campbell (Otway, Mortlake, Iona, SEA Gas) Culcairn injection / withdrawal Pipeline Capacity Expected Peak Day (TJ) Supply (TJ) 1, 030* 905 446 198* / 148 Total Expected peak day Supply 1, 351 * Longford pipeline and VNI injection supply is typically below pipeline capacity. SLIDE 56
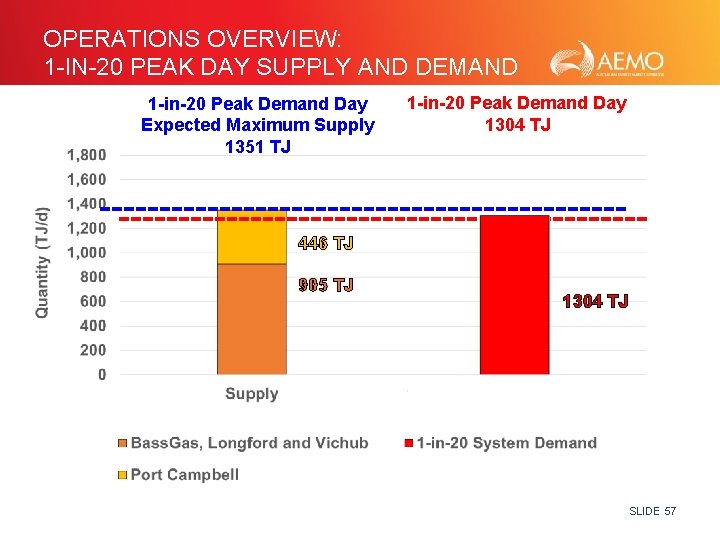
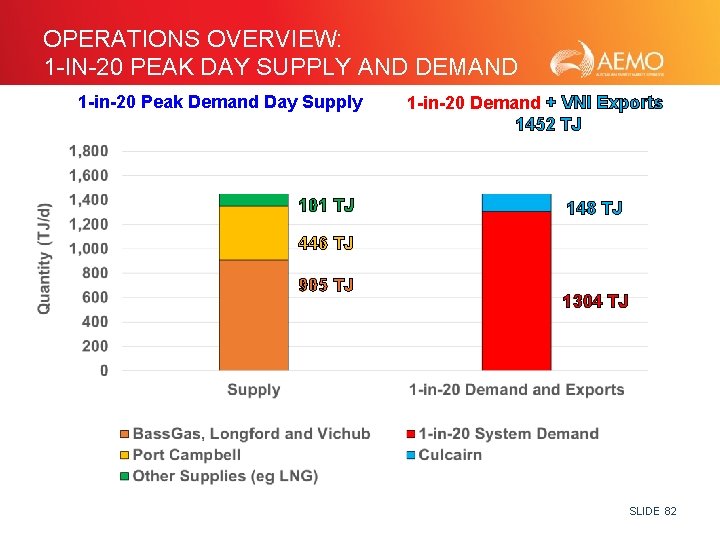
OPERATIONS OVERVIEW: 1 -IN-20 PEAK DAY SUPPLY AND DEMAND 1 -in-20 Peak Demand Day Expected Maximum Supply 1351 TJ 1 -in-20 Peak Demand Day 1304 TJ 446 TJ 905 TJ 1304 TJ SLIDE 57
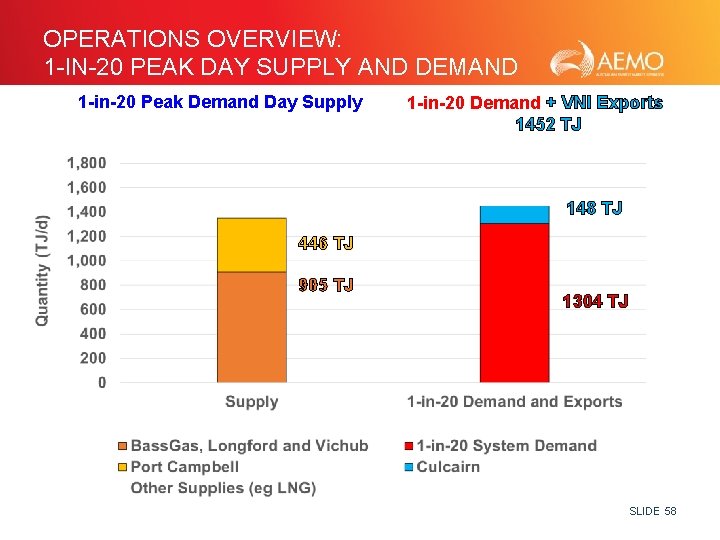
OPERATIONS OVERVIEW: 1 -IN-20 PEAK DAY SUPPLY AND DEMAND 1 -in-20 Peak Demand Day Supply 1 -in-20 Demand + VNI Exports 1452 TJ 148 TJ 446 TJ 905 TJ 1304 TJ SLIDE 58
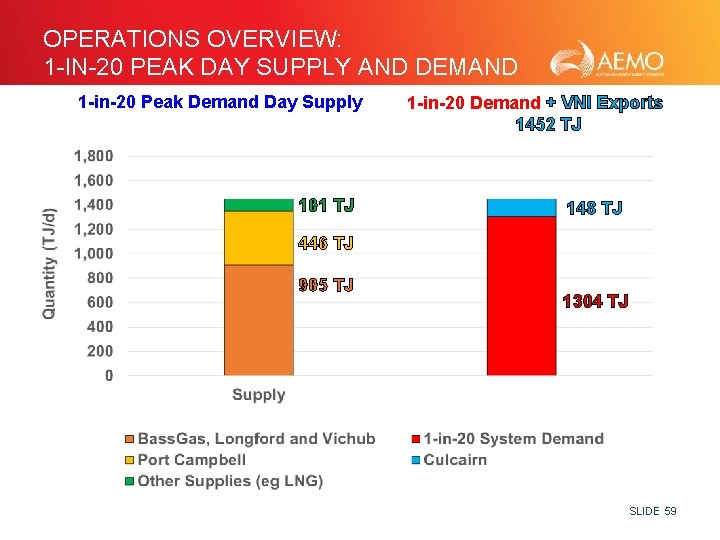
OPERATIONS OVERVIEW: 1 -IN-20 PEAK DAY SUPPLY AND DEMAND 1 -in-20 Peak Demand Day Supply 101 TJ 1 -in-20 Demand + VNI Exports 1452 TJ 148 TJ 446 TJ 905 TJ 1304 TJ SLIDE 59
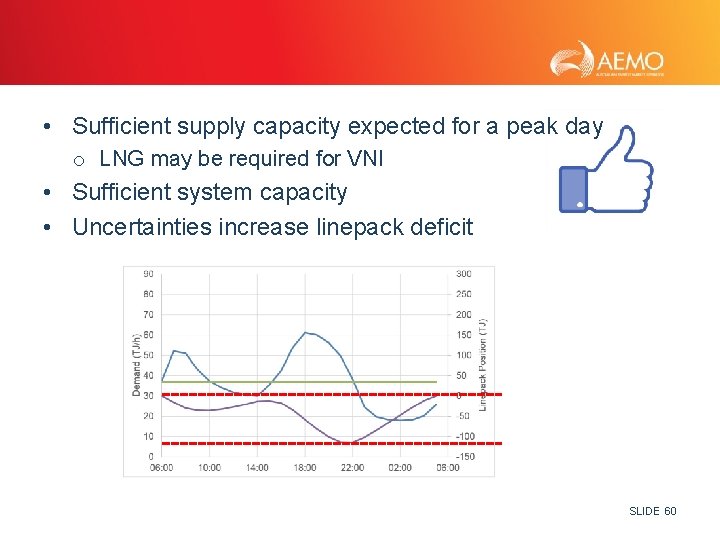
• Sufficient supply capacity expected for a peak day o LNG may be required for VNI • Sufficient system capacity • Uncertainties increase linepack deficit SLIDE 60
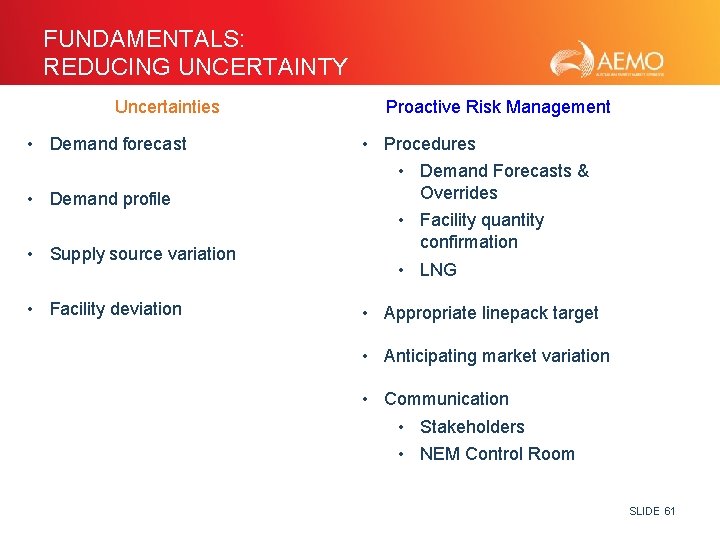
FUNDAMENTALS: REDUCING UNCERTAINTY Uncertainties • Demand forecast • Demand profile • Supply source variation • Facility deviation Proactive Risk Management • Procedures • Demand Forecasts & Overrides • Facility quantity confirmation • LNG • Appropriate linepack target • Anticipating market variation • Communication • Stakeholders • NEM Control Room SLIDE 61
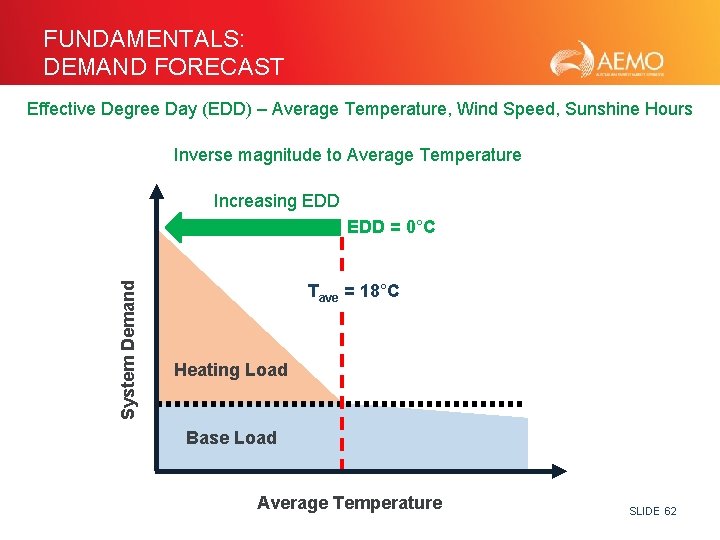
FUNDAMENTALS: DEMAND FORECAST Effective Degree Day (EDD) – Average Temperature, Wind Speed, Sunshine Hours Inverse magnitude to Average Temperature Increasing EDD System Demand EDD = 0°C Tave = 18°C Heating Load Base Load Average Temperature SLIDE 62
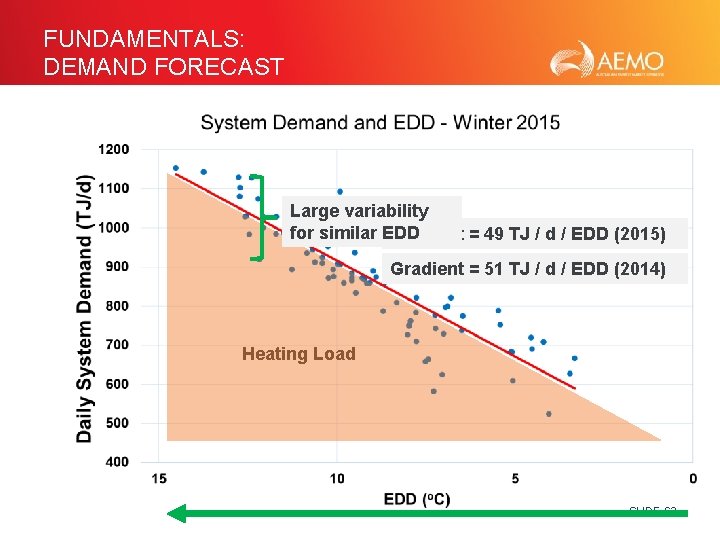
FUNDAMENTALS: DEMAND FORECAST Large variability for similar EDD Gradient = 49 TJ / d / EDD (2015) Gradient = 51 TJ / d / EDD (2014) Heating Load SLIDE 63
• High variability in forecasting daily demand. o EDD considers wind speed, sunshine hours, average temperature. o Melbourne temperature used to represent demand state wide. SLIDE 64
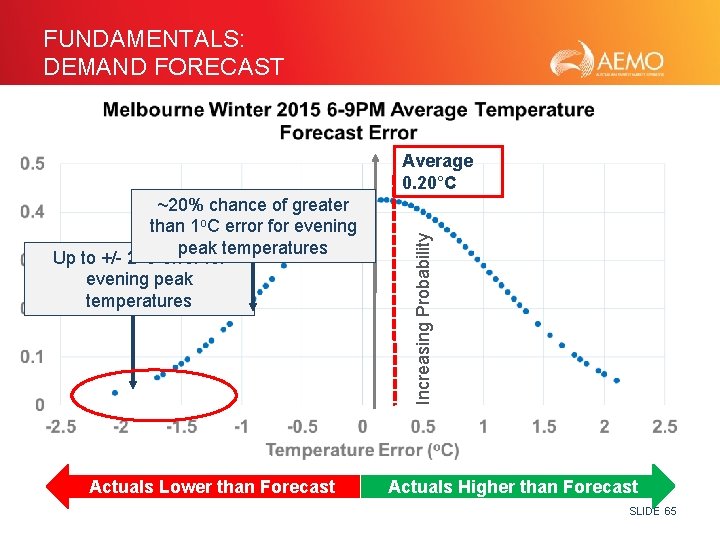
FUNDAMENTALS: DEMAND FORECAST ~20% chance of greater than 1 o. C error for evening peak temperatures Up to +/- 2 o. C error for evening peak temperatures Actuals Lower than Forecast Increasing Probability Average 0. 20°C Actuals Higher than Forecast SLIDE 65
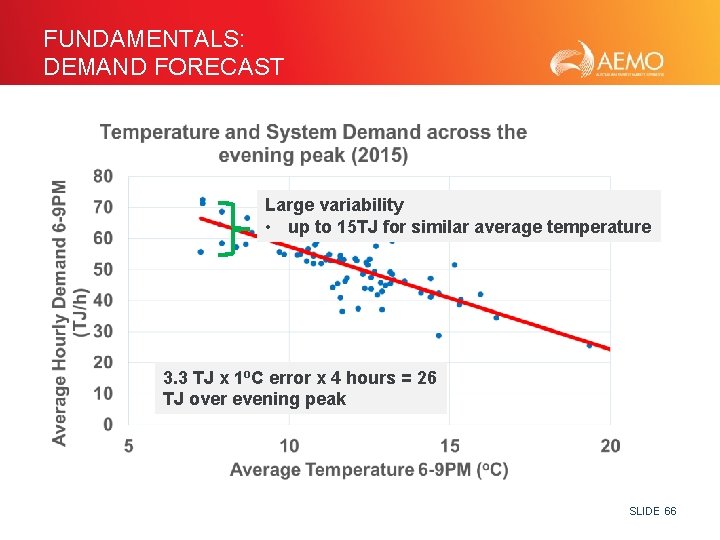
FUNDAMENTALS: DEMAND FORECAST Large variability Gradient = -3. 3 TJ / h / °C • up to 15 TJ for similar average temperature 3. 3 TJ x 1 o. C error x 4 hours = 26 TJ over evening peak SLIDE 66
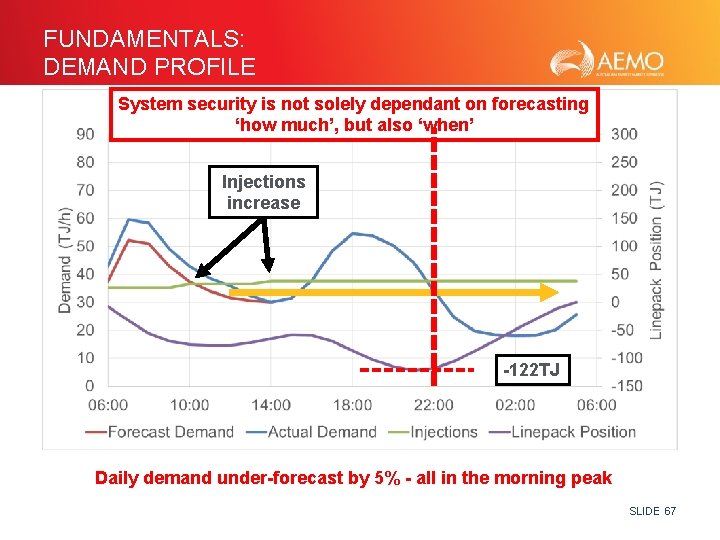
FUNDAMENTALS: DEMAND PROFILE System security is not solely dependant on forecasting ‘how much’, but also ‘when’ Injections increase -122 TJ Daily demand under-forecast by 5% - all in the morning peak SLIDE 67
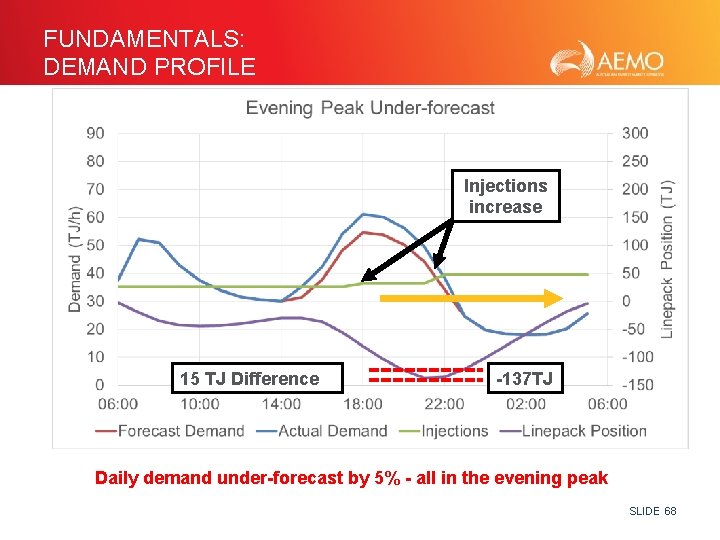
FUNDAMENTALS: DEMAND PROFILE Injections increase 15 TJ Difference -137 TJ Daily demand under-forecast by 5% - all in the evening peak SLIDE 68
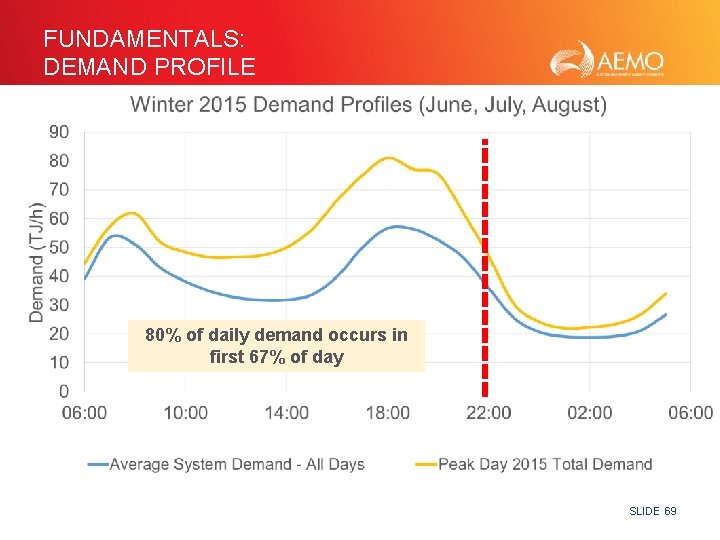
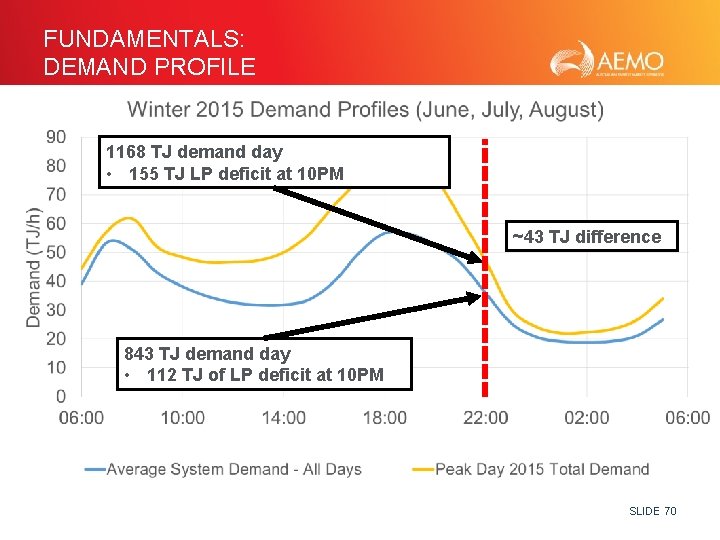
FUNDAMENTALS: DEMAND PROFILE 80% of daily demand occurs in first 67% of day SLIDE 69
FUNDAMENTALS: DEMAND PROFILE 1168 TJ demand day • 155 TJ LP deficit at 10 PM ~43 TJ difference 843 TJ demand day • 112 TJ of LP deficit at 10 PM SLIDE 70
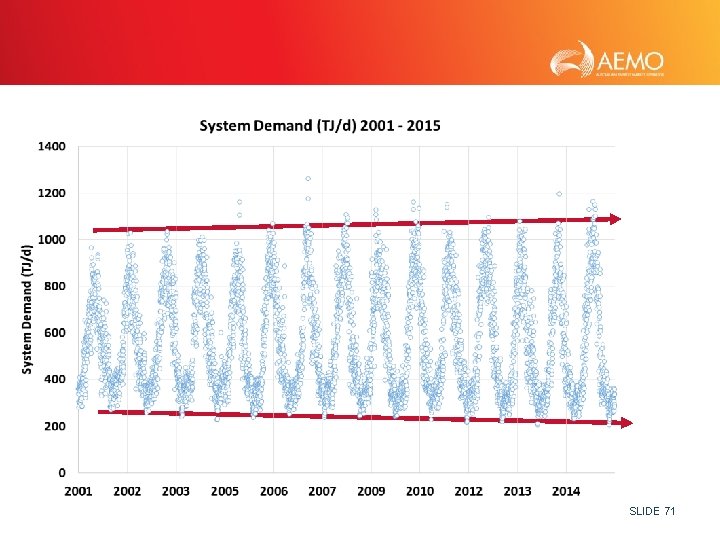
SLIDE 71
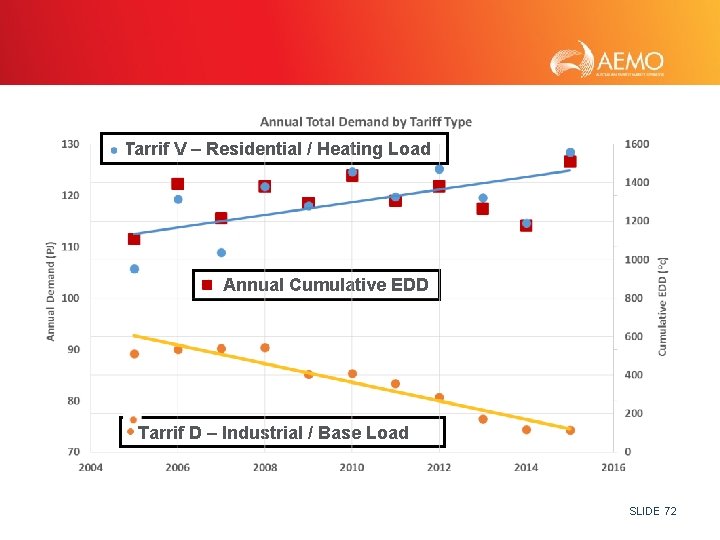
Tarrif V – Residential / Heating Load • Annual Cumulative EDD Tarrif D – Industrial / Base Load SLIDE 72
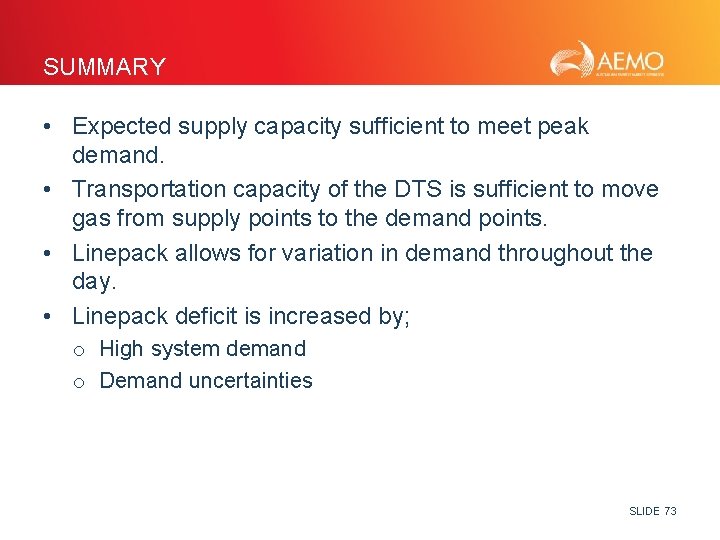
SUMMARY • Expected supply capacity sufficient to meet peak demand. • Transportation capacity of the DTS is sufficient to move gas from supply points to the demand points. • Linepack allows for variation in demand throughout the day. • Linepack deficit is increased by; o High system demand o Demand uncertainties SLIDE 73
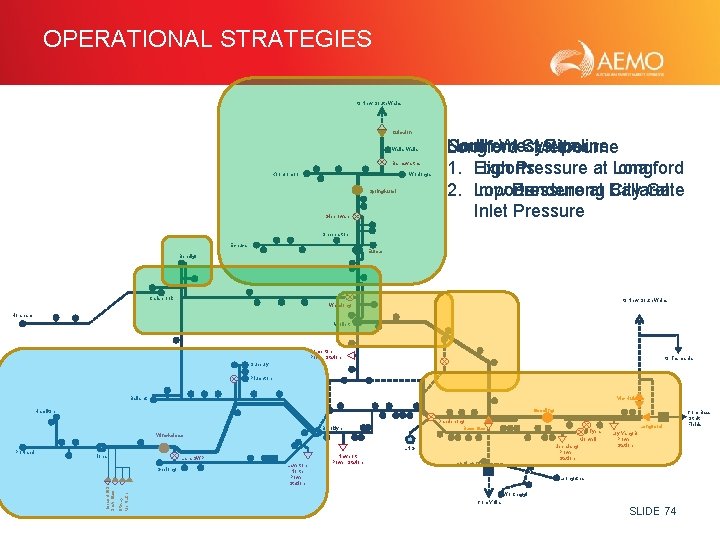
OPERATIONAL STRATEGIES to New South Wales Culcairn Walla Barnawartha Koonoomoo Wodonga Springhurst Glenrowan Northern System South West Pipeline Longford - Melbourne Exports 1. High Pressure at Iona High Pressure at Longford Imports 2. Low Pressure at Ballarat Low Dandenong City Gate Inlet Pressure Shepparton Echuca Euroa Bendigo Carisbrook to New South Wales Wandong Horsham Wollert Somerton Power Station to Tasmania Sunbury Plumpton Vic Hub Ballarat Gooding Hamilton Dandenong Bass Gas Brooklyn Longford Tyers Winchelsea Jeeralang Power Station LNG Iona Lara SWP Iona UGS SEA Gas Geelong Otway Mortlake Portland Morwell Laverton North Power Station Newport Power Station Lang Loy Yang B Power Station Leongatha Wonthaggi from Yolla SLIDE 74 from Bass Strait Fields
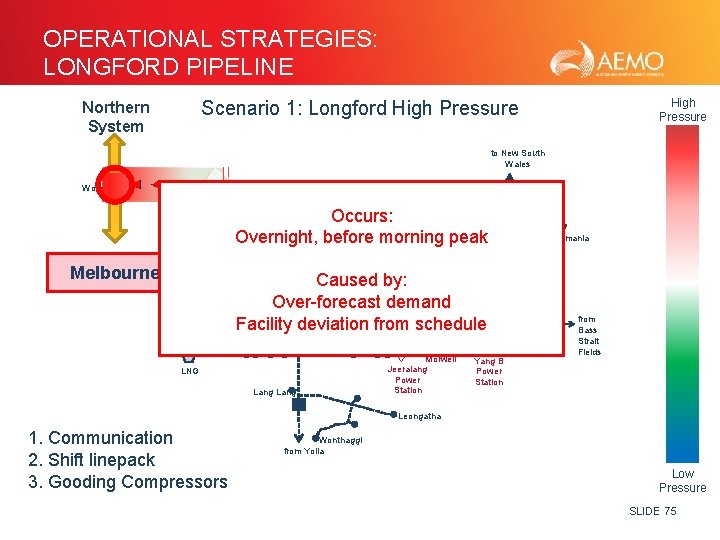
OPERATIONAL STRATEGIES: LONGFORD PIPELINE High Pressure Scenario 1: Longford High Pressure Northern System to New South Wales Wollert Occurs: Overnight, before morning peak Melbourne Caused by: Over-forecast demand Vic Hub Gooding Facility deviation from schedule Dandenong Bass Gas LNG Lang Tyers Morwell Jeeralang Power Station Loy Yang B Power Station to Tasmania Longford from Bass Strait Fields Leongatha 1. Communication 2. Shift linepack 3. Gooding Compressors Wonthaggi from Yolla Low Pressure SLIDE 75
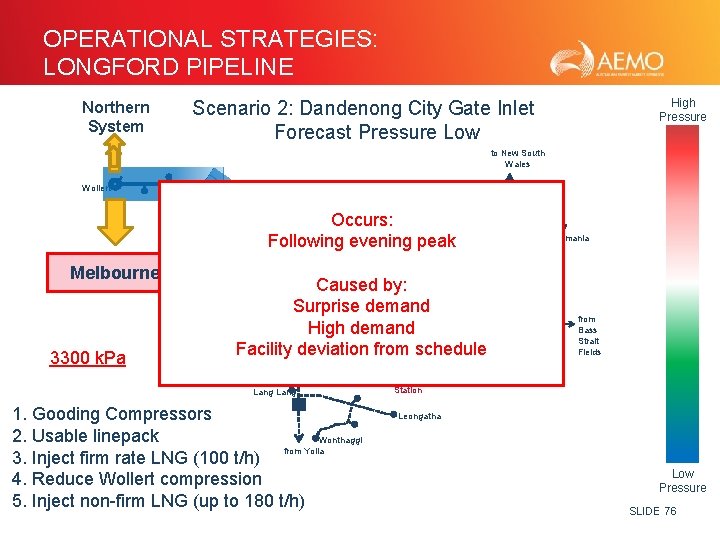
OPERATIONAL STRATEGIES: LONGFORD PIPELINE Northern System High Pressure Scenario 2: Dandenong City Gate Inlet Forecast Pressure Low to New South Wales Wollert Occurs: Following evening peak Melbourne 3300 k. Pa to Tasmania Caused by: Vic Hub Surprise demand Gooding High demand Dandenong Bass Gas Tyers Loy Facility deviation from schedule Morwell Yang B LNG Lang 1. Gooding Compressors 2. Usable linepack Wonthaggi from Yolla 3. Inject firm rate LNG (100 t/h) 4. Reduce Wollert compression 5. Inject non-firm LNG (up to 180 t/h) Jeeralang Power Station Longford from Bass Strait Fields Power Station Leongatha Low Pressure SLIDE 76
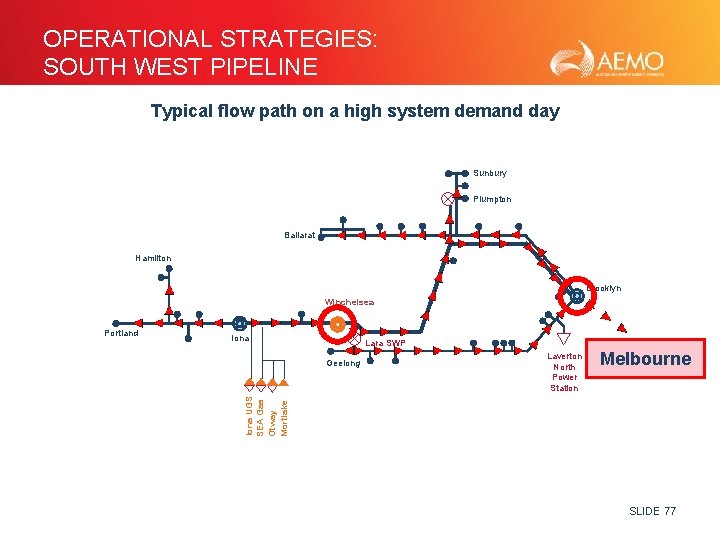
OPERATIONAL STRATEGIES: SOUTH WEST PIPELINE Typical flow path on a high system demand day Sunbury Plumpton Ballarat Hamilton Brooklyn Winchelsea Iona Lara SWP Geelong Laverton North Power Station Melbourne Iona UGS SEA Gas Otway Mortlake Portland SLIDE 77
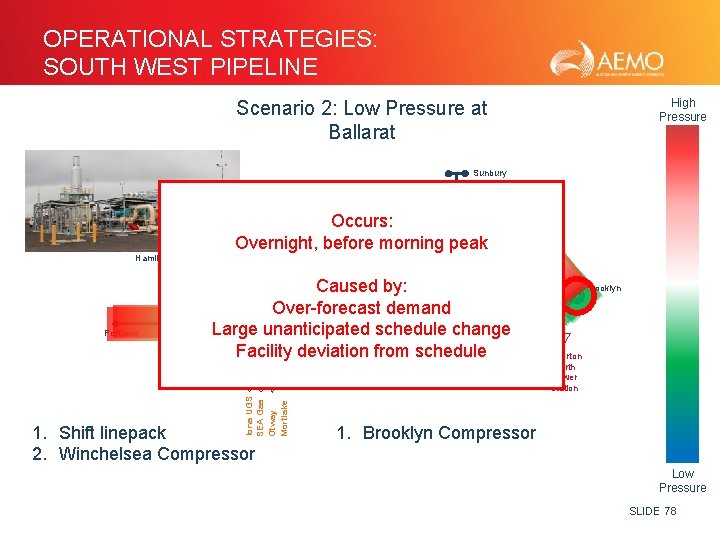
OPERATIONAL STRATEGIES: SOUTH WEST PIPELINE High Pressure Scenario 1: High Pressure at Iona Scenario 2: Low Pressure at Ballarat Sunbury Plumpton Occurs: Overnight, before morning peak Ballarat Hamilton Iona UGS SEA Gas Otway Mortlake Portland Caused by: Winchelsea Over-forecast demand Large unanticipated schedule change Iona Lara SWP Facility deviation from schedule Geelong 1. Shift linepack 2. Winchelsea Compressor Brooklyn Laverton North Power Station 1. Brooklyn Compressor Low Pressure SLIDE 78
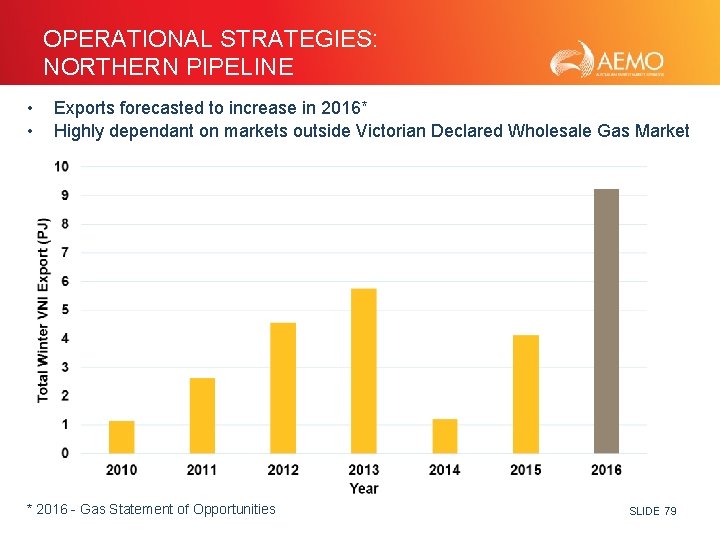
OPERATIONAL STRATEGIES: NORTHERN PIPELINE • • Exports forecasted to increase in 2016* Highly dependant on markets outside Victorian Declared Wholesale Gas Market * 2016 - Gas Statement of Opportunities SLIDE 79
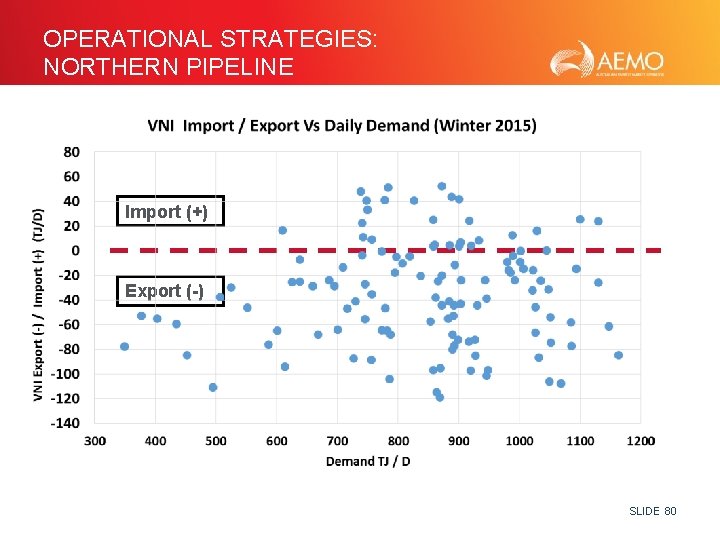
OPERATIONAL STRATEGIES: NORTHERN PIPELINE Import (+) Export (-) SLIDE 80
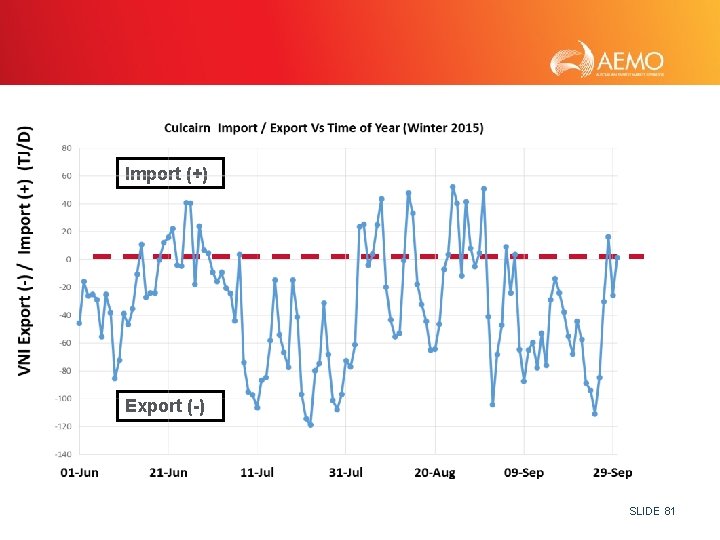
Import (+) Export (-) SLIDE 81
OPERATIONS OVERVIEW: 1 -IN-20 PEAK DAY SUPPLY AND DEMAND 1 -in-20 Peak Demand Day Supply 101 TJ 1 -in-20 Demand + VNI Exports 1452 TJ 148 TJ 446 TJ 905 TJ 1304 TJ SLIDE 82
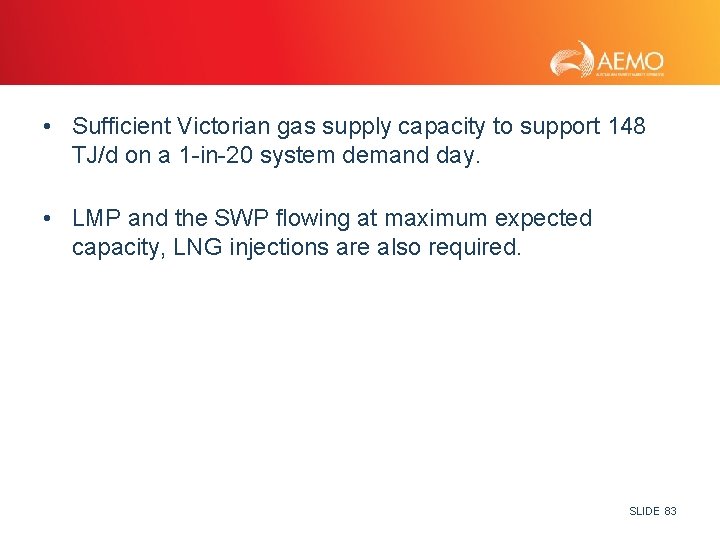
• Sufficient Victorian gas supply capacity to support 148 TJ/d on a 1 -in-20 system demand day. • LMP and the SWP flowing at maximum expected capacity, LNG injections are also required. SLIDE 83
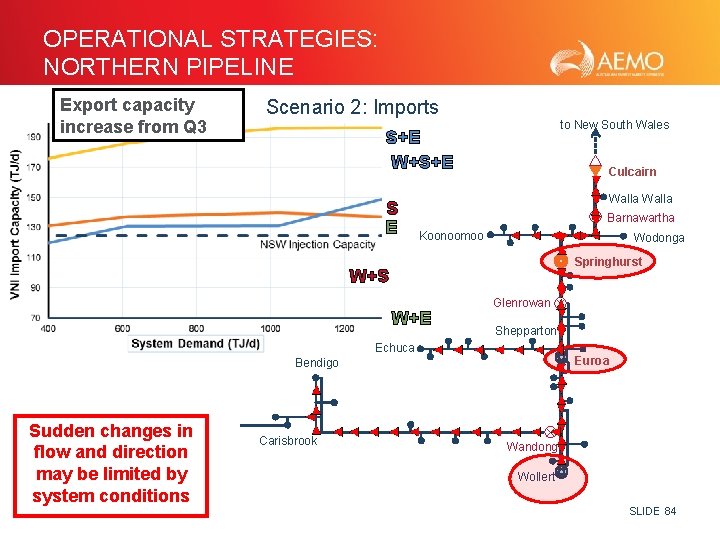
OPERATIONAL STRATEGIES: NORTHERN PIPELINE Export capacity increase from Q 3 Scenario 2: Imports Scenario 1: Exports to New South Wales S+E W+S+E S E Culcairn Walla Barnawartha Koonoomoo Wodonga Springhurst W+S W+E Glenrowan Shepparton Echuca Euroa Bendigo Sudden changes in flow and direction may be limited by system conditions Carisbrook Wandong Wollert SLIDE 84
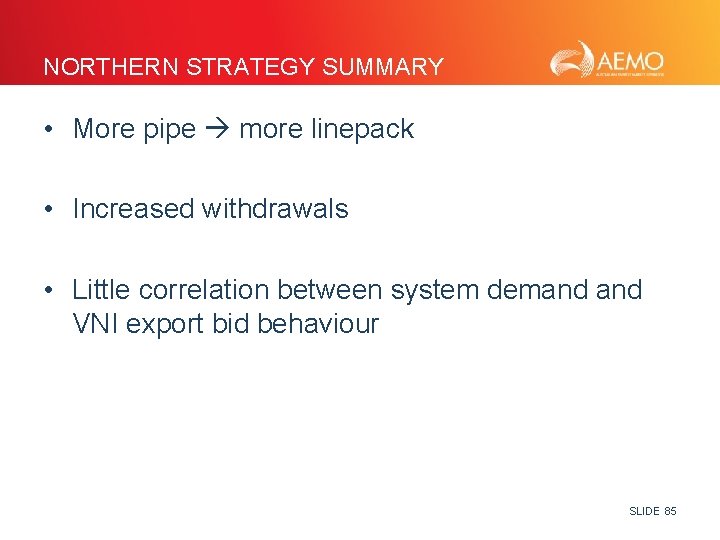
NORTHERN STRATEGY SUMMARY • More pipe more linepack • Increased withdrawals • Little correlation between system demand VNI export bid behaviour SLIDE 85
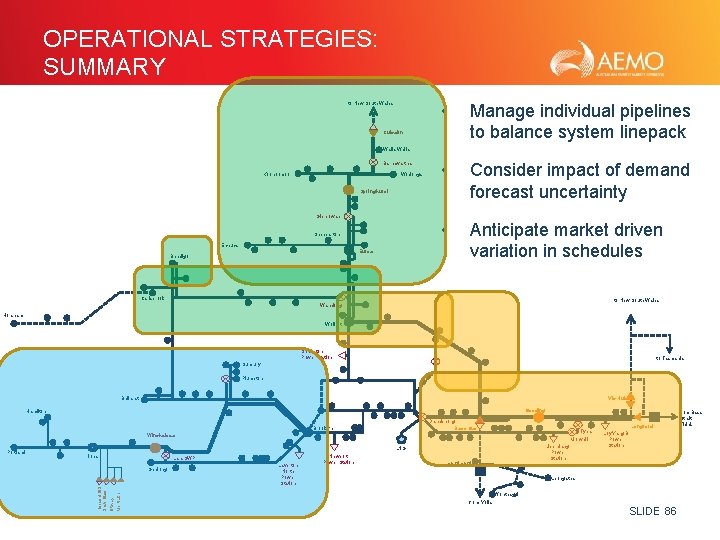
OPERATIONAL STRATEGIES: SUMMARY to New South Wales • Manage individual pipelines to balance system linepack • Consider impact of demand forecast uncertainty • Anticipate market driven variation in schedules Culcairn Walla Barnawartha Koonoomoo Wodonga Springhurst Glenrowan Shepparton Echuca Euroa Bendigo Carisbrook to New South Wales Wandong Horsham Wollert Somerton Power Station to Tasmania Sunbury Plumpton Vic Hub Ballarat Gooding Hamilton Dandenong Bass Gas Brooklyn Longford Tyers Winchelsea Jeeralang Power Station LNG Iona Lara SWP Iona UGS SEA Gas Geelong Otway Mortlake Portland Morwell Laverton North Power Station Newport Power Station Lang Loy Yang B Power Station Leongatha Wonthaggi from Yolla SLIDE 86 from Bass Strait Fields
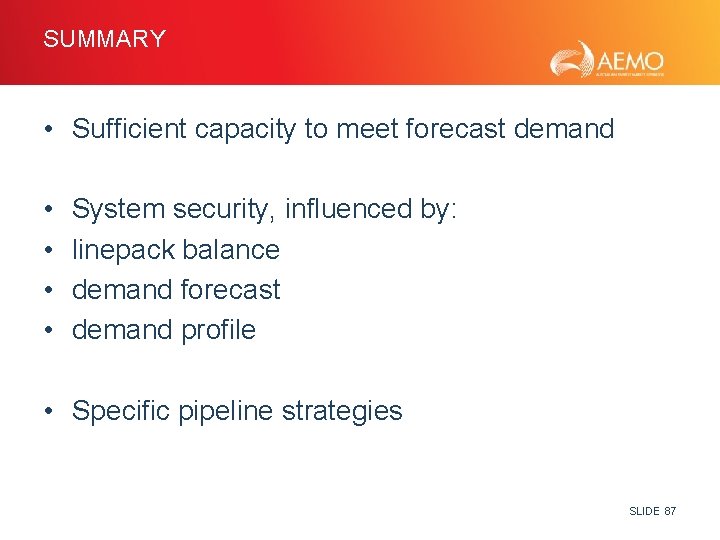
SUMMARY • Sufficient capacity to meet forecast demand • • System security, influenced by: linepack balance demand forecast demand profile • Specific pipeline strategies SLIDE 87
QUESTIONS? SLIDE 88
SESSION 2 3: 00 - 3: 30 Afternoon tea 3: 30 - 5: 00 Session 2 • • 5: 00 - 6: 00 Market operations Peak day – case study Emergency management Announcements and Q & A Networking SLIDE 89
MARKET OPERATIONS Presented by Christine Kang Senior Analyst, AEMO Gas System Operations SLIDE 90
MARKET OPERATIONS What my friends think I do SLIDE 91
MARKET OPERATIONS What I think I do SLIDE 92
MARKET OPERATIONS SWN What participants think we do SLIDE 93
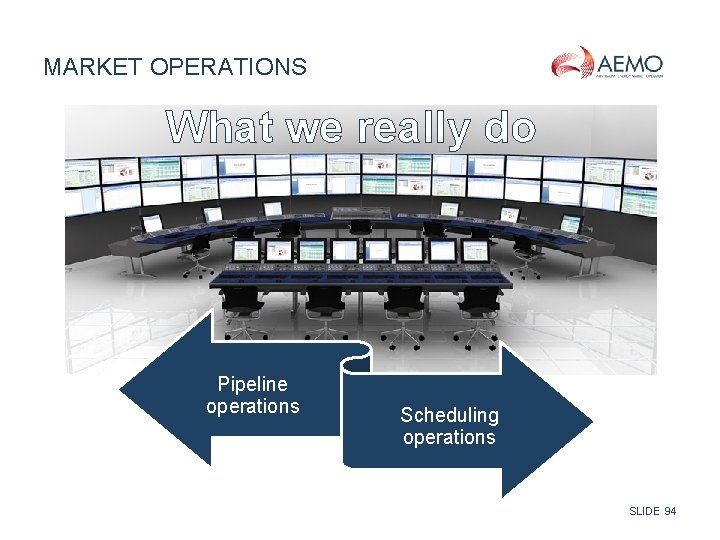
MARKET OPERATIONS What we really do Pipeline operations Scheduling operations SLIDE 94
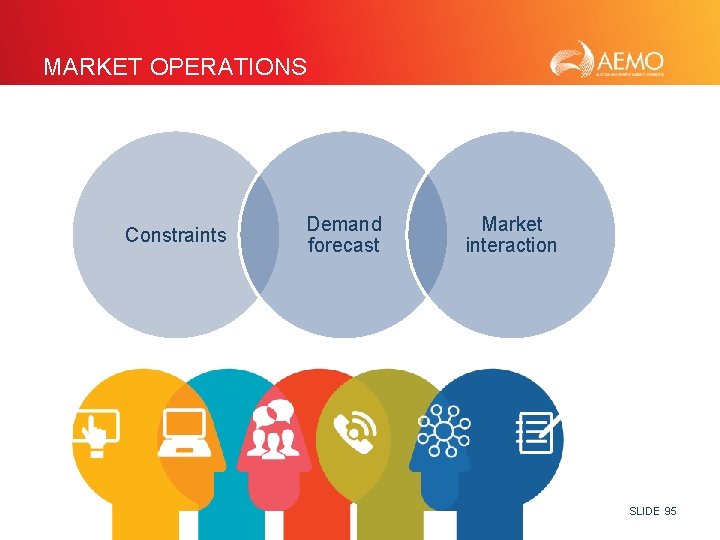
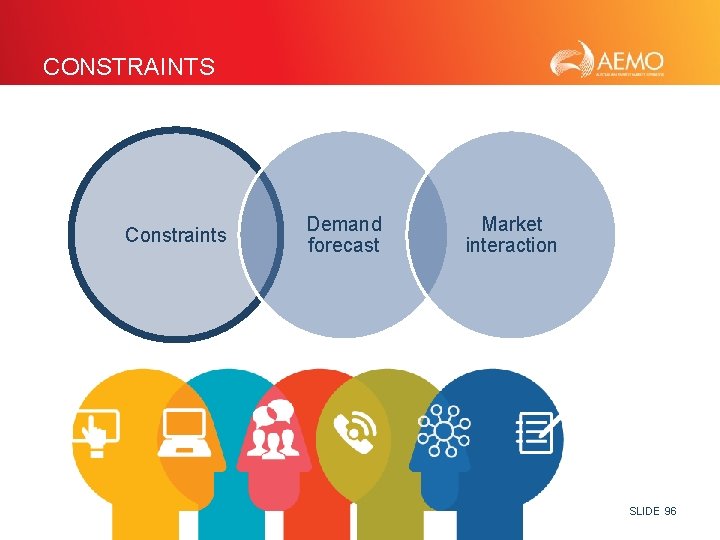
MARKET OPERATIONS Constraints Demand forecast Market interaction SLIDE 95
CONSTRAINTS Constraints Demand forecast Market interaction SLIDE 96
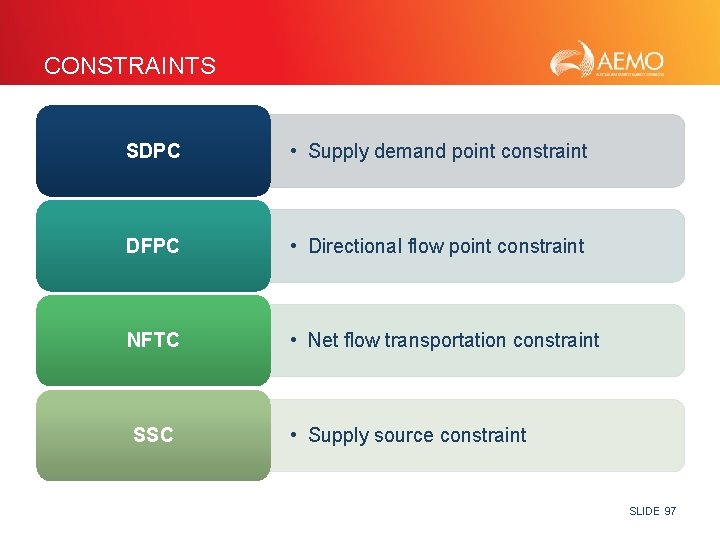
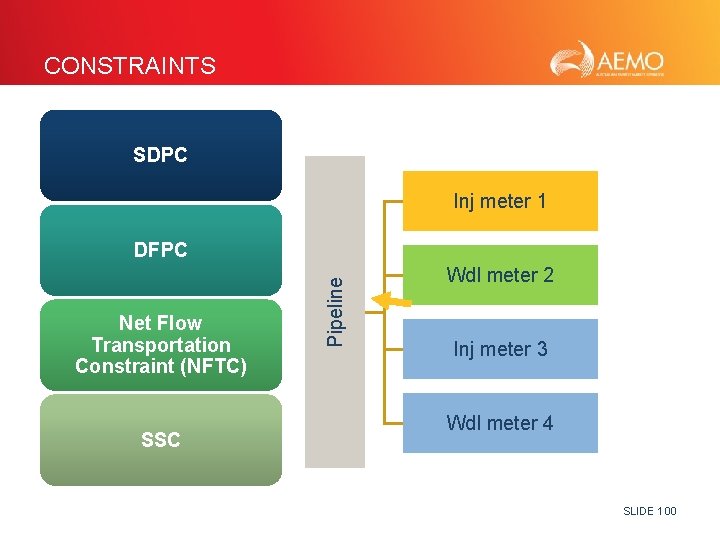
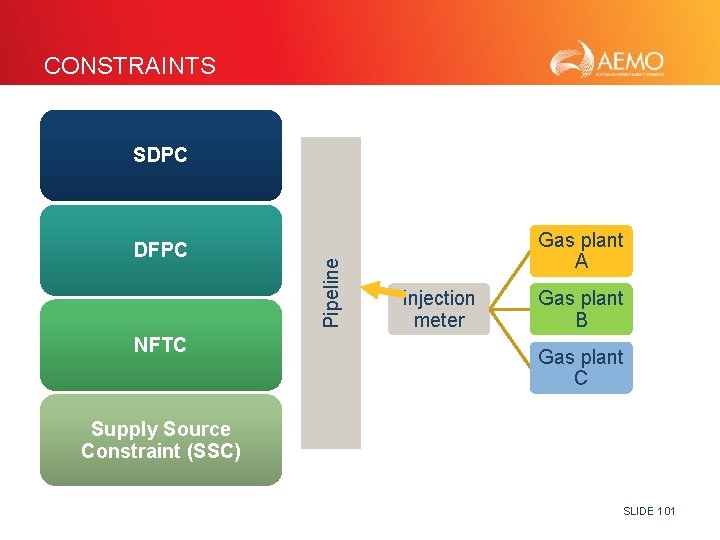
CONSTRAINTS SDPC • Supply demand point constraint DFPC • Directional flow point constraint NFTC • Net flow transportation constraint SSC • Supply source constraint SLIDE 97
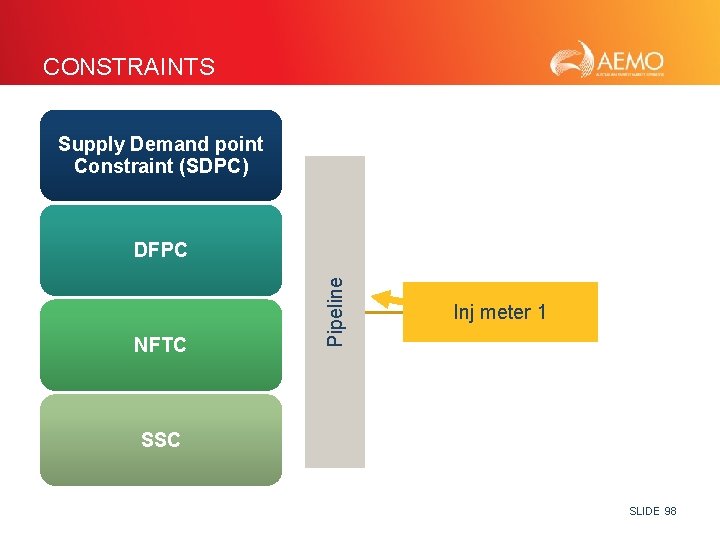
CONSTRAINTS Supply Demand point Constraint (SDPC) NFTC Pipeline DFPC Inj meter 1 SSC SLIDE 98
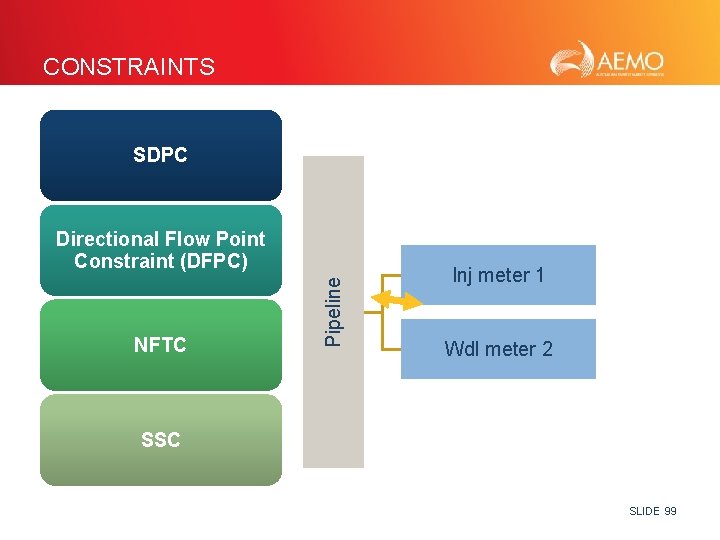
CONSTRAINTS SDPC NFTC Pipeline Directional Flow Point Constraint (DFPC) Inj meter 1 Wdl meter 2 SSC SLIDE 99
CONSTRAINTS SDPC Inj meter 1 Net Flow Transportation Constraint (NFTC) SSC Pipeline DFPC Wdl meter 2 Inj meter 3 Wdl meter 4 SLIDE 100
CONSTRAINTS DFPC NFTC Pipeline SDPC Gas plant A Injection meter Gas plant B Gas plant C Supply Source Constraint (SSC) SLIDE 101
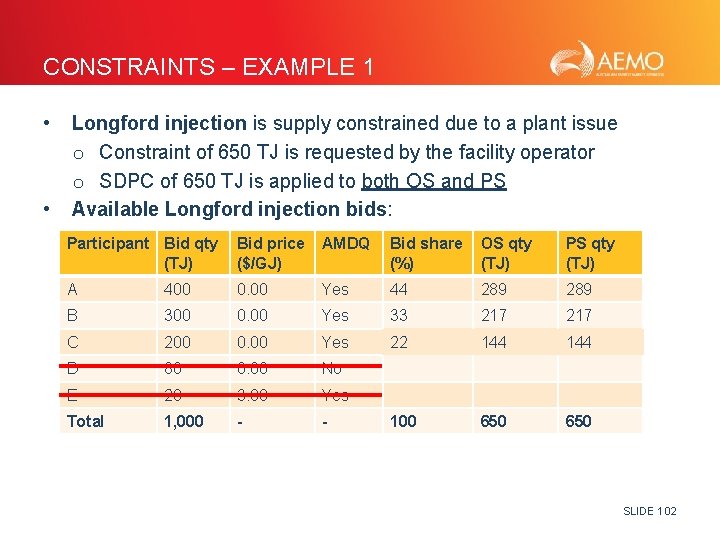
CONSTRAINTS – EXAMPLE 1 • • Longford injection is supply constrained due to a plant issue o Constraint of 650 TJ is requested by the facility operator o SDPC of 650 TJ is applied to both OS and PS Available Longford injection bids: Participant Bid qty (TJ) Bid price ($/GJ) AMDQ Bid share (%) OS qty (TJ) PS qty (TJ) A 400 0. 00 Yes 44 289 B 300 0. 00 Yes 33 217 C 200 0. 00 Yes 22 144 D 80 0. 00 No E 20 3. 00 Yes Total 1, 000 - - 100 650 SLIDE 102
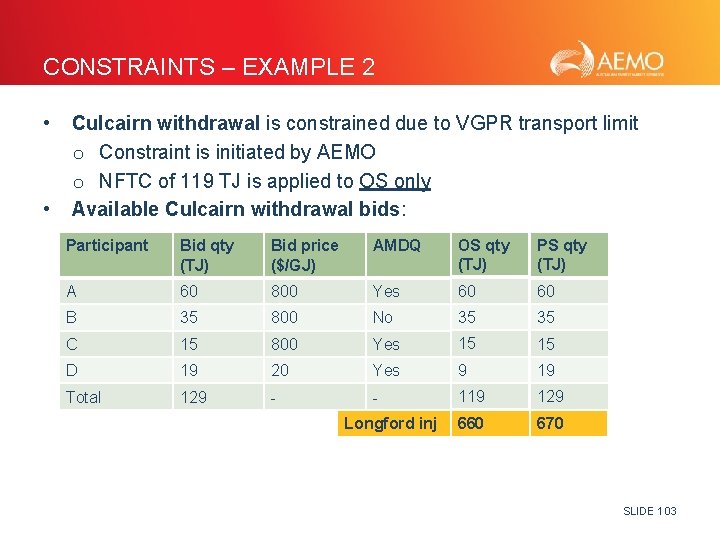
CONSTRAINTS – EXAMPLE 2 • • Culcairn withdrawal is constrained due to VGPR transport limit o Constraint is initiated by AEMO o NFTC of 119 TJ is applied to OS only Available Culcairn withdrawal bids: Participant Bid qty (TJ) Bid price ($/GJ) AMDQ OS qty (TJ) PS qty (TJ) A 60 800 Yes 60 60 B 35 800 No 35 35 C 15 800 Yes 15 15 D 19 20 Yes 9 19 Total 129 - - 119 129 660 670 Longford inj SLIDE 103
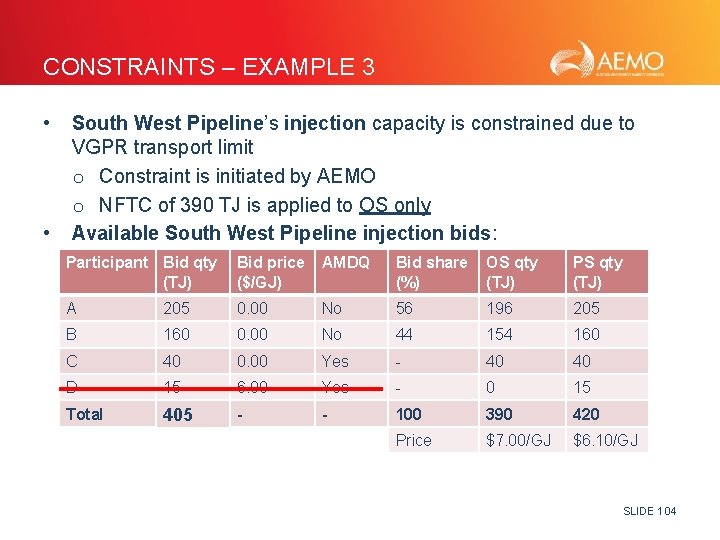
CONSTRAINTS – EXAMPLE 3 • • South West Pipeline’s injection capacity is constrained due to VGPR transport limit o Constraint is initiated by AEMO o NFTC of 390 TJ is applied to OS only Available South West Pipeline injection bids: Participant Bid qty (TJ) Bid price ($/GJ) AMDQ Bid share (%) OS qty (TJ) PS qty (TJ) A 205 0. 00 No 56 196 205 B 160 0. 00 No 44 154 160 C 40 0. 00 Yes - 40 40 D 15 6. 00 Yes - 0 15 Total 420 405 - - 100 390 420 Price $7. 00/GJ $6. 10/GJ SLIDE 104
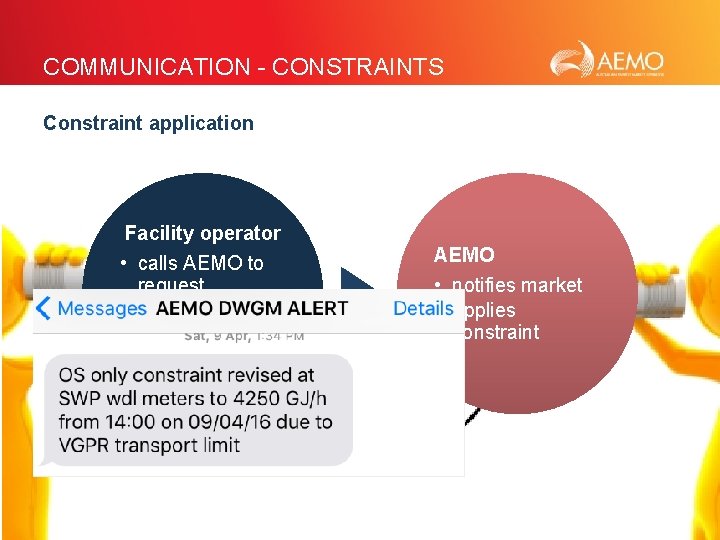
COMMUNICATION - CONSTRAINTS Constraint application Facility operator • calls AEMO to request constraint • confirms request in writing AEMO • notifies market • applies constraint SLIDE 105
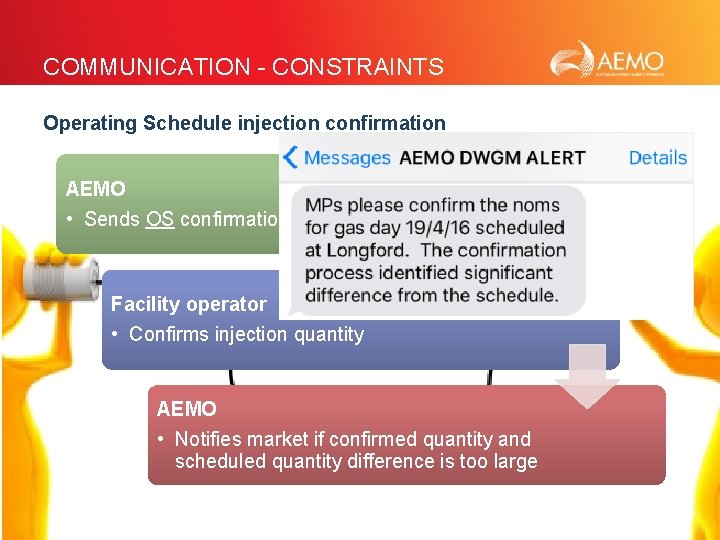
COMMUNICATION - CONSTRAINTS Operating Schedule injection confirmation AEMO • Sends OS confirmation to facility operator Facility operator • Confirms injection quantity AEMO • Notifies market if confirmed quantity and scheduled quantity difference is too large SLIDE 106
SLIDE 107
DEMAND FORECAST Constraints Demand forecast Market interaction SLIDE 108
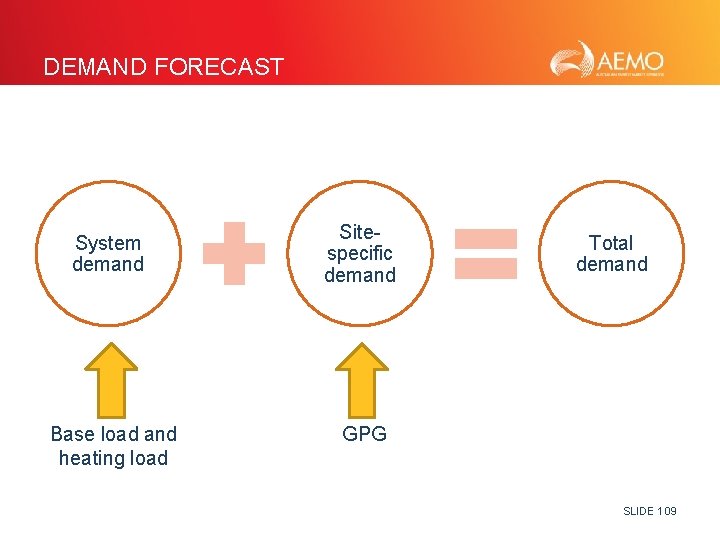
DEMAND FORECAST System demand Base load and heating load Sitespecific demand Total demand GPG SLIDE 109
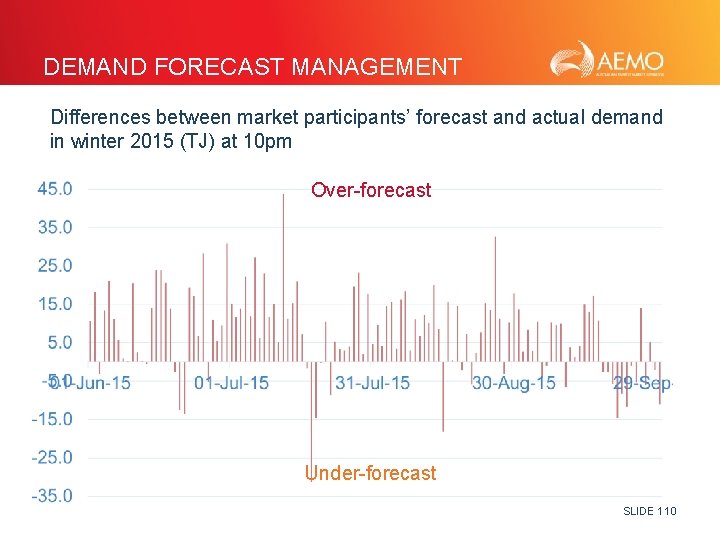
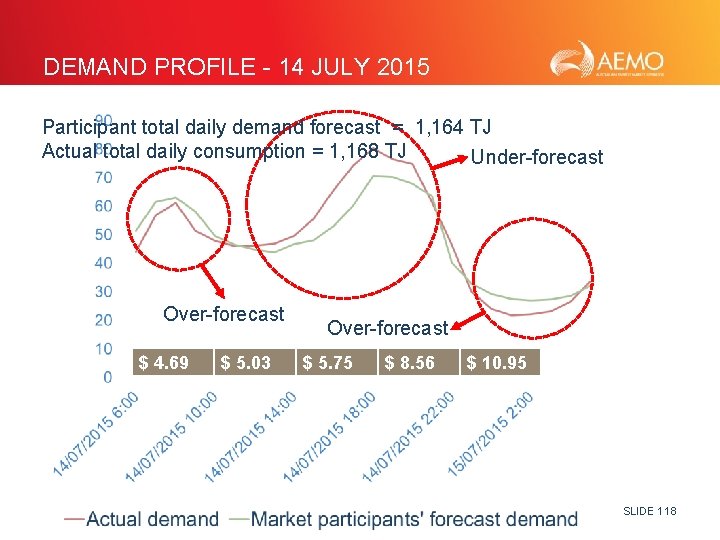
DEMAND FORECAST MANAGEMENT Differences between market participants’ forecast and actual demand in winter 2015 (TJ) at 10 pm Over-forecast Under-forecast SLIDE 110
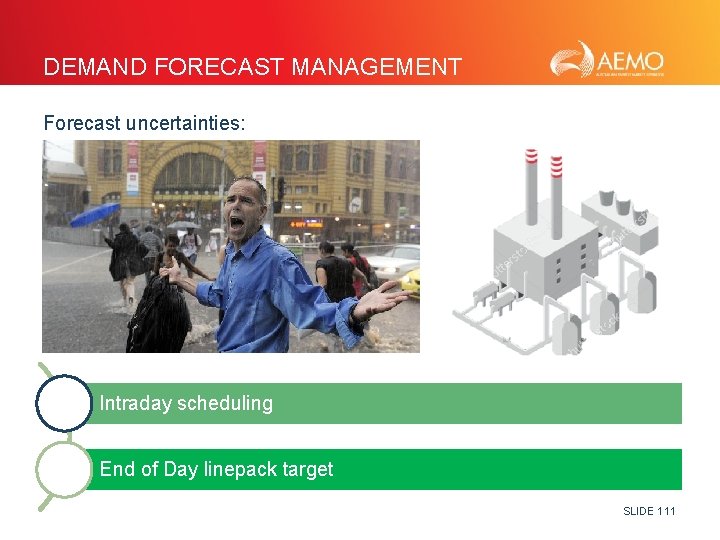
DEMAND FORECAST MANAGEMENT Forecast uncertainties: Intraday scheduling End of Day linepack target SLIDE 111
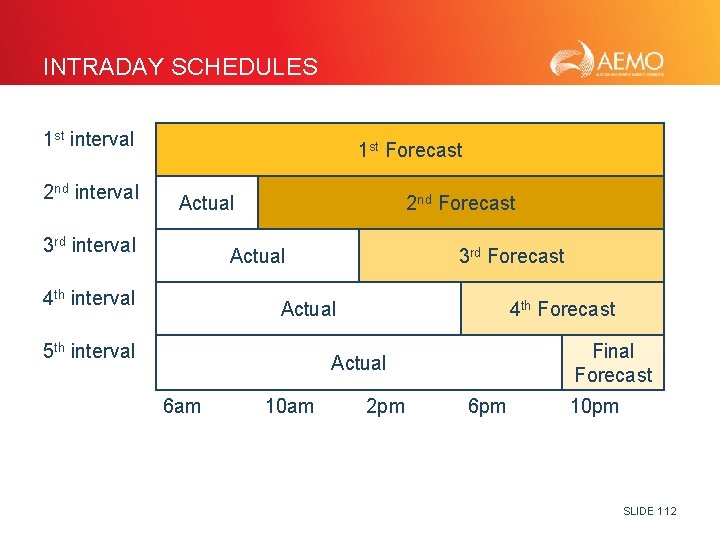
INTRADAY SCHEDULES 1 st interval 2 nd interval 1 st Forecast Actual 3 rd interval 2 nd Forecast Actual 4 th interval 3 rd Forecast Actual 5 th interval 4 th Forecast Final Forecast Actual 6 am 10 am 2 pm 6 pm 10 pm SLIDE 112
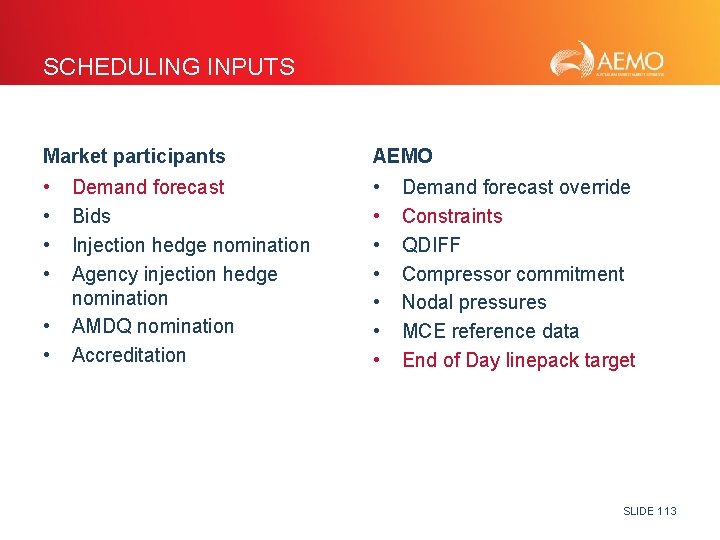
SCHEDULING INPUTS Market participants AEMO • • • • Demand forecast Bids Injection hedge nomination Agency injection hedge nomination AMDQ nomination Accreditation Demand forecast override Constraints QDIFF Compressor commitment Nodal pressures MCE reference data End of Day linepack target SLIDE 113
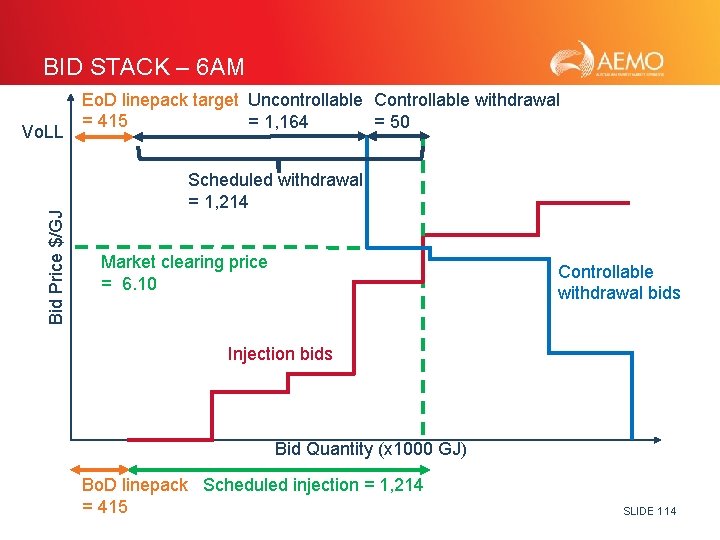
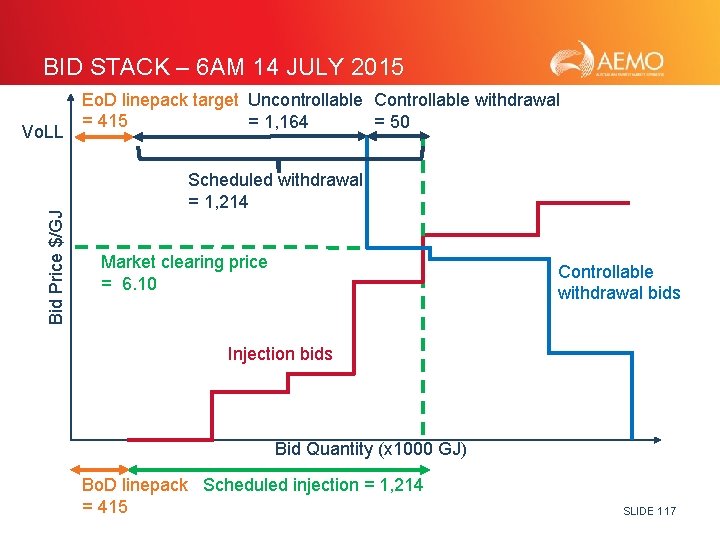
BID STACK – 6 AM Bid Price $/GJ Vo. LL Eo. D linepack target Uncontrollable Controllable withdrawal = 415 = 1, 164 = 50 Scheduled withdrawal = 1, 214 Market clearing price = 6. 10 Controllable withdrawal bids Injection bids Bid Quantity (x 1000 GJ) Bo. D linepack Scheduled injection = 1, 214 = 415 SLIDE 114
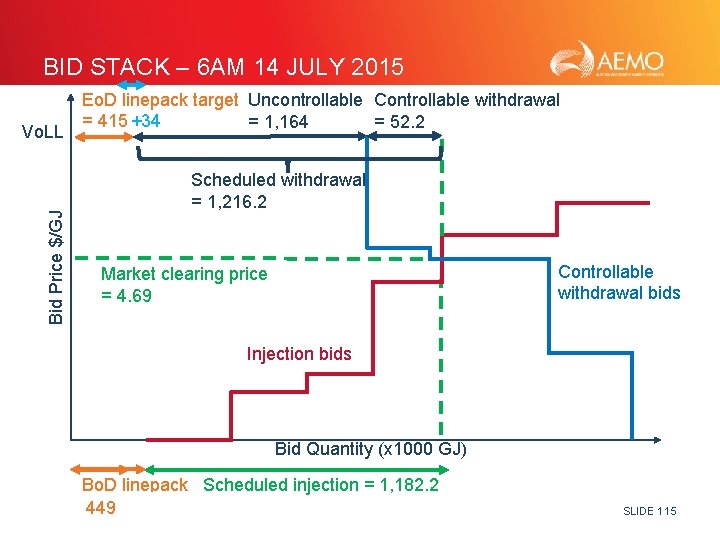
BID STACK – 6 AM 14 JULY 2015 Bid Price $/GJ Vo. LL Eo. D linepack target Uncontrollable Controllable withdrawal = 415 +34 = 1, 164 = 52. 2 Scheduled withdrawal = 1, 216. 2 Controllable withdrawal bids Market clearing price = 4. 69 Injection bids Bid Quantity (x 1000 GJ) Bo. D linepack Scheduled injection = 1, 182. 2 = 415 449 SLIDE 115
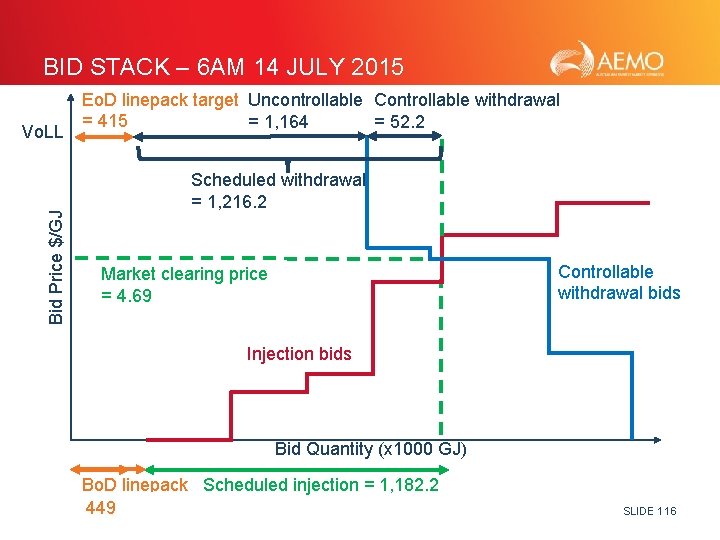
BID STACK – 6 AM 14 JULY 2015 Bid Price $/GJ Vo. LL Eo. D linepack target Uncontrollable Controllable withdrawal = 415 = 1, 164 = 52. 2 Scheduled withdrawal = 1, 216. 2 Controllable withdrawal bids Market clearing price = 4. 69 Injection bids Bid Quantity (x 1000 GJ) Bo. D linepack Scheduled injection = 1, 182. 2 = 415 449 SLIDE 116
BID STACK – 6 AM 14 JULY 2015 Bid Price $/GJ Vo. LL Eo. D linepack target Uncontrollable Controllable withdrawal = 415 = 1, 164 = 50 Scheduled withdrawal = 1, 214 Market clearing price = 6. 10 Controllable withdrawal bids Injection bids Bid Quantity (x 1000 GJ) Bo. D linepack Scheduled injection = 1, 214 = 415 SLIDE 117
DEMAND PROFILE - 14 JULY 2015 Participant total daily demand forecast = 1, 164 TJ Actual total daily consumption = 1, 168 TJ Under-forecast Over-forecast $ 4. 69 $ 5. 03 Over-forecast $ 5. 75 $ 8. 56 $ 10. 95 SLIDE 118
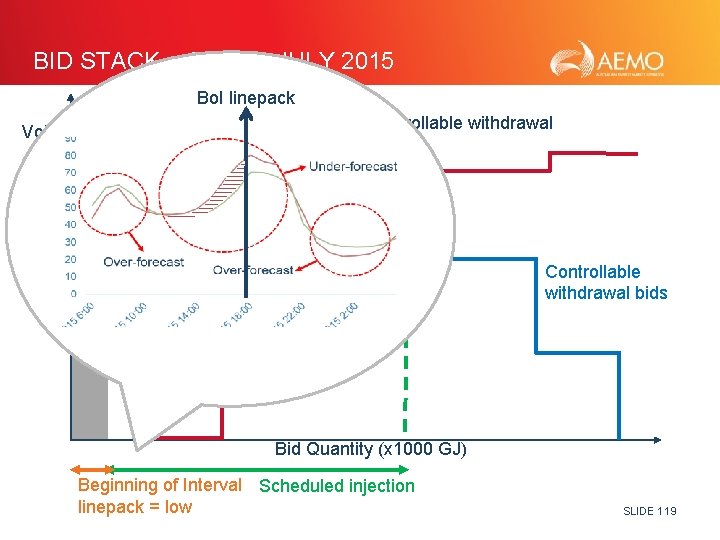
BID STACK – 6 PM 14 JULY 2015 Bid Price $/GJ Vo. LL Bo. I linepack Eo. D linepack target = 415 Uncontrollable Controllable withdrawal Market clearing price = $ 8. 56 Controllable withdrawal bids A Injection bids Bid Quantity (x 1000 GJ) Beginning of Interval Scheduled injection linepack = low SLIDE 119
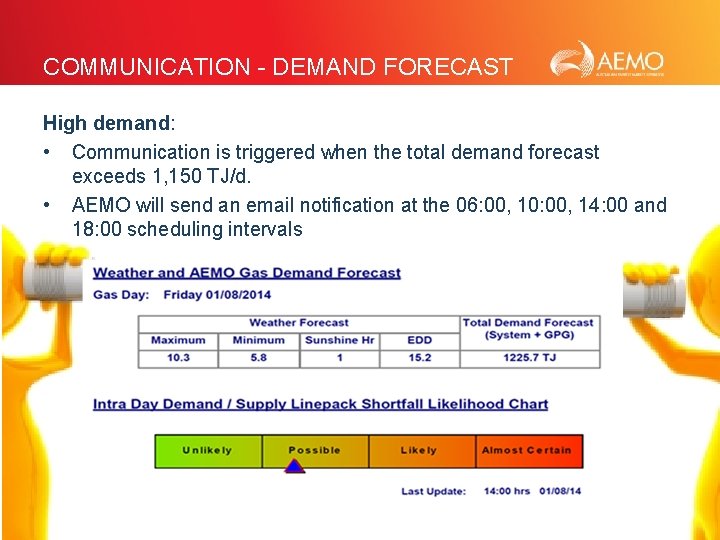
COMMUNICATION - DEMAND FORECAST High demand: • Communication is triggered when the total demand forecast exceeds 1, 150 TJ/d. • AEMO will send an email notification at the 06: 00, 10: 00, 14: 00 and 18: 00 scheduling intervals SLIDE 120
COMMUNICATION - DEMAND FORECAST High EDD o Changes between schedules o For example, EDD >14. 0 °C and increases by 1. 0 °C: “EDD increase alert, since the last schedule the EDD has increased from 14. 5°C to 15. 6°C” SLIDE 121
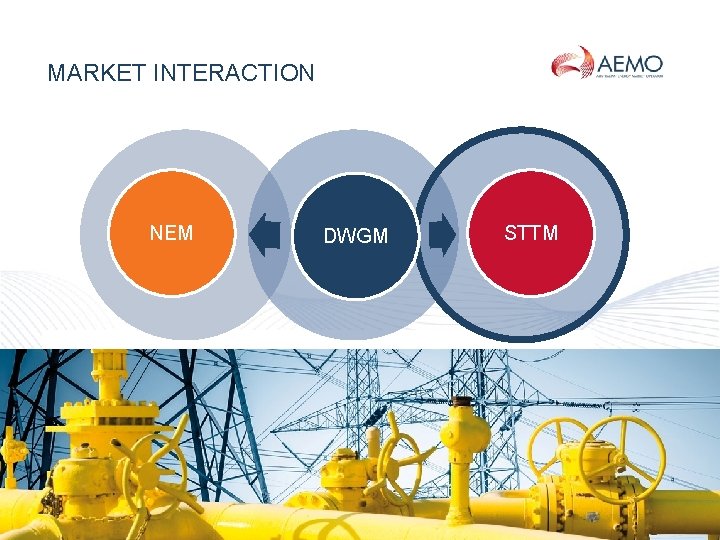
MARKET INTERACTION NEM Constraints Demand DWGM forecast Market STTM interaction SLIDE 122
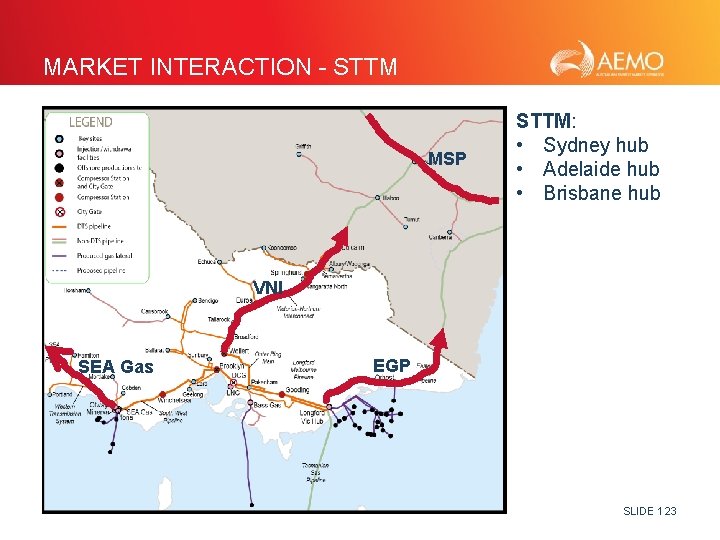
MARKET INTERACTION - STTM MSP STTM: • Sydney hub • Adelaide hub • Brisbane hub VNI SEA Gas EGP SLIDE 123
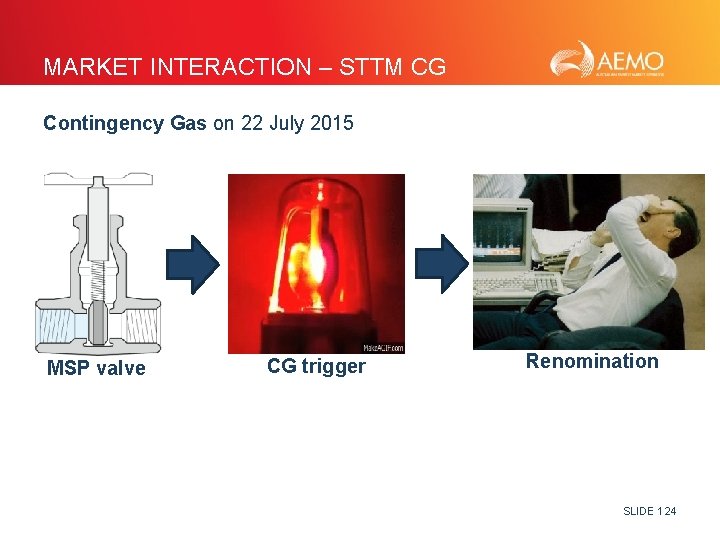
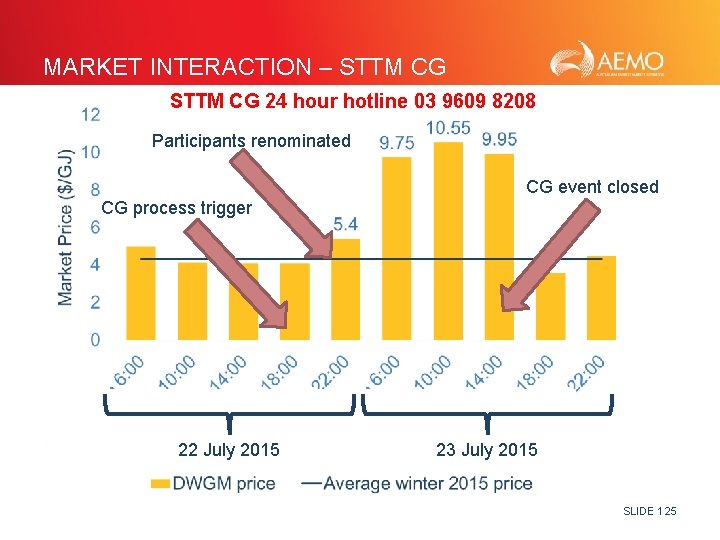
MARKET INTERACTION – STTM CG Contingency Gas on 22 July 2015 MSP valve CG trigger Renomination SLIDE 124
MARKET INTERACTION – STTM CG 24 hour hotline 03 9609 8208 Participants renominated CG event closed CG process trigger 22 July 2015 23 July 2015 SLIDE 125
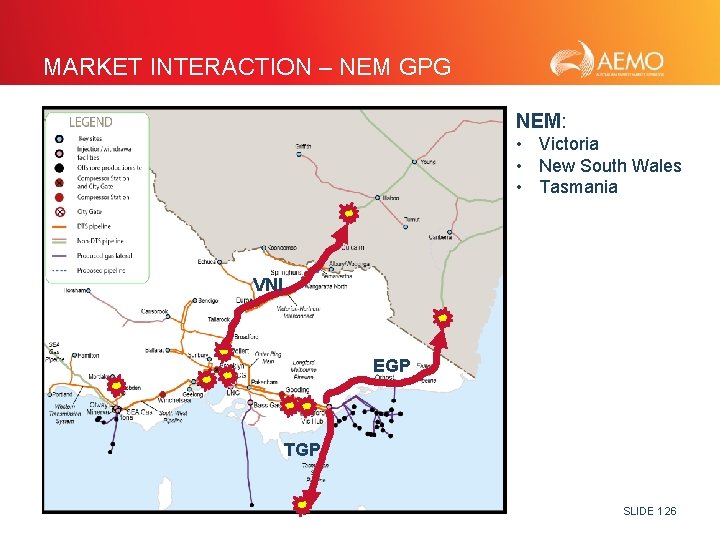
MARKET INTERACTION – NEM GPG NEM: • Victoria • New South Wales • Tasmania VNI EGP TGP SLIDE 126
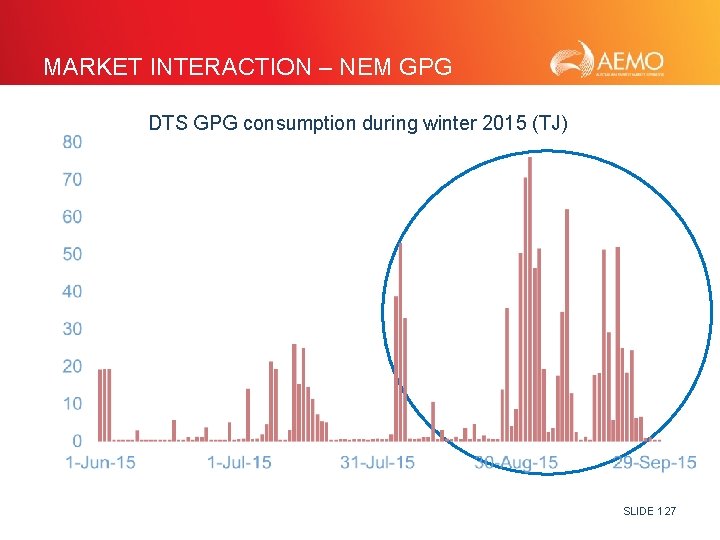
MARKET INTERACTION – NEM GPG DTS GPG consumption during winter 2015 (TJ) SLIDE 127
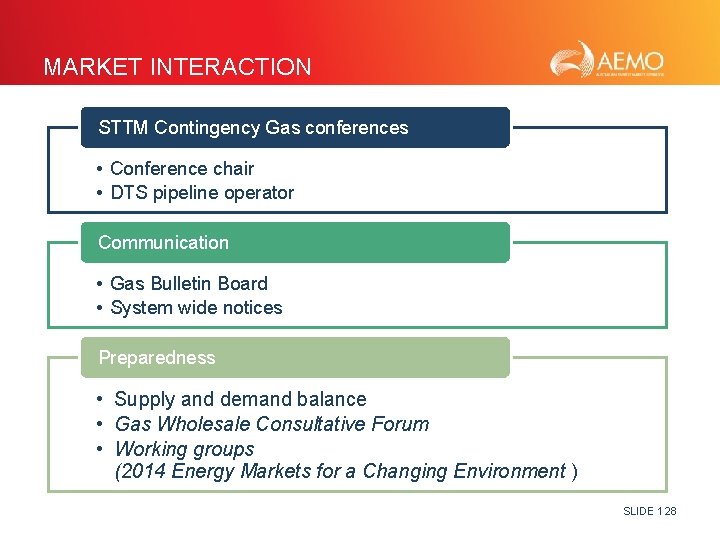
MARKET INTERACTION STTM Contingency Gas conferences • Conference chair • DTS pipeline operator Communication • Gas Bulletin Board • System wide notices Preparedness • Supply and demand balance • Gas Wholesale Consultative Forum • Working groups (2014 Energy Markets for a Changing Environment ) SLIDE 128
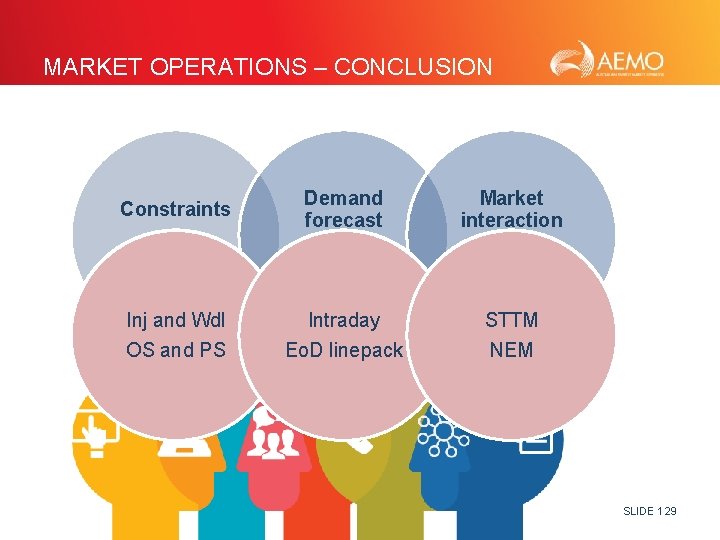
MARKET OPERATIONS – CONCLUSION Constraints Demand forecast Market interaction Inj and Wdl Confirm OS OS and PS Intraday Update intraday Eo. D linepack STTM Be engaged NEM SLIDE 129
What we hope now you think we do SLIDE 130
PEAK DAY MANAGEMENT Presented by Mark Pollock Gas Operations Engineer, AEMO Gas Real Time Operations SLIDE 131
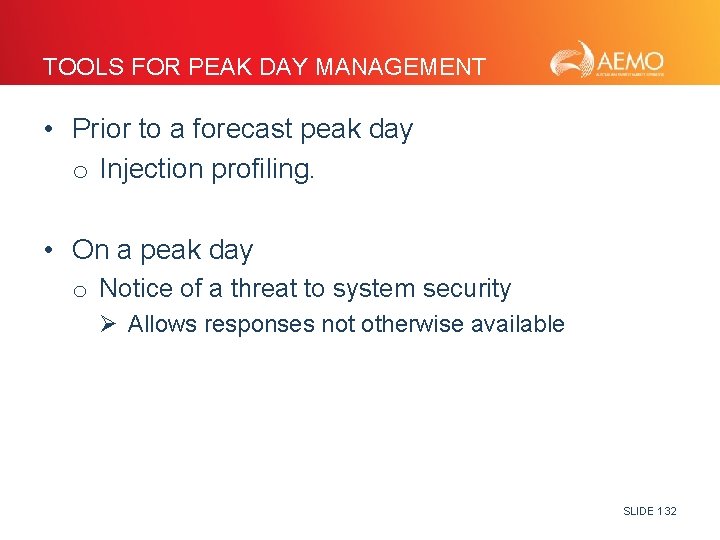
TOOLS FOR PEAK DAY MANAGEMENT • Prior to a forecast peak day o Injection profiling. • On a peak day o Notice of a threat to system security Ø Allows responses not otherwise available SLIDE 132
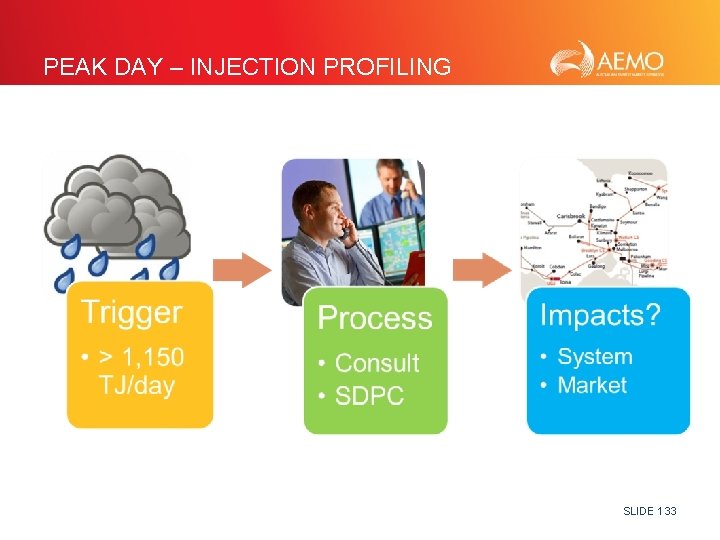
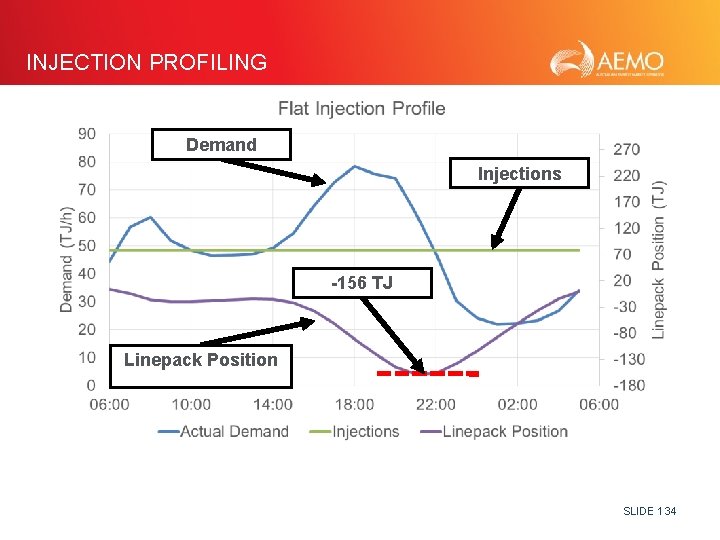
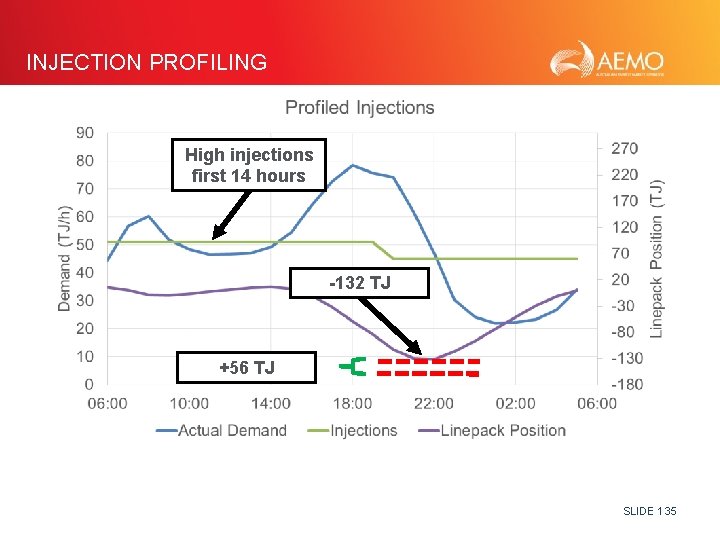
PEAK DAY – INJECTION PROFILING SLIDE 133
INJECTION PROFILING Demand Injections -156 TJ Linepack Position SLIDE 134
INJECTION PROFILING High injections first 14 hours -132 TJ +56 TJ SLIDE 135
PEAK DAY MANAGEMENT - THREAT • AEMO monitors the system to identify operational conditions that lead to a threat to system security. o Increasing demand o Reduction in supply SLIDE 136
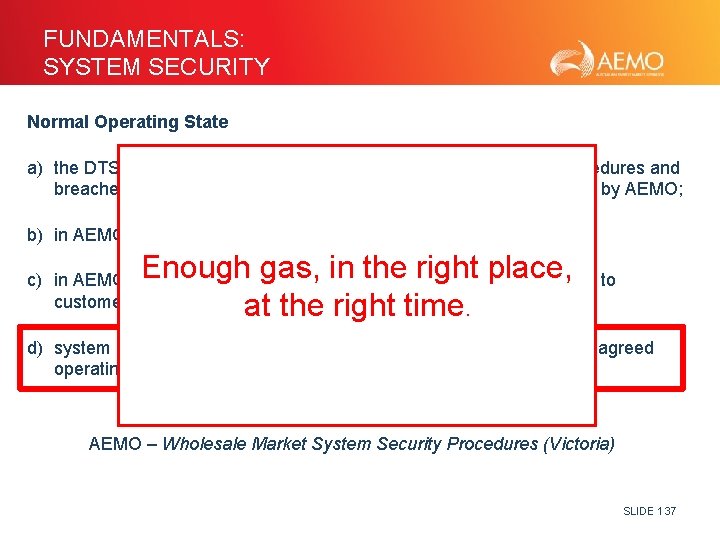
FUNDAMENTALS: SYSTEM SECURITY Normal Operating State a) the DTS is operating within the requirements of the gas quality procedures and breaches of the gas quality specifications do not require intervention by AEMO; b) in AEMO's reasonable opinion there is no threat to public safety; Enough gas, in the right place, at the right time c) in AEMO's reasonable opinion there is no threat to the supply of gas to customers; and. d) system pressures and flows are within, and forecast to be within the agreed operating limits AEMO – Wholesale Market System Security Procedures (Victoria) SLIDE 137
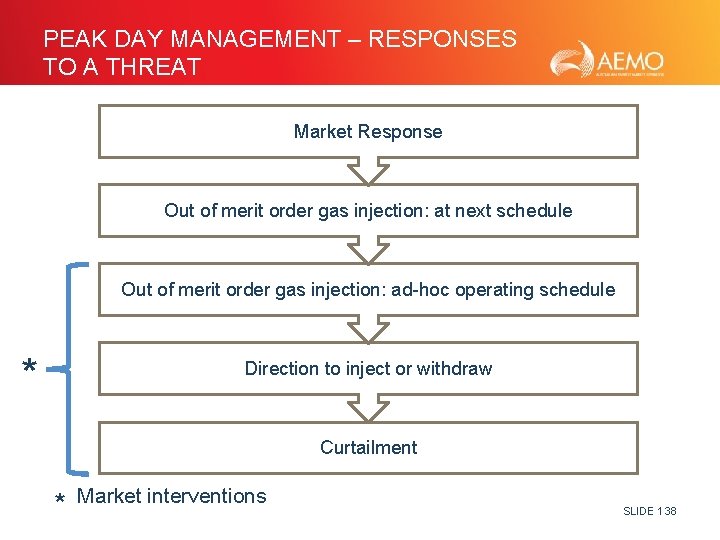
PEAK DAY MANAGEMENT – RESPONSES TO A THREAT Market Response Out of merit order gas injection: at next schedule Out of merit order gas injection: ad-hoc operating schedule * Direction to inject or withdraw Curtailment * Market interventions SLIDE 138
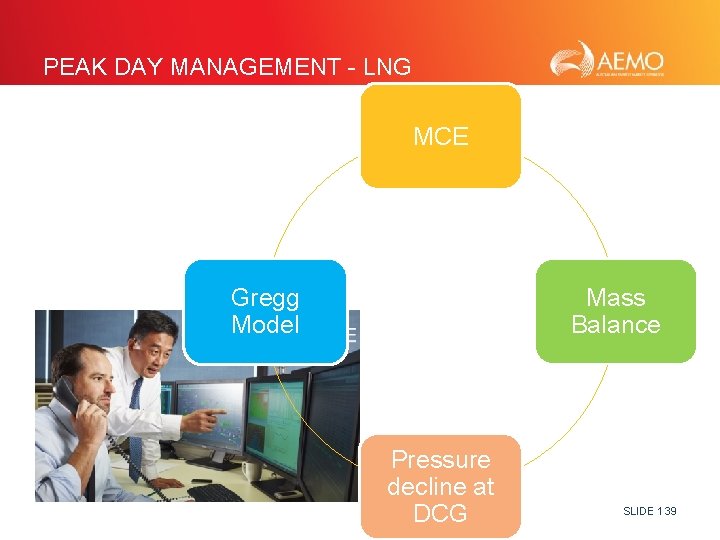
PEAK DAY MANAGEMENT - LNG MCE Gregg Model Mass Balance Pressure decline at DCG SLIDE 139
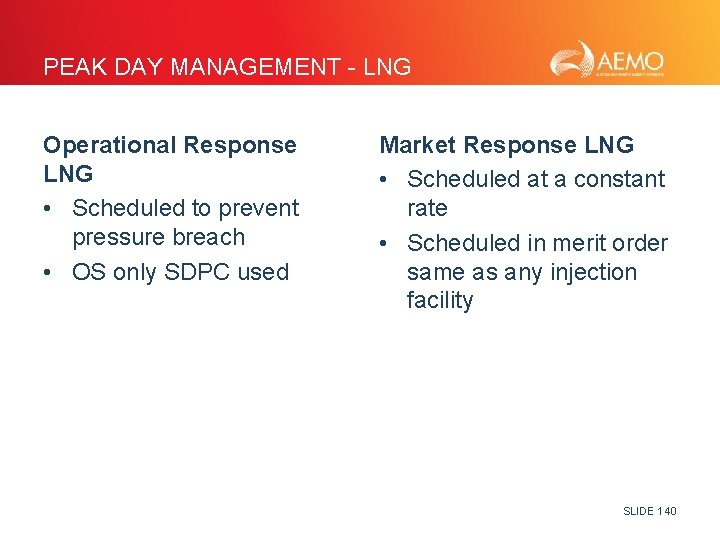
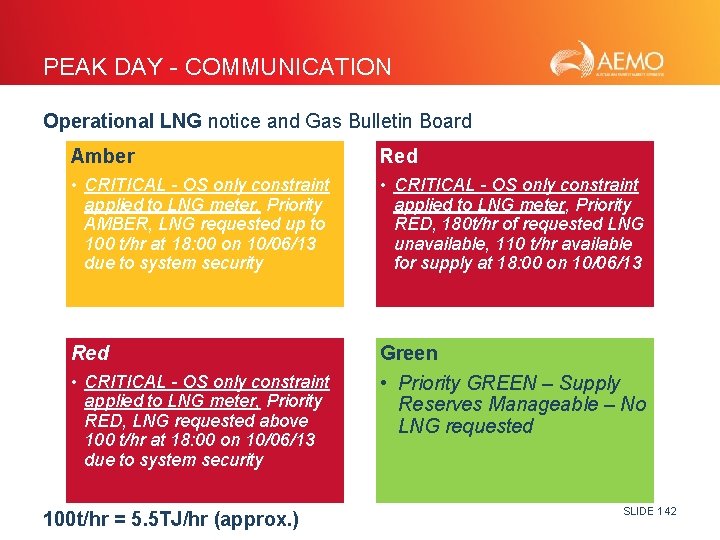
PEAK DAY MANAGEMENT - LNG Operational Response LNG • Scheduled to prevent pressure breach • OS only SDPC used Market Response LNG • Scheduled at a constant rate • Scheduled in merit order same as any injection facility SLIDE 140
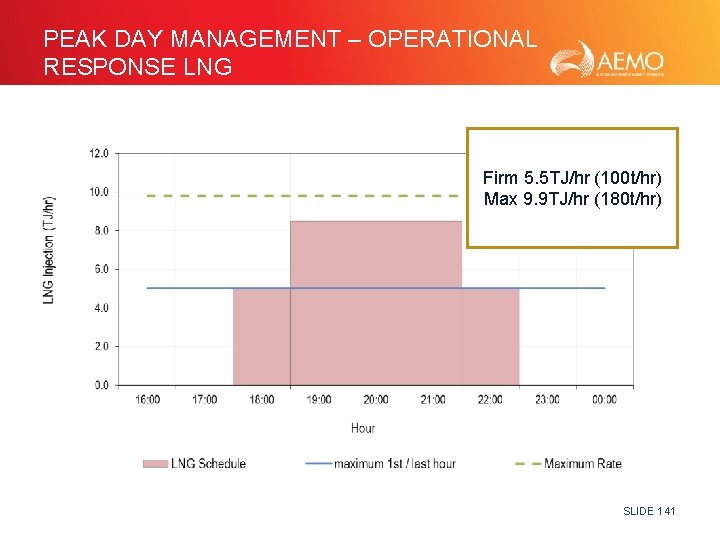
PEAK DAY MANAGEMENT – OPERATIONAL RESPONSE LNG Firm 5. 5 TJ/hr (100 t/hr) Max 9. 9 TJ/hr (180 t/hr) SLIDE 141
PEAK DAY - COMMUNICATION Operational LNG notice and Gas Bulletin Board Amber Red • CRITICAL - OS only constraint applied to LNG meter, Priority AMBER, LNG requested up to 100 t/hr at 18: 00 on 10/06/13 due to system security • CRITICAL - OS only constraint applied to LNG meter, Priority RED, 180 t/hr of requested LNG unavailable, 110 t/hr available for supply at 18: 00 on 10/06/13 Red Green • Priority GREEN – Supply Reserves Manageable – No LNG requested • CRITICAL - OS only constraint applied to LNG meter, Priority RED, LNG requested above 100 t/hr at 18: 00 on 10/06/13 due to system security 100 t/hr = 5. 5 TJ/hr (approx. ) SLIDE 142
CASE STUDY SLIDE
TUESDAY 14 TH JULY 2015 to New South Wales Victorian Northern Interconnect Culcairn Walla Barnawartha Koonoomoo Beginning of Day Line Pack 34 TJ High Market LNG 24 TJ Wodonga Springhurst Glenrowan Shepparton Echuca Euroa Bendigo Carisbrook Wandong 58 TJ to New South Wales Horsham Wollert Somerton Power Station to Tasmania Sunbury Plumpton Ballarat Hamilton 387 TJ Vic Hub Gooding Dandenong Bass Gas Tyers Morwell Lara SWP Iona UGS SEA Gas Geelong South West Laverton North Power Station Newport Power Station Jeeralang Power Station Lang from Bass Strait Fields 805 TJ Longford LNG Iona Otway Mortlake Portland Brooklyn Winchelsea 1153 TJ + 15 TJ Loy Yang B Power Station Leongatha Wonthaggi from Yolla Longford – Melbourne SLIDE 144
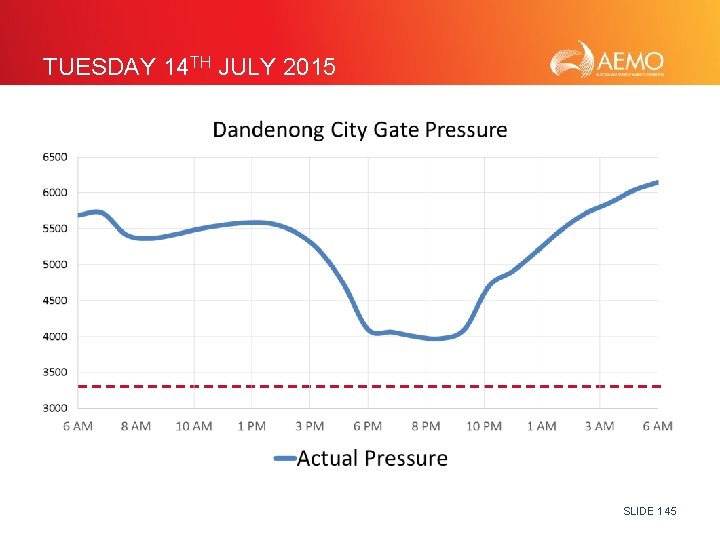
TUESDAY 14 TH JULY 2015 SLIDE 145
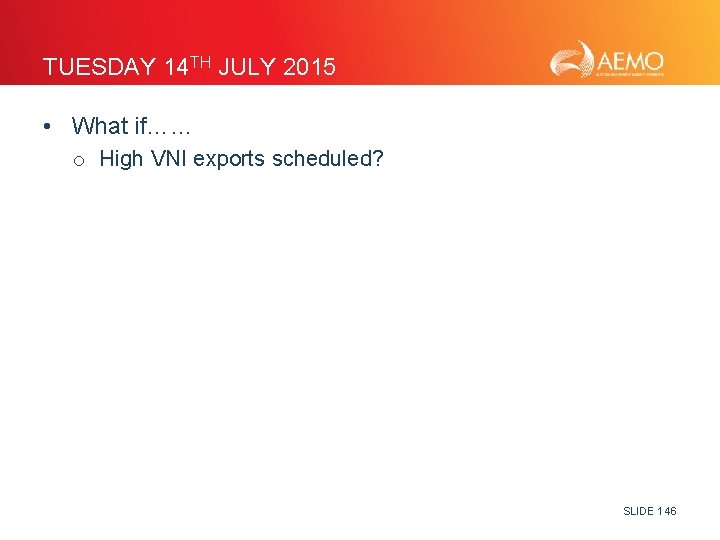
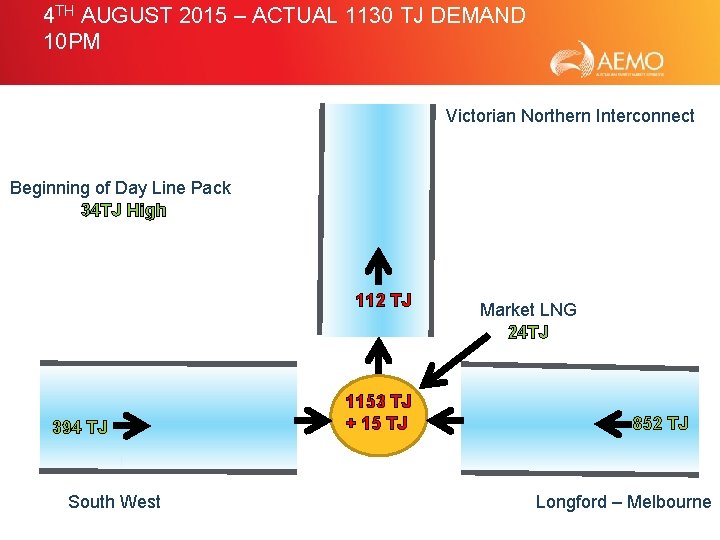
TUESDAY 14 TH JULY 2015 • What if…… o High VNI exports scheduled? SLIDE 146
4 TH AUGUST 2015 – ACTUAL 1130 TJ DEMAND 10 PM Victorian Northern Interconnect Beginning of Day Line Pack 34 TJ High 112 TJ 394 TJ South West 1153 TJ + 15 TJ Market LNG 24 TJ 852 TJ Longford – Melbourne SLIDE 147
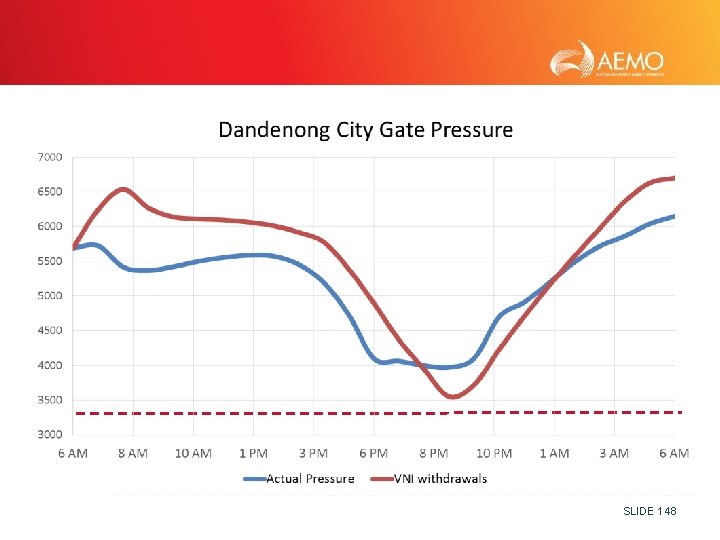
SLIDE 148
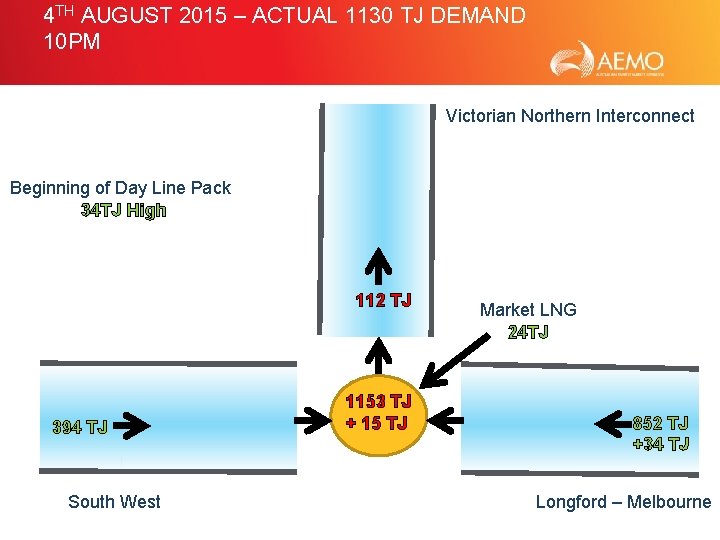
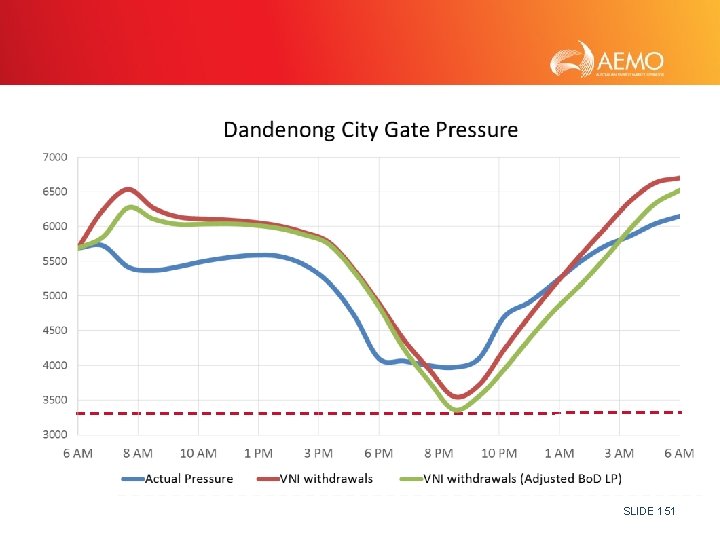
TUESDAY 14 TH JULY 2015 • What if…… o High VNI exports scheduled? o Bo. D Linepack was on target (instead 34 TJ of high)? SLIDE 149
4 TH AUGUST 2015 – ACTUAL 1130 TJ DEMAND 10 PM Victorian Northern Interconnect Beginning of Day Line Pack 34 TJ High 112 TJ 394 TJ South West 1153 TJ + 15 TJ Market LNG 24 TJ 852 TJ +34 TJ Longford – Melbourne SLIDE 150
SLIDE 151
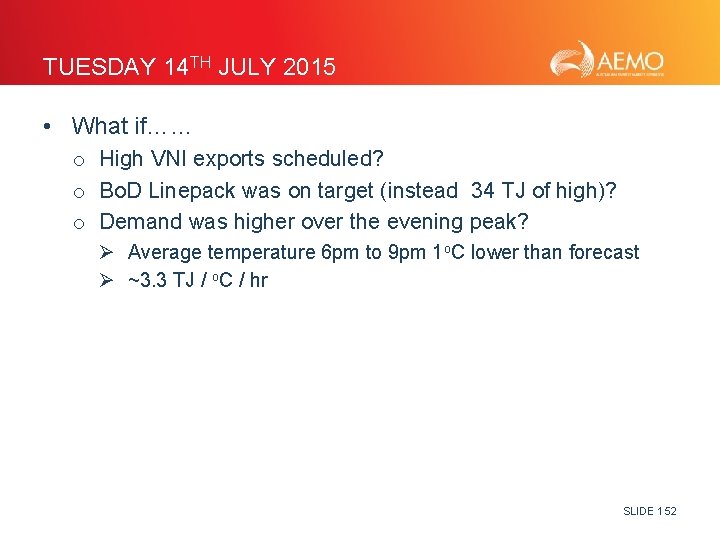
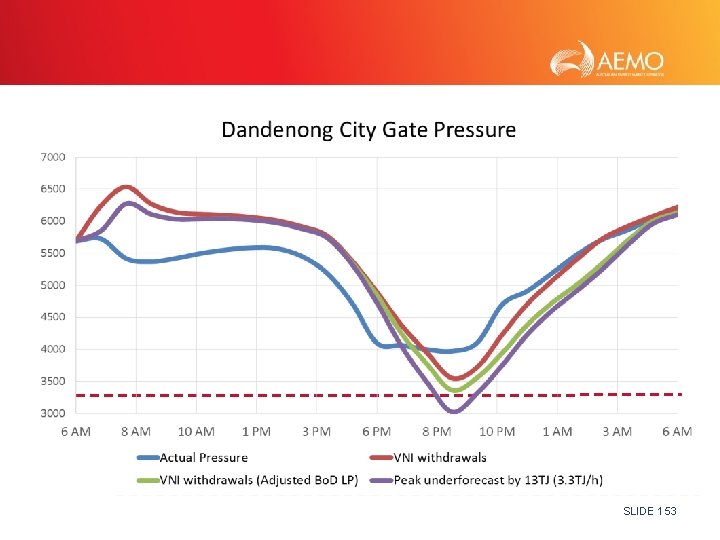
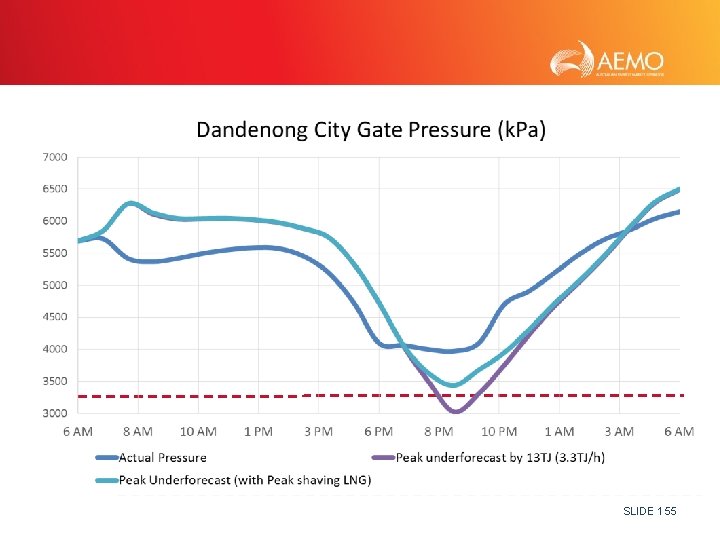
TUESDAY 14 TH JULY 2015 • What if…… o High VNI exports scheduled? o Bo. D Linepack was on target (instead 34 TJ of high)? o Demand was higher over the evening peak? Ø Average temperature 6 pm to 9 pm 1 o. C lower than forecast Ø ~3. 3 TJ / o. C / hr SLIDE 152
SLIDE 153
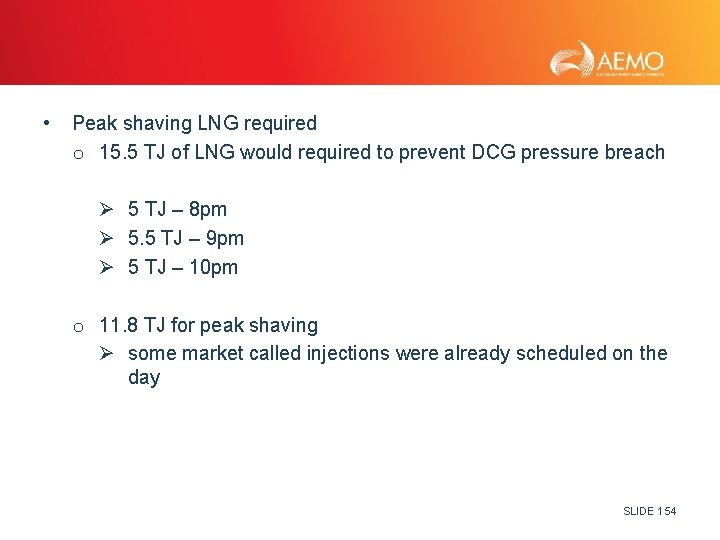
• Peak shaving LNG required o 15. 5 TJ of LNG would required to prevent DCG pressure breach Ø 5 TJ – 8 pm Ø 5. 5 TJ – 9 pm Ø 5 TJ – 10 pm o 11. 8 TJ for peak shaving Ø some market called injections were already scheduled on the day SLIDE 154
SLIDE 155
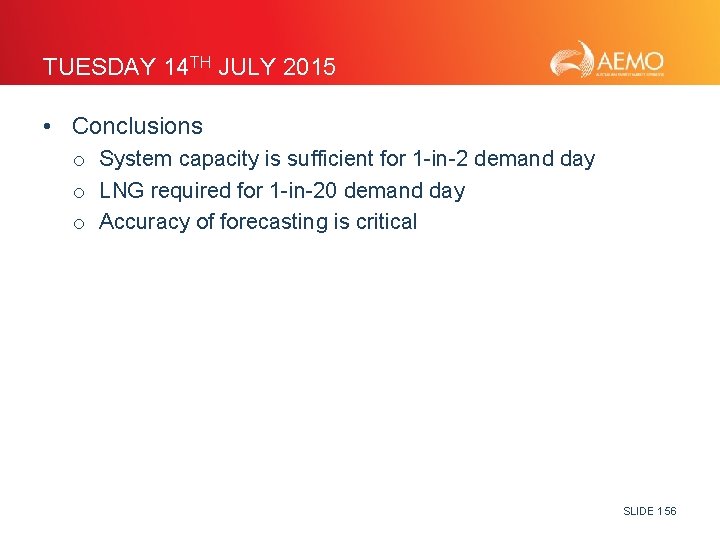
TUESDAY 14 TH JULY 2015 • Conclusions o System capacity is sufficient for 1 -in-2 demand day o LNG required for 1 -in-20 demand day o Accuracy of forecasting is critical SLIDE 156
EMERGENCY MANAGEMENT Presented by Derek Sonogan Gas Operations Engineer, AEMO Gas Real Time Operations SLIDE 157
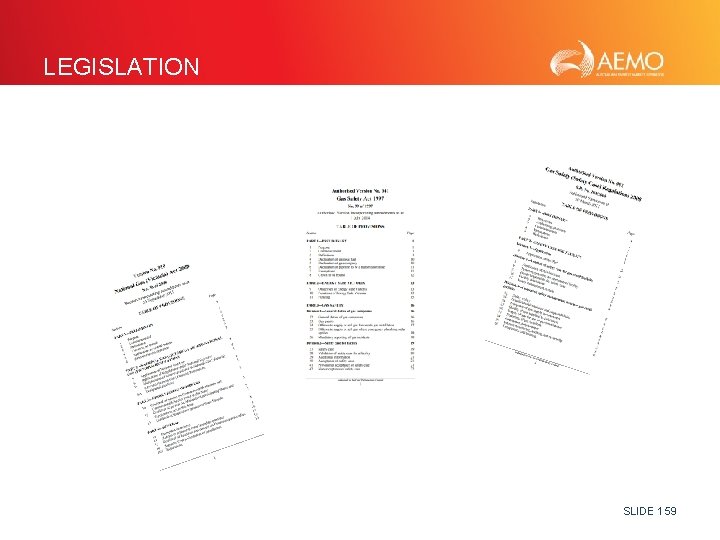
SCOPE • Lets talk about the Act and the Emergency Protocol • What are the different classifications of emergencies? • What emergency structures does AEMO use? • Communicating • Authority to notify • Example SLIDE 158
LEGISLATION SLIDE 159
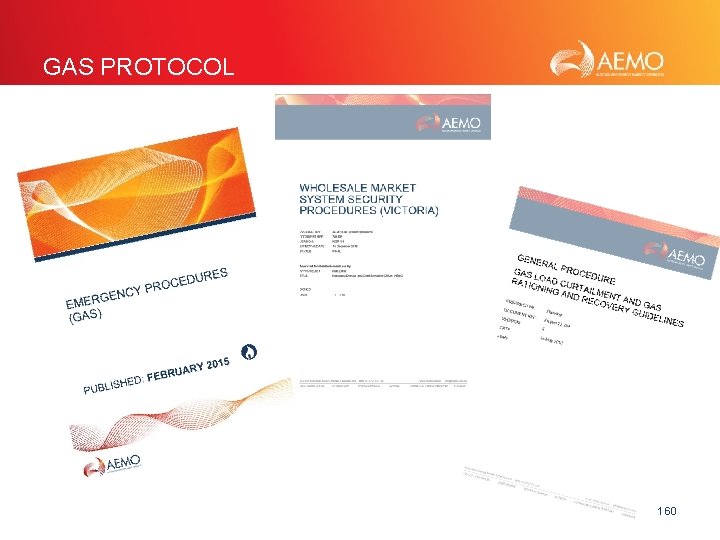
GAS PROTOCOL SLIDE 160
GAS PROTOCOL • So What? AEMO Participants must comply with the Gas protocol SLIDE 161
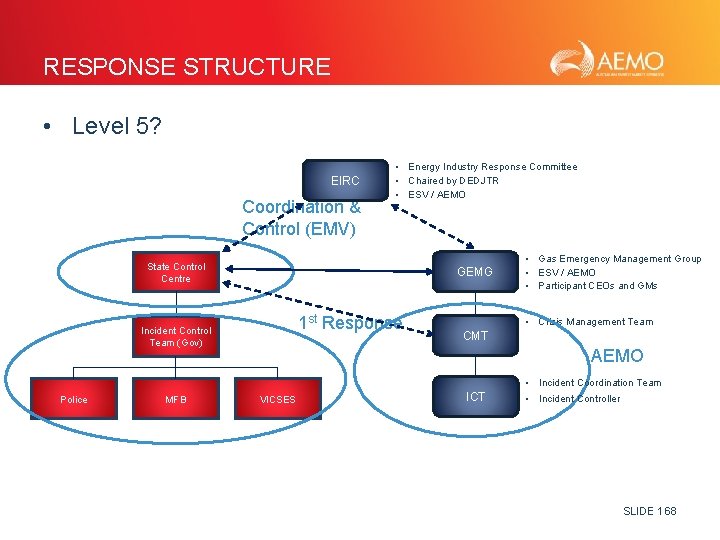
WHAT IS AN EMERGENCY? • A situation that may threaten: o Reliability of gas supply o System security o Public safety • But also o AEMO can declare an emergency o or at the direction of the Government or ESV SLIDE 162
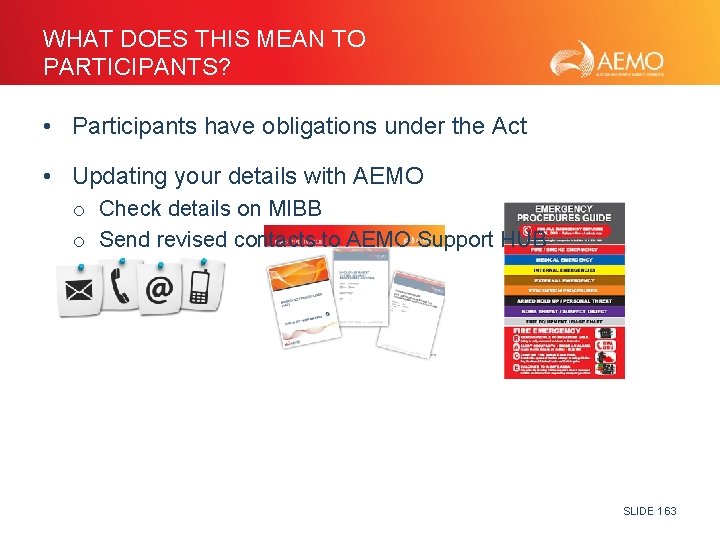
WHAT DOES THIS MEAN TO PARTICIPANTS? • Participants have obligations under the Act • Updating your details with AEMO o Check details on MIBB o Send revised contacts to AEMO Support HUB SLIDE 163
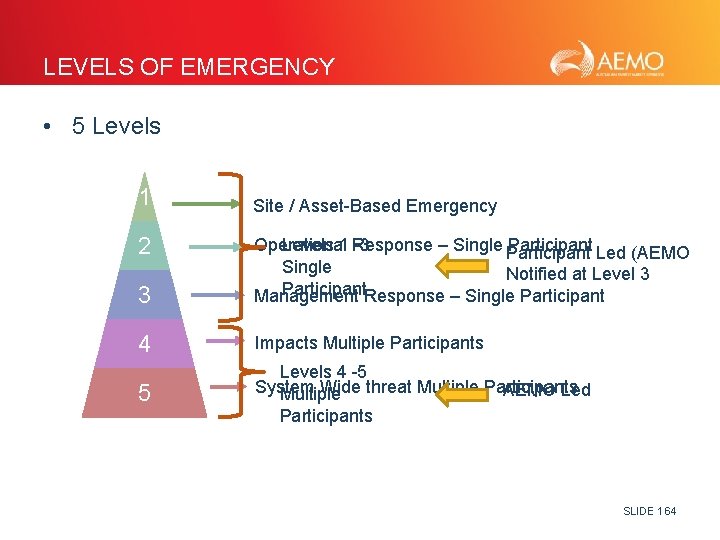
LEVELS OF EMERGENCY • 5 Levels 1 2 Site / Asset-Based Emergency 3 Levels 1 -3 Operational Response – Single Participant Led (AEMO Single Notified at Level 3 Participant Management Response – Single Participant 4 Impacts Multiple Participants 5 Levels 4 -5 System Wide threat Multiple Participants AEMO Led Multiple Participants SLIDE 164
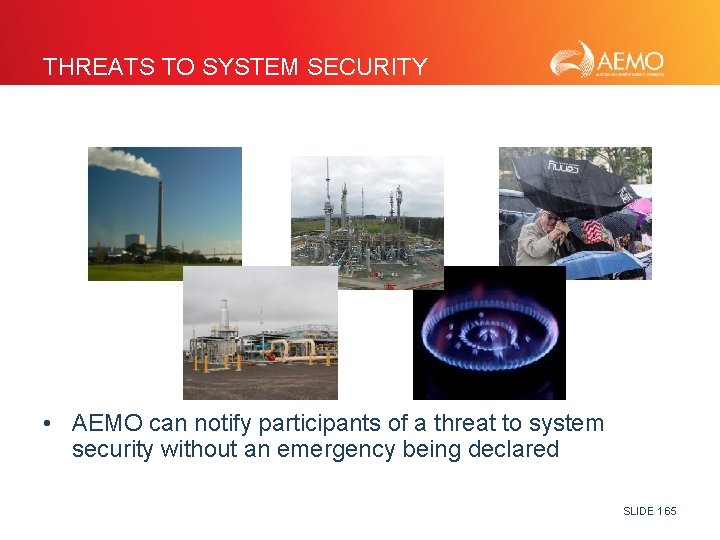
THREATS TO SYSTEM SECURITY • AEMO can notify participants of a threat to system security without an emergency being declared SLIDE 165
MANAGEMENT STRUCTURES • Government o Security and Emergency Management Cabinet Committee o Emergency Management Victoria • Preparedness o Gas Emergency Management Consultative Forum • Response o National Gas Emergency Response Advisory Committee o Energy Industry Response Committee o Gas Emergency Management Group SLIDE 166
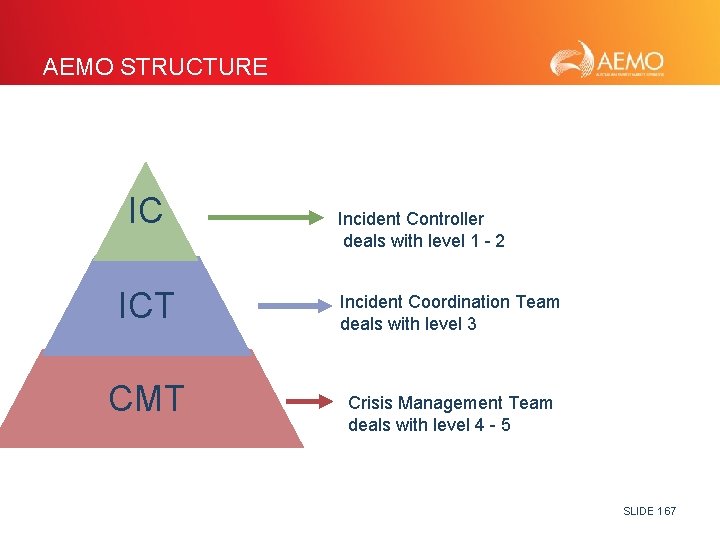
AEMO STRUCTURE IC ICT CMT Incident Controller deals with level 1 - 2 Incident Coordination Team deals with level 3 Crisis Management Team deals with level 4 - 5 SLIDE 167
RESPONSE STRUCTURE • Level 5? EIRC Coordination & Control (EMV) • Energy Industry Response Committee • Chaired by DEDJTR • ESV / AEMO State Control Centre GEMG 1 st Response Incident Control Team (Gov) • Gas Emergency Management Group • ESV / AEMO • Participant CEOs and GMs • Crisis Management Team CMT AEMO • Incident Coordination Team Police MFB VICSES ICT • Incident Controller SLIDE 168
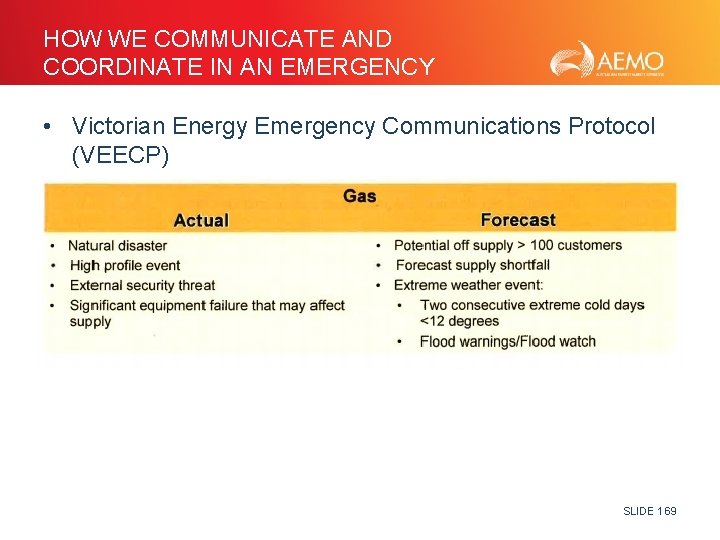
HOW WE COMMUNICATE AND COORDINATE IN AN EMERGENCY • Victorian Energy Emergency Communications Protocol (VEECP) SLIDE 169
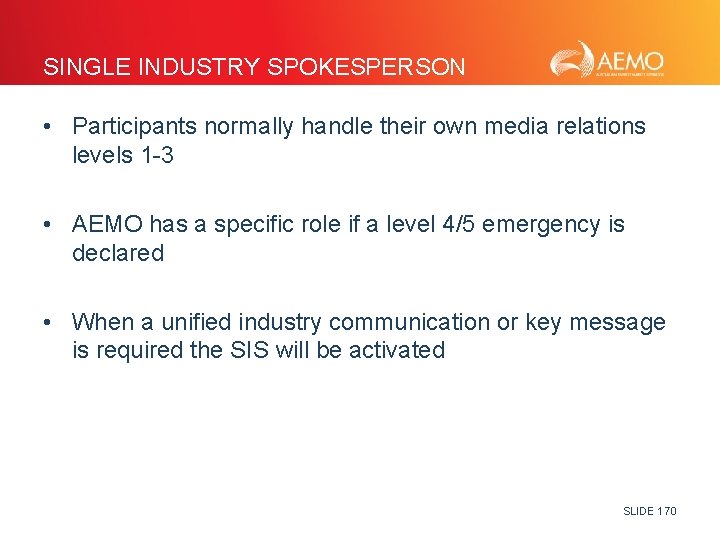
SINGLE INDUSTRY SPOKESPERSON • Participants normally handle their own media relations levels 1 -3 • AEMO has a specific role if a level 4/5 emergency is declared • When a unified industry communication or key message is required the SIS will be activated SLIDE 170
AUTHORITY TO DECLARE EMERGENCIES • • • Chief Executive Officer Chief Operating Officer Gas Duty Manager • Director of energy Safety, ESV may issue a direction Under the Gas Safety Act 1997 • Governor in Council may declare under the Gas Industry Act 2001 on advice from EIRC SLIDE 171
EXAMPLE SLIDE 172
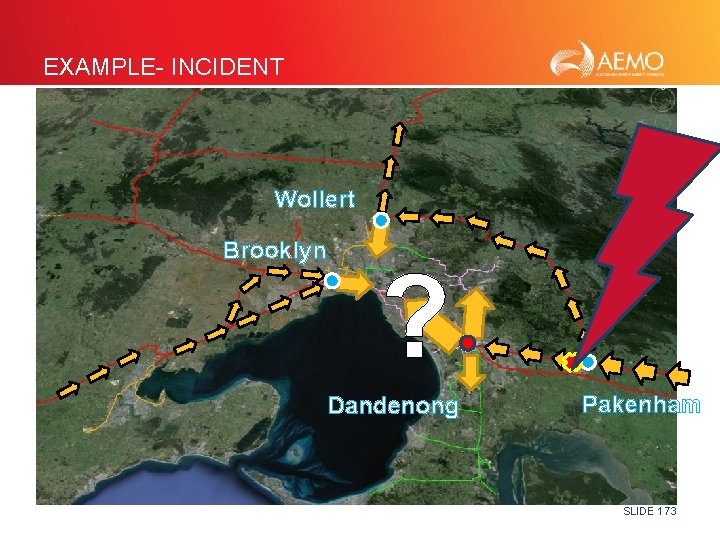
EXAMPLE- INCIDENT Wollert Brooklyn ? Dandenong Pakenham SLIDE 173
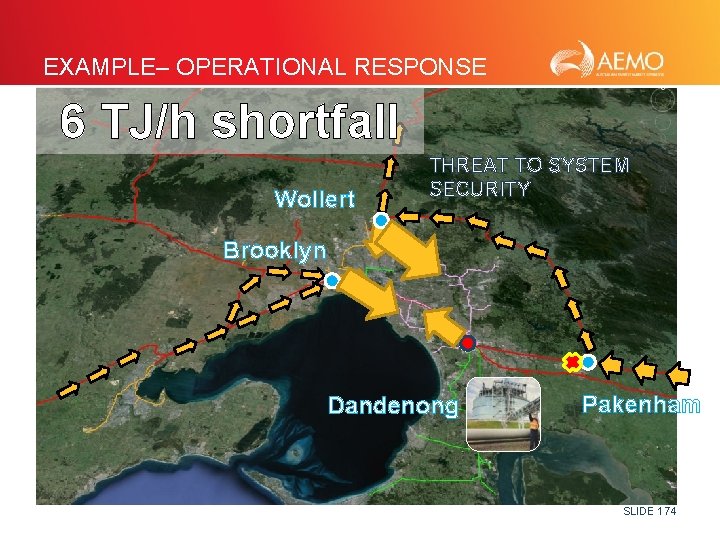
EXAMPLE– OPERATIONAL RESPONSE 6 TJ/h shortfall Wollert THREAT TO SYSTEM SECURITY Brooklyn Dandenong Pakenham SLIDE 174
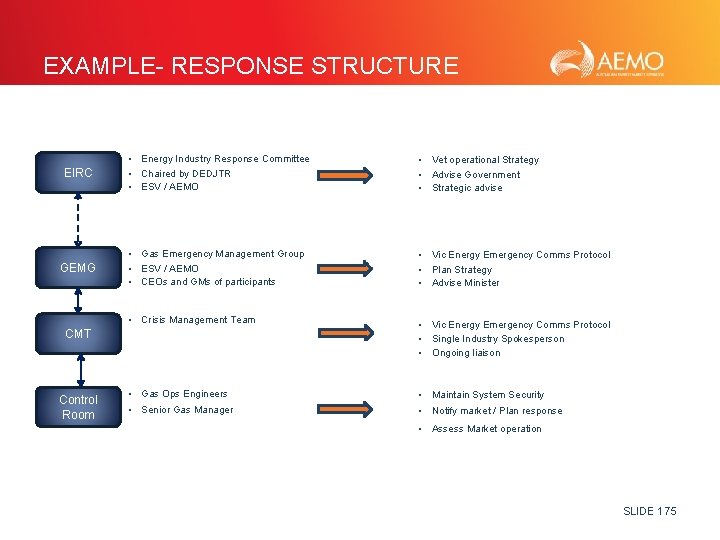
EXAMPLE- RESPONSE STRUCTURE EIRC • Energy Industry Response Committee • Chaired by DEDJTR • ESV / AEMO • Vet operational Strategy • Advise Government • Strategic advise GEMG • Gas Emergency Management Group • ESV / AEMO • CEOs and GMs of participants • Vic Energy Emergency Comms Protocol • Plan Strategy • Advise Minister • Crisis Management Team • Vic Energy Emergency Comms Protocol • Single Industry Spokesperson • Ongoing liaison • Gas Ops Engineers • Maintain System Security • Senior Gas Manager • Notify market / Plan response CMT Control Room • Assess Market operation SLIDE 175
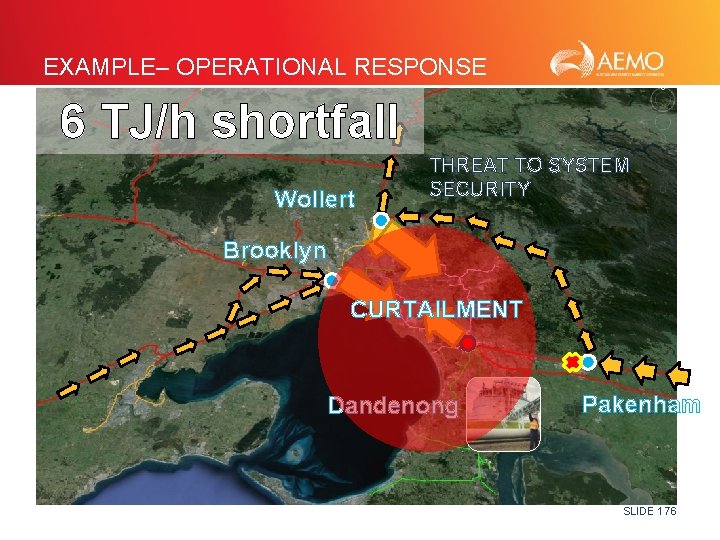
EXAMPLE– OPERATIONAL RESPONSE 6 TJ/h shortfall Wollert THREAT TO SYSTEM SECURITY Brooklyn CURTAILMENT Dandenong Pakenham SLIDE 176
IN SUMMARY • Threat to system security declared o Response from AEMO o Market intervention • Level 5 emergency • CMT formed • Communications protocols enacted • Market continues operating unless situation changes SLIDE 177
Q&A SLIDE 178
ANNOUNCEMENT • • • 2016 Gas Statement of Opportunities: http: //www. aemo. com. au/Gas/Planning/Gas-Statement-of. Opportunities 2016 Victorian Gas Planning Report Update: http: //www. aemo. com. au/Gas/Planning/Victorian-Gas-Planning 2015 National Gas Forecasting Report: http: //www. aemo. com. au/Gas/Planning/Forecasting SLIDE 179
AEMO ADDITIONAL RESOURCES • • • DWGM procedures: http: //www. aemo. com. au/Gas/Policies-and. Procedures/Declared-Wholesale-Gas-Market-Rules-and-Procedures STTM Contingency Gas: http: //www. aemo. com. au/Gas/Policies-and -Procedures/Short-Term-Trading-Markets/Contingency-Gas market guides (tech guides and overview): http: //www. aemo. com. au/About-the-Industry/Resources/Market. Overviews SLIDE 180
NETWORKING SLIDE 181