
IEA low carbon transport analysis Global EV Outlook
IEA low carbon transport analysis Global EV Outlook 2017 Pierpaolo Cazzola IEA Asia Pacific Economic Cooperation - Energy Working Group 54 Electric Vehicle and Hydrogen Technology Policy Workshop Wellington, 21 November 2017 © OECD/IEA 2017
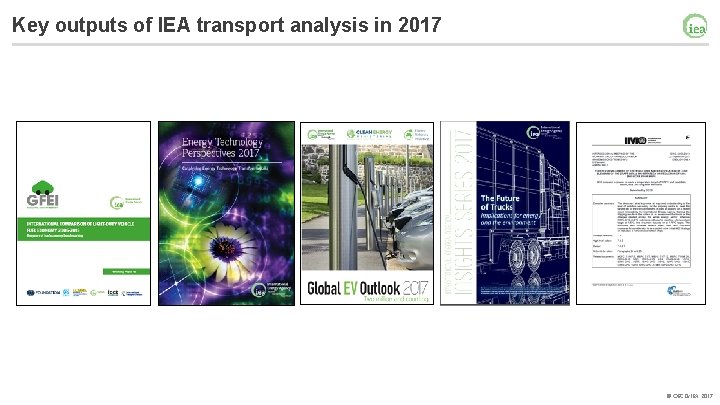
Key outputs of IEA transport analysis in 2017 © OECD/IEA 2017
ETP 2017: analysis of energy system decarbonisation (B 2 DS) Key findings on transport Transport accounts for 28% of global final energy demand 23% of global carbon dioxide (CO 2) emissions from fuel combustion. In 2014, the transport sector consumed 65% of global oil final energy demand. Decarbonising the sector requires: • changing the nature and the structure of transport demand, • major improvements in efficiency, • and rapid transitions in the energy mix used to move people and goods. Decarbonising long‐distance transport modes – in particular aviation, heavy‐duty road transport (i. e. trucking and buses) and shipping – is most challenging © OECD/IEA 2017
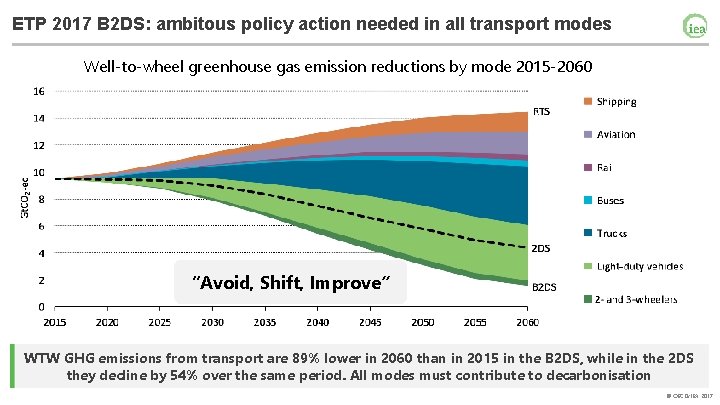
ETP 2017 B 2 DS: ambitous policy action needed in all transport modes Well‐to‐wheel greenhouse gas emission reductions by mode 2015‐ 2060 “Avoid, Shift, Improve” WTW GHG emissions from transport are 89% lower in 2060 than in 2015 in the B 2 DS, while in the 2 DS they decline by 54% over the same period. All modes must contribute to decarbonisation © OECD/IEA 2017
Electric Vehicles Initiative (EVI) • Government‐to‐government forum comprising 13 economies ‐ Canada, China, Finland, France, Germany, India, Japan, Sweden, Mexico, the Netherlands, Norway, the UK and the US • Currently co‐chaired by Canada and China, and coordinated by the IEA • Released several analytical publications (Global EV Outlook, City casebook) • Engaged stakeholders in high‐level roundtables (CEM 8 and Pilot City Forum in Beijing, June 2017) • Instrumental to mobilize action and commitments (Paris Declaration on Electro‐Mobility and Climate Change at COP 21, Government Fleet Declaration at COP 22) Ø Just launched the EV 30@30 Campaign (aim for a 30% market share for EVs by 2030) © OECD/IEA 2017
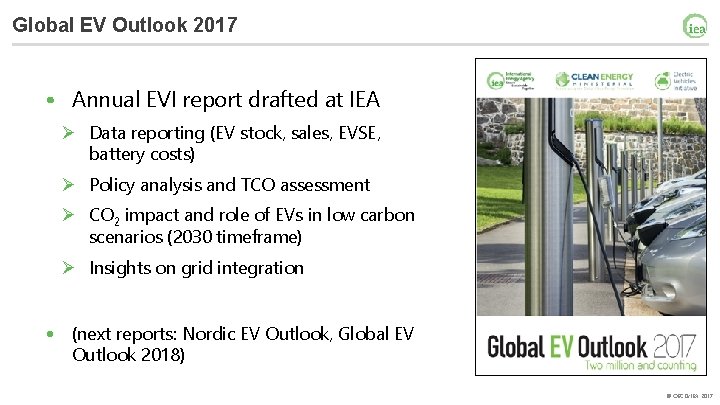
Global EV Outlook 2017 • Annual EVI report drafted at IEA Ø Data reporting (EV stock, sales, EVSE, battery costs) Ø Policy analysis and TCO assessment Ø CO 2 impact and role of EVs in low carbon scenarios (2030 timeframe) Ø Insights on grid integration • (next reports: Nordic EV Outlook, Global EV Outlook 2018) © OECD/IEA 2017
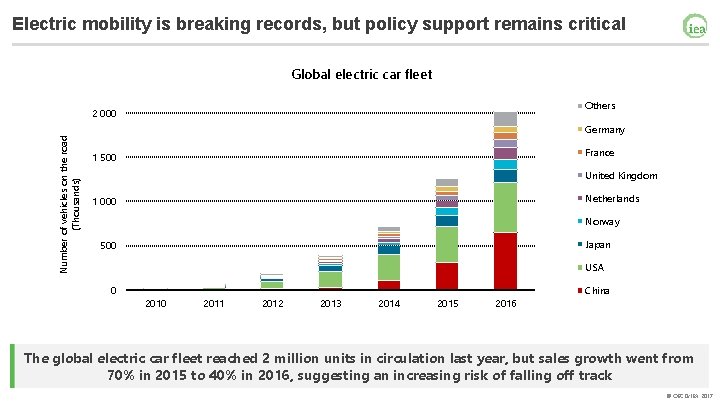
Electric mobility is breaking records, but policy support remains critical Global electric car fleet Others Number of vehicles on the road (Thousands) 2 000 Germany France 1 500 United Kingdom Netherlands 1 000 Norway Japan 500 USA 0 2011 2012 2013 2014 2015 2016 China The global electric car fleet reached 2 million units in circulation last year, but sales growth went from 70% in 2015 to 40% in 2016, suggesting an increasing risk of falling off track © OECD/IEA 2017
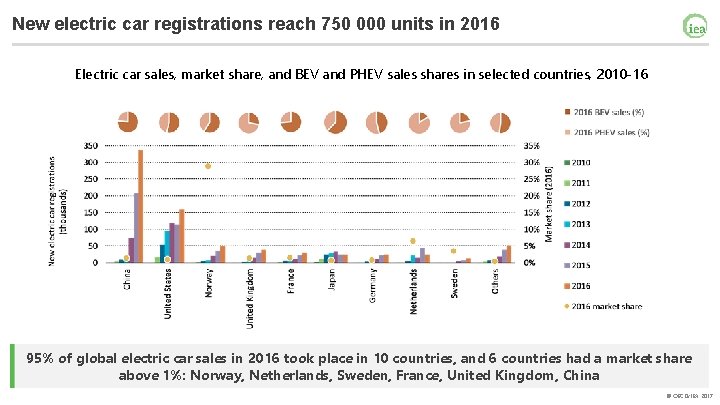
New electric car registrations reach 750 000 units in 2016 Electric car sales, market share, and BEV and PHEV sales shares in selected countries, 2010‐ 16 95% of global electric car sales in 2016 took place in 10 countries, and 6 countries had a market share above 1%: Norway, Netherlands, Sweden, France, United Kingdom, China © OECD/IEA 2017
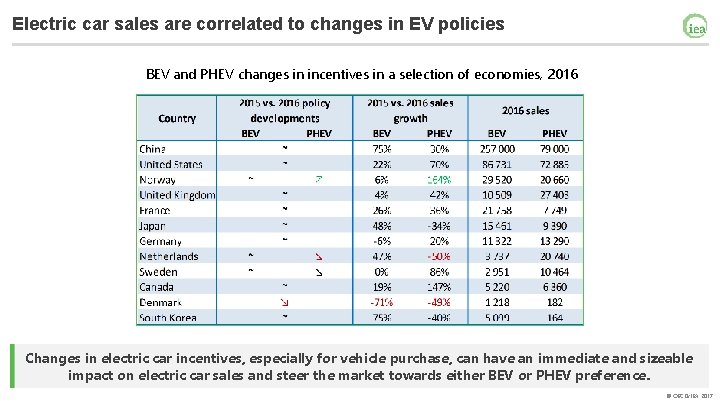
Electric car sales are correlated to changes in EV policies BEV and PHEV changes in incentives in a selection of economies, 2016 Changes in electric car incentives, especially for vehicle purchase, can have an immediate and sizeable impact on electric car sales and steer the market towards either BEV or PHEV preference. © OECD/IEA 2017
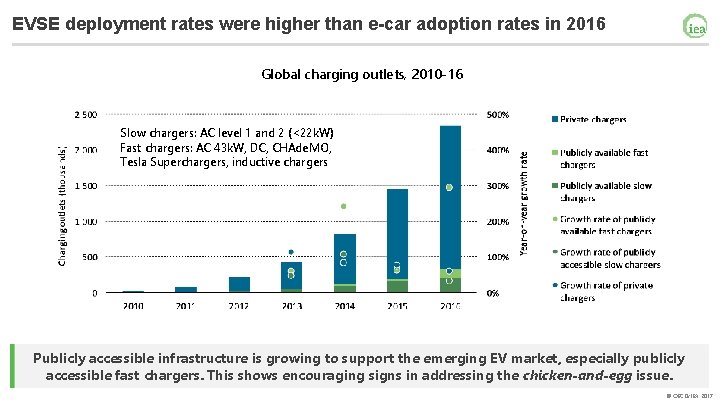
EVSE deployment rates were higher than e-car adoption rates in 2016 Global charging outlets, 2010‐ 16 Slow chargers: AC level 1 and 2 (<22 k. W) Fast chargers: AC 43 k. W, DC, CHAde. MO, Tesla Superchargers, inductive chargers Publicly accessible infrastructure is growing to support the emerging EV market, especially publicly accessible fast chargers. This shows encouraging signs in addressing the chicken-and-egg issue. © OECD/IEA 2017
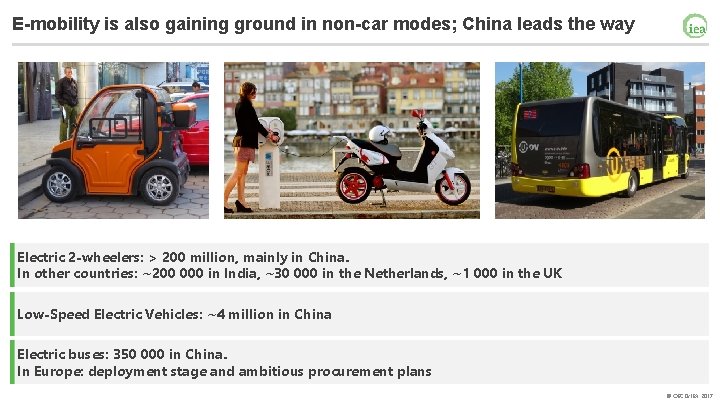
E-mobility is also gaining ground in non-car modes; China leads the way Electric 2 -wheelers: > 200 million, mainly in China. In other countries: ~200 000 in India, ~30 000 in the Netherlands, ~1 000 in the UK Low-Speed Electric Vehicles: ~4 million in China Electric buses: 350 000 in China. In Europe: deployment stage and ambitious procurement plans © OECD/IEA 2017
Battery costs and range as key factors for the success of e-mobility Evolution of battery energy density and cost, 2009‐ 16, and future prospects Battery costs and energy density progresses are expected to keep delivering positive outcomes. This will further help lowering adoption barriers. © OECD/IEA 2017
Cost-competitiveness prospects and policy needs Comparative cost of passenger car technologies by economy/region in the 2 DS, 2015 and 2030 Achieving cost-competitiveness over the next decade will require policy instruments to allow market scale-up, reflect the cost of externalities of ICEs, and encourage synergies with new mobility models. © OECD/IEA 2017
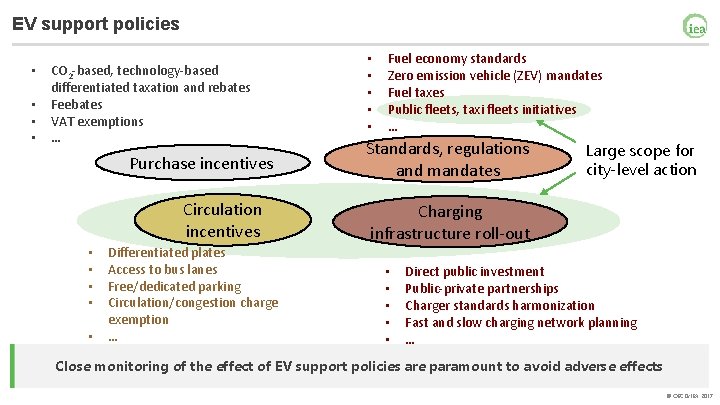
EV support policies • • CO 2 -based, technology-based differentiated taxation and rebates Feebates VAT exemptions … Purchase incentives Circulation incentives • • • Differentiated plates Access to bus lanes Free/dedicated parking Circulation/congestion charge exemption … • • • Fuel economy standards Zero emission vehicle (ZEV) mandates Fuel taxes Public fleets, taxi fleets initiatives … Standards, regulations and mandates Large scope for city‐level action Charging infrastructure roll-out • • • Direct public investment Public-private partnerships Charger standards harmonization Fast and slow charging network planning … Close monitoring of the effect of EV support policies are paramount to avoid adverse effects © OECD/IEA 2017
EVs benefit the environment and are essential to CO 2 emissions reduction On‐road WTW CO 2 emissions for various technologies by country/region, RTS and 2 DS, 2015 to 2030 2015 2030 RTS 2030 2 DS If coupled to low-carbon power, the high energy efficiency of EVs offers prospects for substantial CO 2 emissions reductions. This complements their air quality, energy security and noise reduction benefits. © OECD/IEA 2017
Grid integration and synergies with variable renewables Local demand profile and EV charging in the EU on a typical day, B 2 DS, 2030 Flexible charging will ensure minimal investment needs in grid reinforcements and optimized load synchronization with high shares of variable renewables. © OECD/IEA 2017
Impacts on the grid? (slow vs. fast charging) Slow charging: § Potential for flexibility through variable charging: requires price signal, demand-side management tools, but not necessarily “vehicle-to-grid” operations. § Synergies with the integration of variable renewables Fast charging: § Potentially disruptive locally for distribution grids § Does not offer flexibility § Business model? § However, fast charging is not likely to take place in the evening demand peak (home chargers are slow chargers) The availability of slow and fast chargers must make EV charging easy and convenient to customers, but this deployment must be made in the most cost-effective way possible. © OECD/IEA 2017
Prospect for EV uptake in different scenarios Global electric car fleet EVs will be needed to meet sustainability goals, as suggested by the EV 30@30 campaign target. Early action, active government support and industry commitment are essential. © OECD/IEA 2017
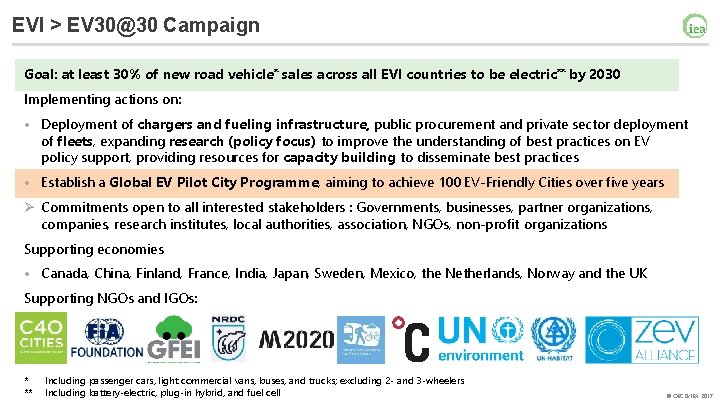
EVI > EV 30@30 Campaign Goal: at least 30% of new road vehicle* sales across all EVI countries to be electric** by 2030 Implementing actions on: • Deployment of chargers and fueling infrastructure, public procurement and private sector deployment of fleets, expanding research (policy focus) to improve the understanding of best practices on EV policy support, providing resources for capacity building to disseminate best practices • Establish a Global EV Pilot City Programme, aiming to achieve 100 EV‐Friendly Cities over five years Ø Commitments open to all interested stakeholders : Governments, businesses, partner organizations, companies, research institutes, local authorities, association, NGOs, non‐profit organizations Supporting economies • Canada, China, Finland, France, India, Japan, Sweden, Mexico, the Netherlands, Norway and the UK Supporting NGOs and IGOs: * ** Including passenger cars, light commercial vans, buses, and trucks; excluding 2‐ and 3‐wheelers Including battery‐electric, plug‐in hybrid, and fuel cell © OECD/IEA 2017
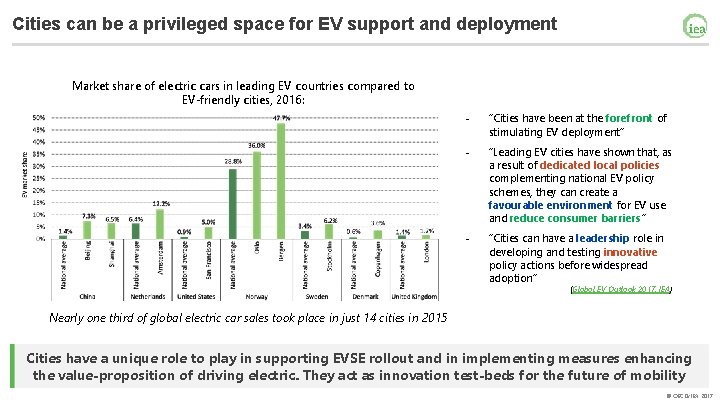
Cities can be a privileged space for EV support and deployment Market share of electric cars in leading EV countries compared to EV‐friendly cities, 2016: ‐ “Cities have been at the forefront of stimulating EV deployment” ‐ “Leading EV cities have shown that, as a result of dedicated local policies complementing national EV policy schemes, they can create a favourable environment for EV use and reduce consumer barriers” ‐ “Cities can have a leadership role in developing and testing innovative policy actions before widespread adoption” (Global EV Outlook 2017, IEA) Nearly one third of global electric car sales took place in just 14 cities in 2015 Cities have a unique role to play in supporting EVSE rollout and in implementing measures enhancing the value-proposition of driving electric. They act as innovation test-beds for the future of mobility © OECD/IEA 2017
EVI > EV 30@30 > Global EV Pilot City Programme (PCP) • Goal: Achieve 100 EV-Friendly Cities over five years • Support greater dialogue with and provide support to municipal governments ‐ Topics: urban planning, infrastructure and charging technology, mass transit (including electric buses) and mobility as a service (including car and ride sharing) • Identify good practices and facilitate their replication and improvement • Engage in the organization of the Pilot City Forum Amsterdam Beijing London Ø Los Angeles Oslo Shanghai Exchange event allowing to facilitate networking and communication across interested stakeholders, to be held alternatively in China in odd years and in another country in even years • Monitor and report progress : data and information sharing among PCP members © OECD/IEA 2017
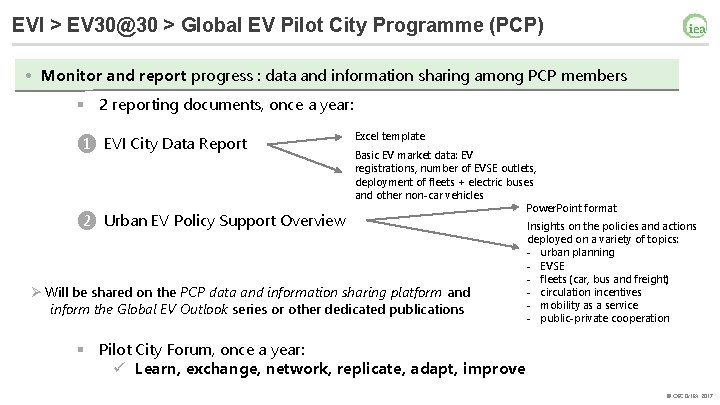
EVI > EV 30@30 > Global EV Pilot City Programme (PCP) • Monitor and report progress : data and information sharing among PCP members § 2 reporting documents, once a year: ❶ EVI City Data Report ❷ Urban EV Policy Support Overview Excel template Basic EV market data: EV registrations, number of EVSE outlets, deployment of fleets + electric buses and other non‐car vehicles Power. Point format Ø Will be shared on the PCP data and information sharing platform and inform the Global EV Outlook series or other dedicated publications Insights on the policies and actions deployed on a variety of topics: ‐ urban planning ‐ EVSE ‐ fleets (car, bus and freight) ‐ circulation incentives ‐ mobility as a service ‐ public‐private cooperation § Pilot City Forum, once a year: ü Learn, exchange, network, replicate, adapt, improve © OECD/IEA 2017
Global EV Pilot City Programme (PCP): logos, timing and practical details PCP logo, PCP city label Ø Planned launch at CEM 9, Copenhagen‐Malmö, May 2018 Ø PCP concept document finalized and shared with EVI members and cities Ø Collection of letters of intent to join has started. Expression of interest from several “EV capitals” Ø Pilot City Forum to happen back to back with CEM 9, in Helsinki © OECD/IEA 2017

© OECD/IEA 2017
- Slides: 24