
Melbourne as a Global Cultural Destination Final Report
Melbourne as a Global Cultural Destination Final Report (Summary)
Note to reader The Melbourne as a Global Cultural Destination project focused on Melbourne, and areas within 5 km of the CBD Across the project timeframe, BCG engaged with ~60 key Art Agencies CEOs/Board members and Thought Leaders across the sector, as well as running a series of idea generation workshops with Creative Victoria On the basis of project findings, five strategic priorities have been recommended with an initial view of the actions within each priority, particularly with regards to improving the cultural offer The following was agreed as outside the scope of this piece of work • Consideration of the regional creative and cultural offer • Analysis / or advice on initiatives which would be funded or managed by other parts of Government (e. g. affordable housing) • Detailed assessments of any of the individual investment proposals 2
Agenda Executive Summary Context Performance Index Assessing Melbourne against best practice Cultural travellers and trends Strategic priorities Next steps 3
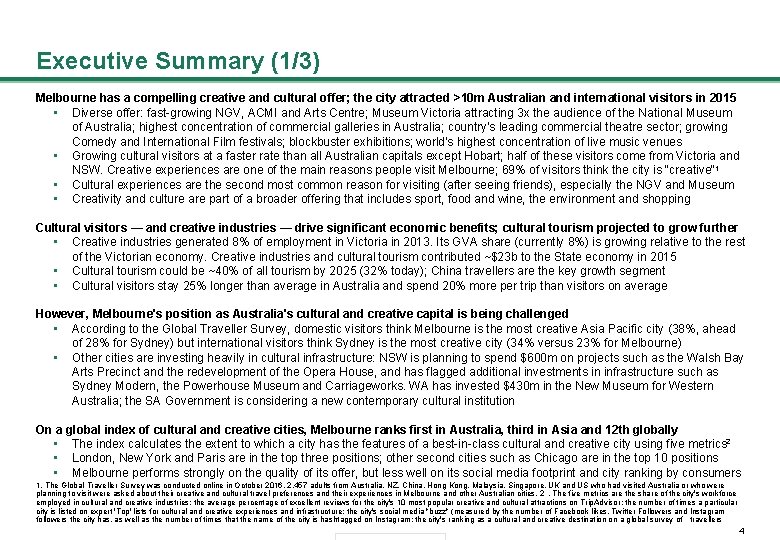
Executive Summary (1/3) Melbourne has a compelling creative and cultural offer; the city attracted >10 m Australian and international visitors in 2015 • Diverse offer: fast-growing NGV, ACMI and Arts Centre; Museum Victoria attracting 3 x the audience of the National Museum of Australia; highest concentration of commercial galleries in Australia; country's leading commercial theatre sector; growing Comedy and International Film festivals; blockbuster exhibitions; world's highest concentration of live music venues • Growing cultural visitors at a faster rate than all Australian capitals except Hobart; half of these visitors come from Victoria and NSW. Creative experiences are one of the main reasons people visit Melbourne; 69% of visitors think the city is "creative"1 • Cultural experiences are the second most common reason for visiting (after seeing friends), especially the NGV and Museum • Creativity and culture are part of a broader offering that includes sport, food and wine, the environment and shopping Cultural visitors — and creative industries — drive significant economic benefits; cultural tourism projected to grow further • Creative industries generated 8% of employment in Victoria in 2013. Its GVA share (currently 8%) is growing relative to the rest of the Victorian economy. Creative industries and cultural tourism contributed ~$23 b to the State economy in 2015 • Cultural tourism could be ~40% of all tourism by 2025 (32% today); China travellers are the key growth segment • Cultural visitors stay 25% longer than average in Australia and spend 20% more per trip than visitors on average However, Melbourne's position as Australia's cultural and creative capital is being challenged • According to the Global Traveller Survey, domestic visitors think Melbourne is the most creative Asia Pacific city (38%, ahead of 28% for Sydney) but international visitors think Sydney is the most creative city (34% versus 23% for Melbourne) • Other cities are investing heavily in cultural infrastructure: NSW is planning to spend $600 m on projects such as the Walsh Bay Arts Precinct and the redevelopment of the Opera House, and has flagged additional investments in infrastructure such as Sydney Modern, the Powerhouse Museum and Carriageworks. WA has invested $430 m in the New Museum for Western Australia; the SA Government is considering a new contemporary cultural institution On a global index of cultural and creative cities, Melbourne ranks first in Australia, third in Asia and 12 th globally • The index calculates the extent to which a city has the features of a best-in-class cultural and creative city using five metrics 2 • London, New York and Paris are in the top three positions; other second cities such as Chicago are in the top 10 positions • Melbourne performs strongly on the quality of its offer, but less well on its social media footprint and city ranking by consumers 1. The Global Traveller Survey was conducted online in October 2016. 2, 457 adults from Australia, NZ, China, Hong Kong, Malaysia, Singapore, UK and US who had visited Australia or who were planning to visit were asked about their creative and cultural travel preferences and their experiences in Melbourne and other Australian cities. 2. The five metrics are the share of the city's workforce employed in cultural and creative industries; the average percentage of excellent reviews for the city's 10 most popular creative and cultural attractions on Trip. Advisor; the number of times a particular city is listed on expert 'Top' lists for cultural and creative experiences and infrastructure; the city's social media "buzz" (measured by the number of Facebook likes, Twitter Followers and Instagram followers the city has, as well as the number of times that the name of the city is hashtagged on Instagram; the city's ranking as a cultural and creative destination on a global survey of travellers 4
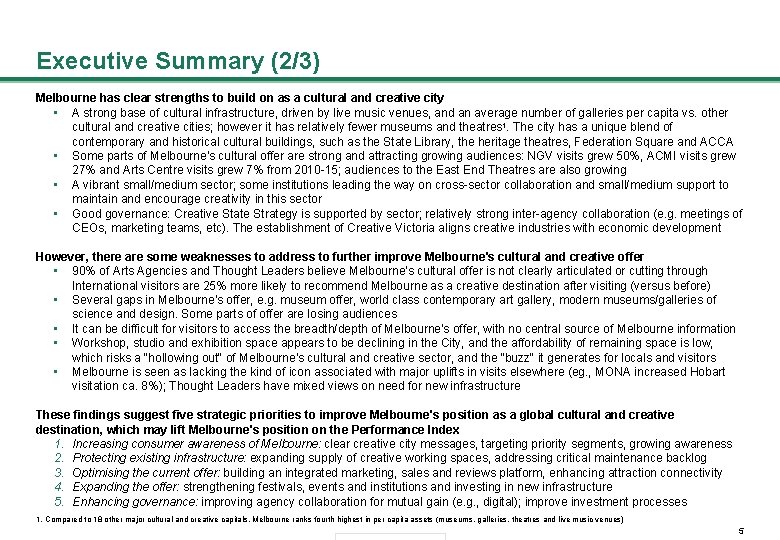
Executive Summary (2/3) Melbourne has clear strengths to build on as a cultural and creative city • A strong base of cultural infrastructure, driven by live music venues, and an average number of galleries per capita vs. other cultural and creative cities; however it has relatively fewer museums and theatres 1. The city has a unique blend of contemporary and historical cultural buildings, such as the State Library, the heritage theatres, Federation Square and ACCA • Some parts of Melbourne's cultural offer are strong and attracting growing audiences: NGV visits grew 50%, ACMI visits grew 27% and Arts Centre visits grew 7% from 2010 -15; audiences to the East End Theatres are also growing • A vibrant small/medium sector; some institutions leading the way on cross-sector collaboration and small/medium support to maintain and encourage creativity in this sector • Good governance: Creative State Strategy is supported by sector; relatively strong inter-agency collaboration (e. g. meetings of CEOs, marketing teams, etc). The establishment of Creative Victoria aligns creative industries with economic development However, there are some weaknesses to address to further improve Melbourne's cultural and creative offer • 90% of Arts Agencies and Thought Leaders believe Melbourne's cultural offer is not clearly articulated or cutting through International visitors are 25% more likely to recommend Melbourne as a creative destination after visiting (versus before) • Several gaps in Melbourne's offer, e. g. museum offer, world class contemporary art gallery, modern museums/galleries of science and design. Some parts of offer are losing audiences • It can be difficult for visitors to access the breadth/depth of Melbourne's offer, with no central source of Melbourne information • Workshop, studio and exhibition space appears to be declining in the City, and the affordability of remaining space is low, which risks a "hollowing out" of Melbourne's cultural and creative sector, and the "buzz" it generates for locals and visitors • Melbourne is seen as lacking the kind of icon associated with major uplifts in visits elsewhere (eg. , MONA increased Hobart visitation ca. 8%); Thought Leaders have mixed views on need for new infrastructure These findings suggest five strategic priorities to improve Melbourne's position as a global cultural and creative destination, which may lift Melbourne's position on the Performance Index 1. Increasing consumer awareness of Melbourne: clear creative city messages, targeting priority segments, growing awareness 2. Protecting existing infrastructure: expanding supply of creative working spaces, addressing critical maintenance backlog 3. Optimising the current offer: building an integrated marketing, sales and reviews platform, enhancing attraction connectivity 4. Expanding the offer: strengthening festivals, events and institutions and investing in new infrastructure 5. Enhancing governance: improving agency collaboration for mutual gain (e. g. , digital); improve investment processes 1. Compared to 18 other major cultural and creative capitals, Melbourne ranks fourth highest in per capita assets (museums, galleries, theatres and live music venues) 5
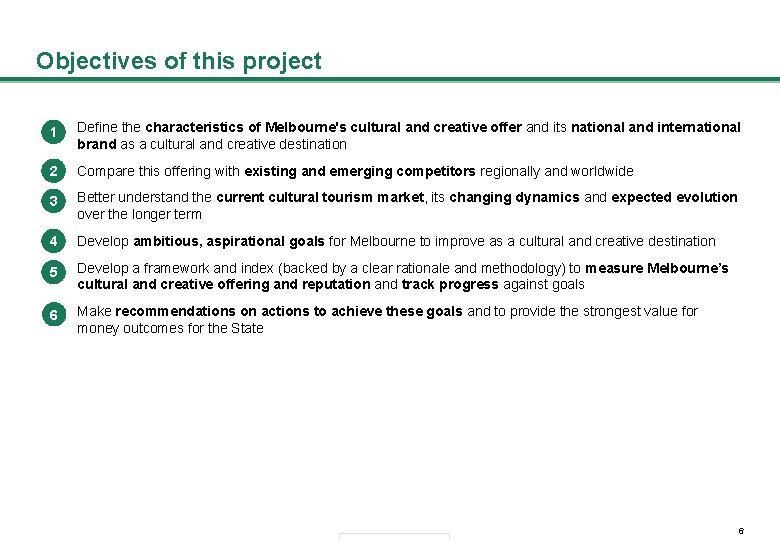
Objectives of this project 1. 1 Define the characteristics of Melbourne's cultural and creative offer and its national and international brand as a cultural and creative destination 2. 2 Compare this offering with existing and emerging competitors regionally and worldwide 3. 3 Better understand the current cultural tourism market, its changing dynamics and expected evolution over the longer term 4. 4 Develop ambitious, aspirational goals for Melbourne to improve as a cultural and creative destination 5. 5 Develop a framework and index (backed by a clear rationale and methodology) to measure Melbourne’s cultural and creative offering and reputation and track progress against goals 6. 6 Make recommendations on actions to achieve these goals and to provide the strongest value for money outcomes for the State 6
Agenda Executive Summary Context Performance Index Assessing Melbourne against best practice Cultural travellers and trends Strategic priorities Next steps 7
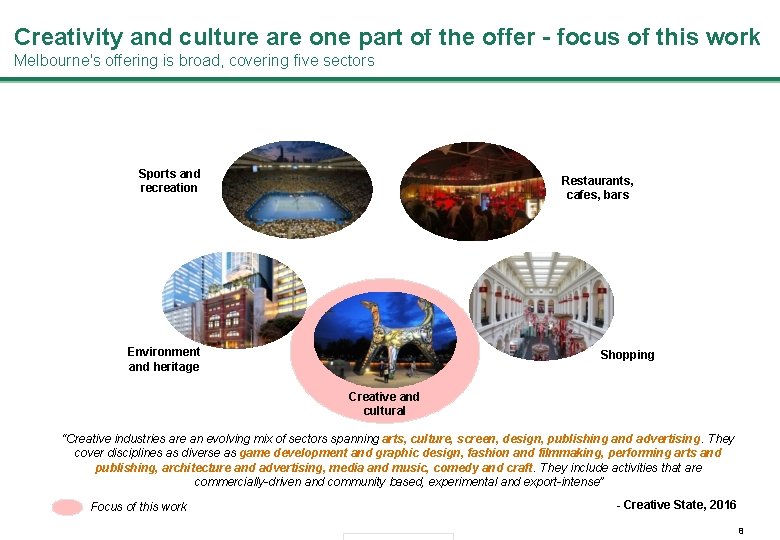
Creativity and culture are one part of the offer - focus of this work Melbourne's offering is broad, covering five sectors Sports and recreation Restaurants, cafes, bars Environment and heritage Shopping Creative and cultural “Creative industries are an evolving mix of sectors spanning arts, culture, screen, design, publishing and advertising. They cover disciplines as diverse as game development and graphic design, fashion and filmmaking, performing arts and publishing, architecture and advertising, media and music, comedy and craft. They include activities that are commercially-driven and community based, experimental and export-intense” Focus of this work - Creative State, 2016 8
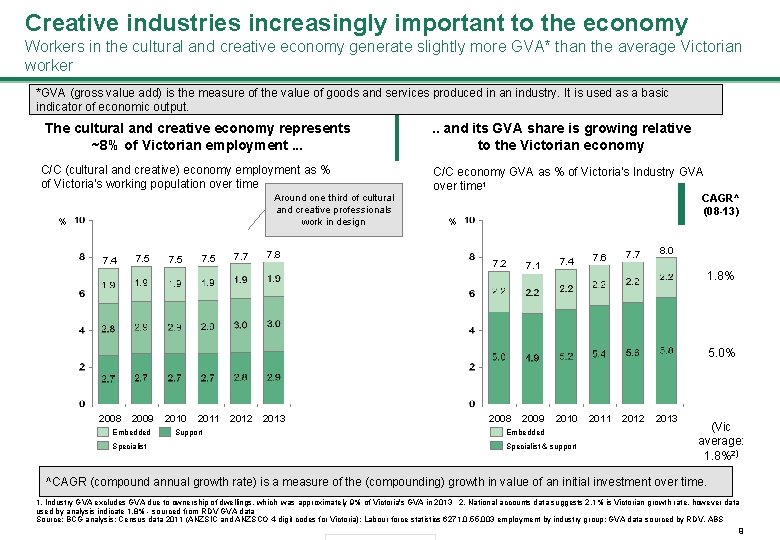
Creative industries increasingly important to the economy Workers in the cultural and creative economy generate slightly more GVA* than the average Victorian worker *GVA (gross value add) is the measure of the value of goods and services produced in an industry. It is used as a basic indicator of economic output. The cultural and creative economy represents ~8% of Victorian employment. . . C/C (cultural and creative) economy employment as % of Victoria's working population over time Around one third of cultural and creative professionals work in design % 7. 4 7. 5 7. 7 7. 8 . . and its GVA share is growing relative to the Victorian economy C/C economy GVA as % of Victoria's Industry GVA over time 1 CAGR^ (08 -13) % 7. 2 7. 1 7. 4 7. 6 7. 7 8. 0 1. 8% 5. 0% 2008 2009 Embedded Specialist 2010 2011 Support 2012 2013 2008 2009 2010 Embedded Specialist & support 2011 2012 2013 (Vic average: 1. 8%2) ^CAGR (compound annual growth rate) is a measure of the (compounding) growth in value of an initial investment over time. 1. Industry GVA excludes GVA due to ownership of dwellings, which was approximately 9% of Victoria's GVA in 2013 2. National accounts data suggests 2. 1% is Victorian growth rate, however data used by analysis indicate 1. 8% - sourced from RDV GVA data Source: BCG analysis; Census data 2011 (ANZSIC and ANZSCO 4 -digit codes for Victoria); Labour force statistics 6271. 0. 55. 003 employment by industry group; GVA data sourced by RDV, ABS 9
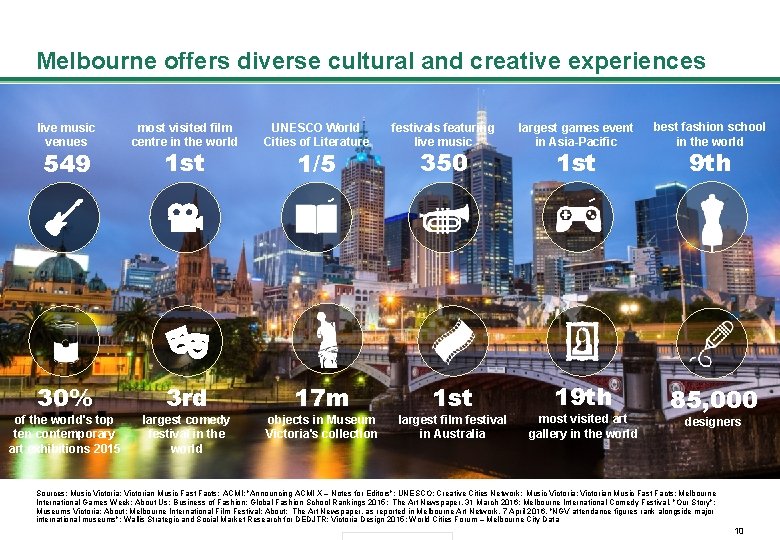
Melbourne offers diverse cultural and creative experiences live music venues most visited film centre in the world 30% 3 rd 549 of the world's top ten contemporary art exhibitions 2015 1 st largest comedy festival in the world UNESCO World Cities of Literature 1/5 17 m objects in Museum Victoria's collection festivals featuring live music 350 1 st largest film festival in Australia largest games event in Asia-Pacific 1 st 19 th most visited art gallery in the world best fashion school in the world 9 th 85, 000 designers Sources: Music Victoria: Victorian Music Fast Facts; ACMI: "Announcing ACMI X – Notes for Editors"; UNESCO: Creative Cities Network; Music Victoria: Victorian Music Fast Facts; Melbourne International Games Week: About Us; Business of Fashion: Global Fashion School Rankings 2015; The Art Newspaper, 31 March 2016; Melbourne International Comedy Festival, "Our Story"; Museums Victoria: About; Melbourne International Film Festival: About; The Art Newspaper, as reported in Melbourne Art Network, 7 April 2016, "NGV attendance figures rank alongside major international museums"; Wallis Strategic and Social Market Research for DEDJTR: Victoria Design 2015; World Cities Forum – Melbourne City Data 10
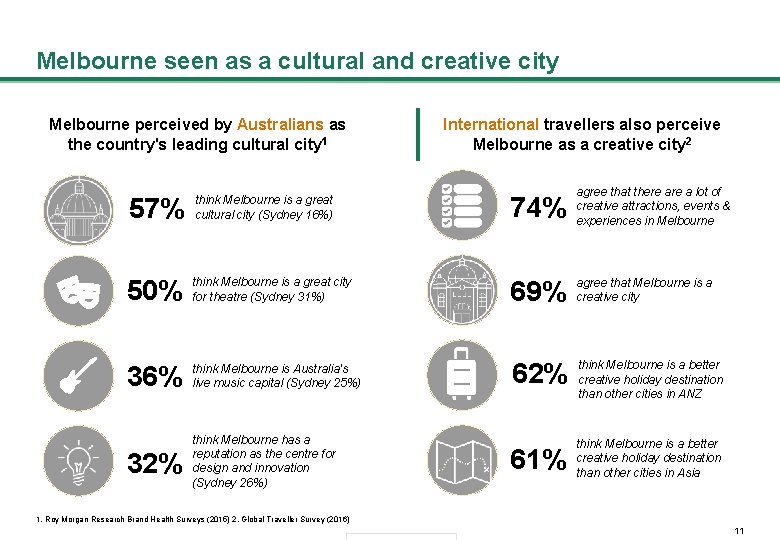
Melbourne seen as a cultural and creative city Melbourne perceived by Australians as the country's leading cultural city 1 International travellers also perceive Melbourne as a creative city 2 57% think Melbourne is a great cultural city (Sydney 16%) 74% agree that there a lot of creative attractions, events & experiences in Melbourne 50% think Melbourne is a great city for theatre (Sydney 31%) 69% agree that Melbourne is a creative city 36% think Melbourne is Australia's live music capital (Sydney 25%) 62% think Melbourne is a better creative holiday destination than other cities in ANZ 32% think Melbourne has a reputation as the centre for design and innovation (Sydney 26%) 61% think Melbourne is a better creative holiday destination than other cities in Asia 1. Roy Morgan Research Brand Health Surveys (2015) 2. Global Traveller Survey (2016) 11
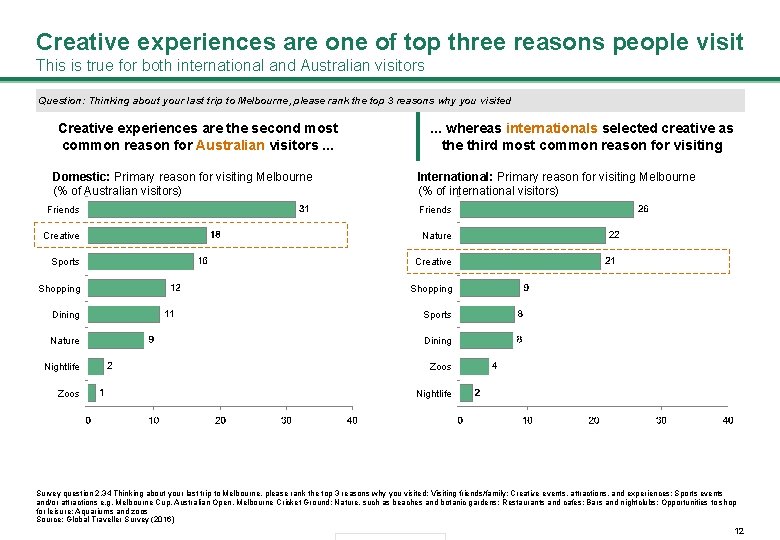
Creative experiences are one of top three reasons people visit This is true for both international and Australian visitors Question: Thinking about your last trip to Melbourne, please rank the top 3 reasons why you visited Creative experiences are the second most common reason for Australian visitors. . . Domestic: Primary reason for visiting Melbourne (% of Australian visitors) . . . whereas internationals selected creative as the third most common reason for visiting International: Primary reason for visiting Melbourne (% of international visitors) Friends Creative Nature Sports Creative Shopping Dining Sports Nature Dining Nightlife Zoos Nightlife Survey question 2. 34 Thinking about your last trip to Melbourne, please rank the top 3 reasons why you visited: Visiting friends/family; Creative events, attractions, and experiences; Sports events and/or attractions e. g. Melbourne Cup, Australian Open, Melbourne Cricket Ground; Nature, such as beaches and botanic gardens; Restaurants and cafes; Bars and nightclubs; Opportunities to shop for leisure; Aquariums and zoos Source: Global Traveller Survey (2016) 12
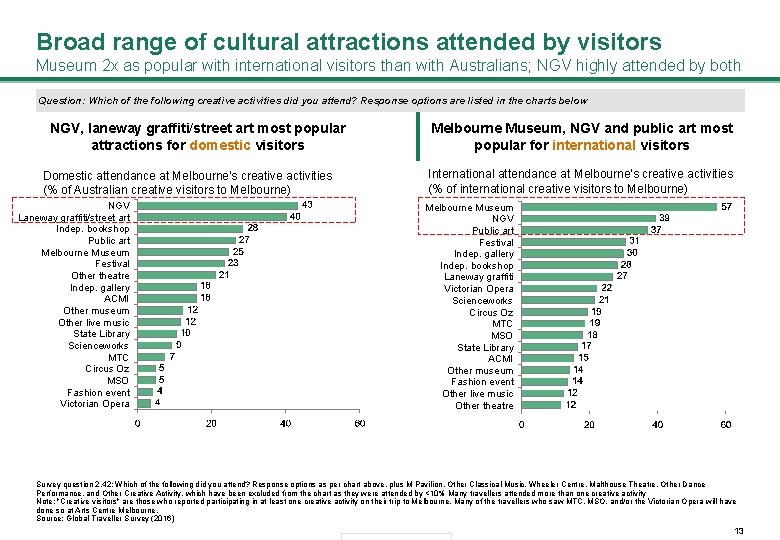
Broad range of cultural attractions attended by visitors Museum 2 x as popular with international visitors than with Australians; NGV highly attended by both Question: Which of the following creative activities did you attend? Response options are listed in the charts below NGV, laneway graffiti/street art most popular attractions for domestic visitors Domestic attendance at Melbourne's creative activities (% of Australian creative visitors to Melbourne) NGV Laneway graffiti/street art Indep. bookshop Public art Melbourne Museum Festival Other theatre Indep. gallery ACMI Other museum Other live music State Library Scienceworks MTC Circus Oz MSO Fashion event Victorian Opera Melbourne Museum, NGV and public art most popular for international visitors International attendance at Melbourne's creative activities (% of international creative visitors to Melbourne) Melbourne Museum NGV Public art Festival Indep. gallery Indep. bookshop Laneway graffiti Victorian Opera Scienceworks Circus Oz MTC MSO State Library ACMI Other museum Fashion event Other live music Other theatre Survey question 2. 42: Which of the following did you attend? Response options as per chart above, plus M Pavilion, Other Classical Music, Wheeler Centre, Malthouse Theatre, Other Dance Performance, and Other Creative Activity, which have been excluded from the chart as they were attended by <10% Many travellers attended more than one creative activity Note: "Creative visitors" are those who reported participating in at least one creative activity on their trip to Melbourne. Many of the travellers who saw MTC, MSO, and/or the Victorian Opera will have done so at Arts Centre Melbourne. Source: Global Traveller Survey (2016) 13
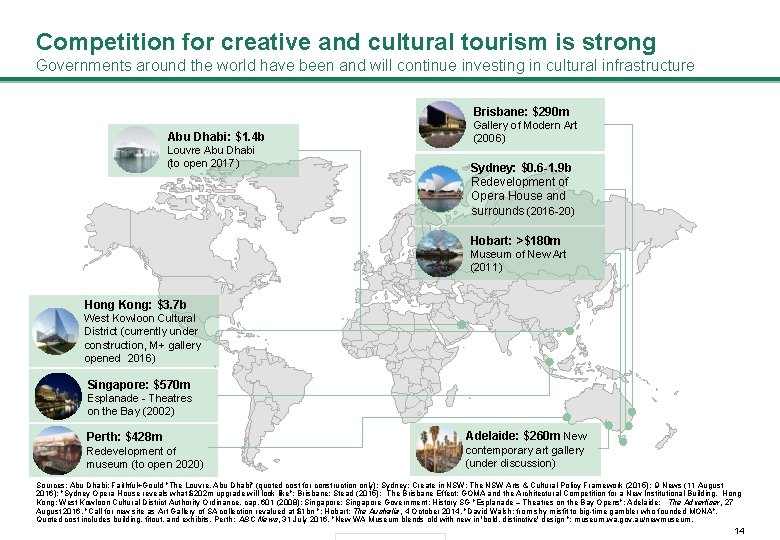
Competition for creative and cultural tourism is strong Governments around the world have been and will continue investing in cultural infrastructure Brisbane: $290 m Abu Dhabi: $1. 4 b Louvre Abu Dhabi (to open 2017) Gallery of Modern Art (2006) Sydney: $0. 6 -1. 9 b Redevelopment of Opera House and surrounds (2016 -20) Hobart: >$180 m Museum of New Art (2011) Hong Kong: $3. 7 b West Kowloon Cultural District (currently under construction, M+ gallery opened 2016) Singapore: $570 m Esplanade - Theatres on the Bay (2002) Perth: $428 m Adelaide: $260 m New Redevelopment of museum (to open 2020) contemporary art gallery (under discussion) Sources: Abu Dhabi: Faithful+Gould "The Louvre, Abu Dhabi" (quoted cost for construction only); Sydney: Create in NSW: The NSW Arts & Cultural Policy Framework (2015); 9 News (11 August 2016): "Sydney Opera House reveals what $202 m upgrade will look like"; Brisbane: Stead (2015): The Brisbane Effect: GOMA and the Architectural Competition for a New Institutional Building. Hong Kong: West Kowloon Cultural District Authority Ordinance, cap. 601 (2008); Singapore: Singapore Government: History SG "Esplanade – Theatres on the Bay Opens"; Adelaide: The Advertiser, 27 August 2016, "Call for new site as Art Gallery of SA collection revalued at $1 bn "; Hobart: The Australia, 4 October 2014, "David Walsh: from shy misfit to big-time gambler who founded MONA". Quoted cost includes building, fitout, and exhibits. Perth: ABC News, 31 July 2016, "New WA Museum blends old with new in 'bold, distinctive' design "; museum. wa. gov. au/newmuseum. 14
Agenda Executive Summary Context Performance Index Assessing Melbourne against best practice Cultural travellers and trends Strategic priorities Next steps 15
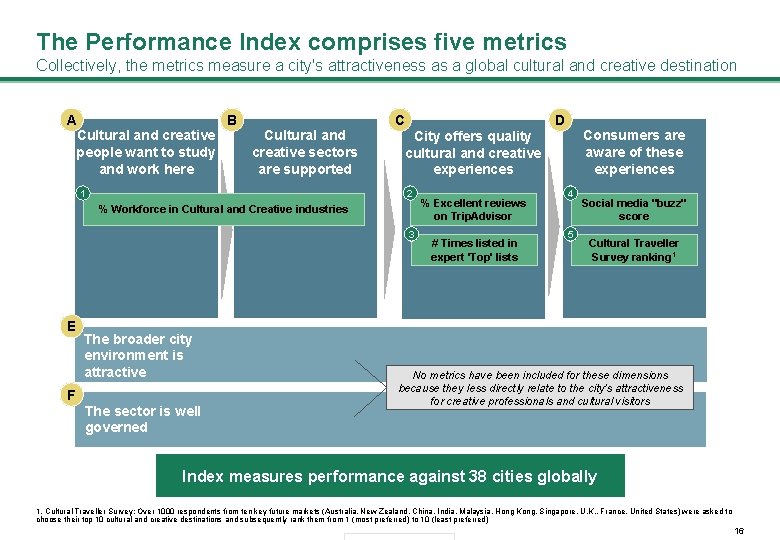
The Performance Index comprises five metrics Collectively, the metrics measure a city's attractiveness as a global cultural and creative destination A B Cultural and creative people want to study and work here Cultural and creative sectors are supported 1 C D 2 % Workforce in Cultural and Creative industries 3 E The broader city environment is attractive F The sector is well governed Consumers are aware of these experiences City offers quality cultural and creative experiences % Excellent reviews on Trip. Advisor # Times listed in expert 'Top' lists 4 5 Social media "buzz" score Cultural Traveller Survey ranking 1 No metrics have been included for these dimensions because they less directly relate to the city's attractiveness for creative professionals and cultural visitors Index measures performance against 38 cities globally 1. Cultural Traveller Survey: Over 1000 respondents from ten key future markets (Australia, New Zealand, China, India, Malaysia, Hong Kong, Singapore, U. K. , France, United States) were asked to choose their top 10 cultural and creative destinations and subsequently rank them from 1 (most preferred) to 10 (least preferred) 16
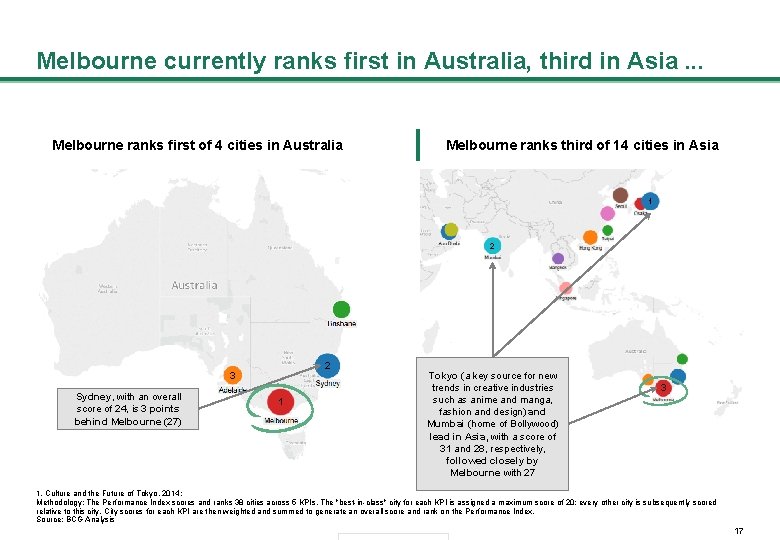
Melbourne currently ranks first in Australia, third in Asia. . . Melbourne ranks first of 4 cities in Australia Melbourne ranks third of 14 cities in Asia 1 2 2 3 Sydney, with an overall score of 24, is 3 points behind Melbourne (27) 1 Tokyo (a key source for new trends in creative industries such as anime and manga, fashion and design) and Mumbai (home of Bollywood) lead in Asia, with a score of 31 and 28, respectively, followed closely by Melbourne with 27 3 1. Culture and the Future of Tokyo, 2014; Methodology: The Performance Index scores and ranks 38 cities across 5 KPIs. The "best-in-class" city for each KPI is assigned a maximum score of 20; every other city is subsequently scored relative to this city. City scores for each KPI are then weighted and summed to generate an overall score and rank on the Performance Index. Source: BCG Analysis 17
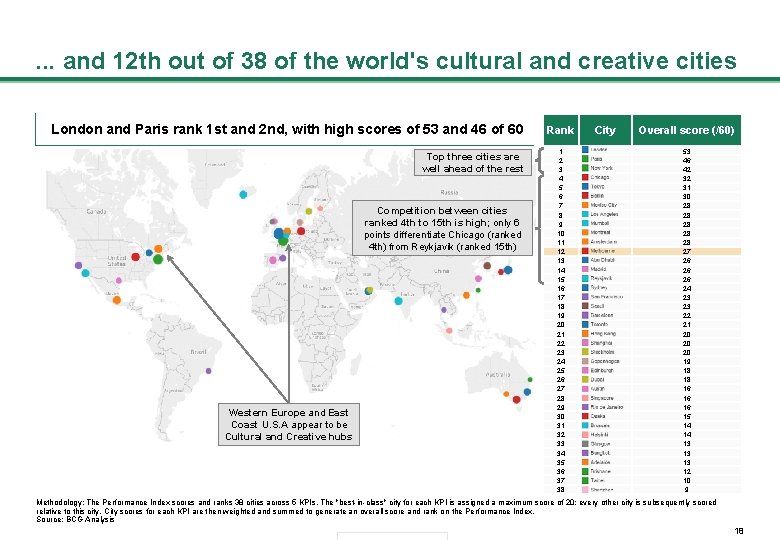
. . . and 12 th out of 38 of the world's cultural and creative cities London and Paris rank 1 st and 2 nd, with high scores of 53 and 46 of 60 Top three cities are well ahead of the rest Competition between cities ranked 4 th to 15 th is high; only 6 points differentiate Chicago (ranked 4 th) from Reykjavik (ranked 15 th) Western Europe and East Coast U. S. A appear to be Cultural and Creative hubs Rank 1 2 3 4 5 6 7 8 9 10 11 12 13 14 15 16 17 18 19 20 21 22 23 24 25 26 27 28 29 30 31 32 33 34 35 36 37 38 City Overall score (/60) 53 46 42 32 31 30 28 28 28 27 26 26 26 24 23 23 22 21 20 20 20 19 18 18 16 16 16 15 14 14 13 13 13 12 10 9 Methodology: The Performance Index scores and ranks 38 cities across 5 KPIs. The "best-in-class" city for each KPI is assigned a maximum score of 20; every other city is subsequently scored relative to this city. City scores for each KPI are then weighted and summed to generate an overall score and rank on the Performance Index. Source: BCG Analysis 18
Agenda Executive Summary Context Performance Index Assessing Melbourne against best practice Cultural travellers and trends Strategic priorities Next steps 19
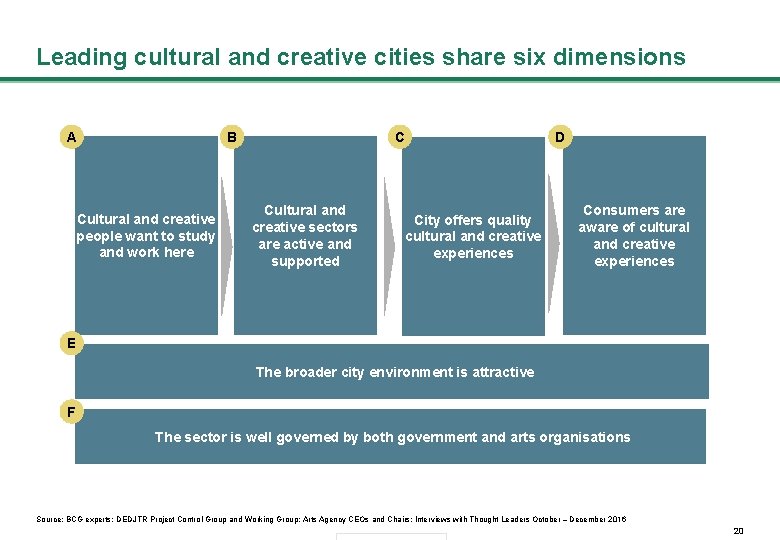
Leading cultural and creative cities share six dimensions A B Cultural and creative people want to study and work here C Cultural and creative sectors are active and supported D City offers quality cultural and creative experiences Consumers are aware of cultural and creative experiences E The broader city environment is attractive F The sector is well governed by both government and arts organisations Source: BCG experts; DEDJTR Project Control Group and Working Group; Arts Agency CEOs and Chairs; Interviews with Thought Leaders October – December 2016 20
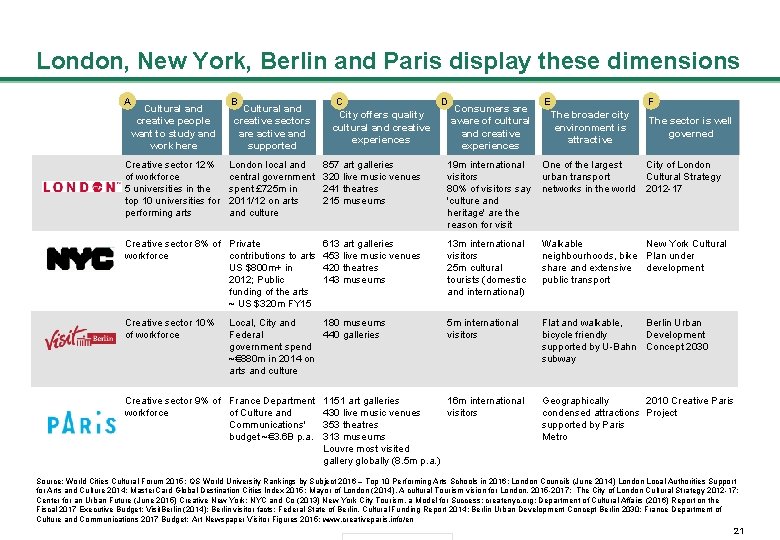
London, New York, Berlin and Paris display these dimensions A Cultural and creative people want to study and work here Creative sector 12% of workforce 5 universities in the top 10 universities for performing arts B Cultural and creative sectors are active and supported C City offers quality cultural and creative experiences D Consumers are aware of cultural and creative experiences E F The broader city environment is attractive The sector is well governed London local and central government spent £ 725 m in 2011/12 on arts and culture 857 art galleries 320 live music venues 241 theatres 215 museums 19 m international One of the largest visitors urban transport 80% of visitors say networks in the world 'culture and heritage' are the reason for visit Creative sector 8% of Private workforce contributions to arts US $800 m+ in 2012; Public funding of the arts ~ US $320 m FY 15 613 art galleries 453 live music venues 420 theatres 143 museums 13 m international visitors 25 m cultural tourists (domestic and international) Walkable New York Cultural neighbourhoods, bike Plan under share and extensive development public transport 5 m international visitors Flat and walkable, Berlin Urban bicycle friendly Development supported by U-Bahn Concept 2030 subway Creative sector 10% of workforce Local, City and 180 museums Federal 440 galleries government spend ~€ 880 m in 2014 on arts and culture Creative sector 9% of France Department 1151 art galleries 16 m international workforce of Culture and 430 live music venues visitors Communications' 353 theatres budget ~€ 3. 6 B p. a. 313 museums Louvre most visited gallery globally (8. 5 m p. a. ) City of London Cultural Strategy 2012 -17 Geographically 2010 Creative Paris condensed attractions Project supported by Paris Metro Source: World Cities Cultural Forum 2015; QS World University Rankings by Subject 2016 – Top 10 Performing Arts Schools in 2016: London Councils (June 2014) London Local Authorities Support for Arts and Culture 2014; Master. Card Global Destination Cities Index 2015: Mayor of London (2014), A cultural Tourism vision for London, 2015 -2017; The City of London Cultural Strategy 2012 -17; Center for an Urban Future (June 2015) Creative New York; NYC and Co (2013) New York City Tourism, a Model for Success; createnyc. org; Department of Cultural Affairs (2016) Report on the Fiscal 2017 Executive Budget; Visit. Berlin (2014): Berlin visitor facts; Federal State of Berlin, Cultural Funding Report 2014; Berlin Urban Development Concept Berlin 2030: France Department of Culture and Communications 2017 Budget: Art Newspaper Visitor Figures 2015; www. creativeparis. info/en 21
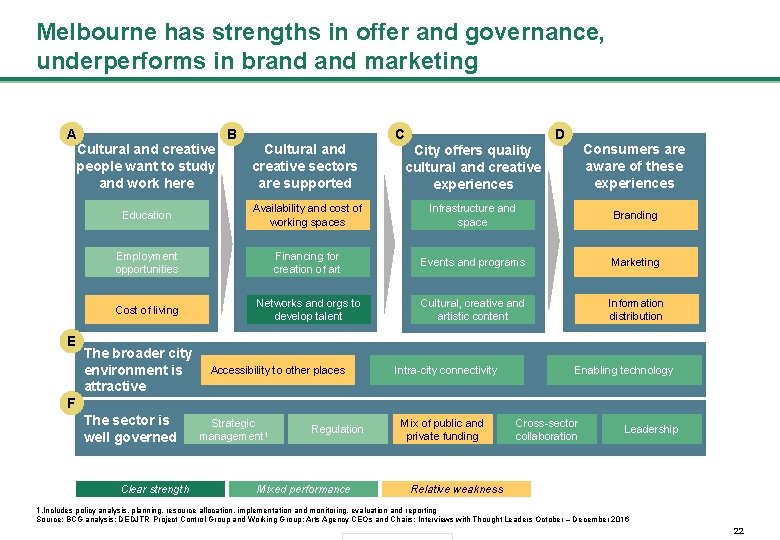
Melbourne has strengths in offer and governance, underperforms in brand marketing A B Cultural and creative people want to study and work here E Cultural and creative sectors are supported C D City offers quality cultural and creative experiences Consumers are aware of these experiences Education Availability and cost of working spaces Infrastructure and space Branding Employment opportunities Financing for creation of art Events and programs Marketing Cost of living Networks and orgs to develop talent Cultural, creative and artistic content Information distribution The broader city environment is attractive Accessibility to other places Intra-city connectivity Enabling technology F The sector is well governed Clear strength Strategic management 1 Regulation Mixed performance Mix of public and private funding Cross-sector collaboration Leadership Relative weakness 1. Includes policy analysis, planning, resource allocation, implementation and monitoring, evaluation and reporting Source: BCG analysis; DEDJTR Project Control Group and Working Group; Arts Agency CEOs and Chairs; Interviews with Thought Leaders October – December 2016 22
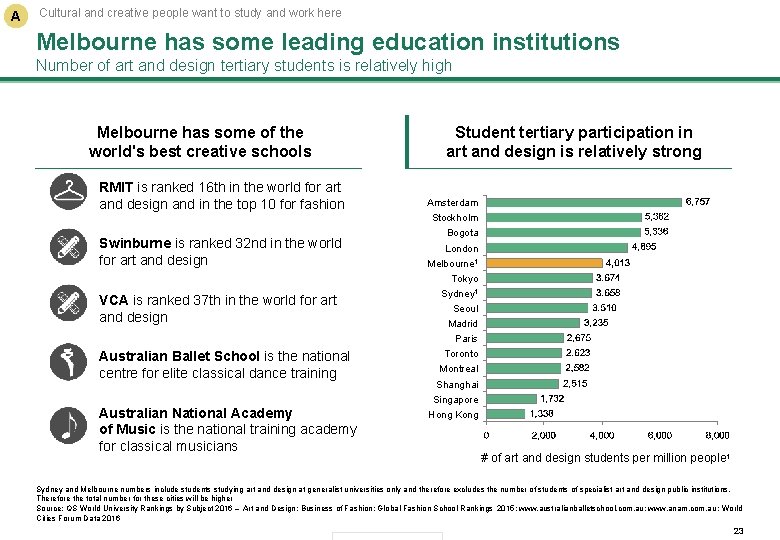
A Cultural and creative people want to study and work here Melbourne has some leading education institutions Number of art and design tertiary students is relatively high Melbourne has some of the world's best creative schools RMIT is ranked 16 th in the world for art and design and in the top 10 for fashion Swinburne is ranked 32 nd in the world for art and design VCA is ranked 37 th in the world for art and design Australian Ballet School is the national centre for elite classical dance training Australian National Academy of Music is the national training academy for classical musicians Student tertiary participation in art and design is relatively strong Amsterdam Stockholm Bogota London Melbourne 1 Tokyo Sydney 1 Seoul Madrid Paris Toronto Montreal Shanghai Singapore Hong Kong # of art and design students per million people 1 Sydney and Melbourne numbers include students studying art and design at generalist universities only and therefore excludes the number of students of specialist art and design public institutions. Therefore the total number for these cities will be higher Source: QS World University Rankings by Subject 2016 – Art and Design; Business of Fashion: Global Fashion School Rankings 2015; www. australianballetschool. com. au; www. anam. com. au ; World Cities Forum Data 2016 23
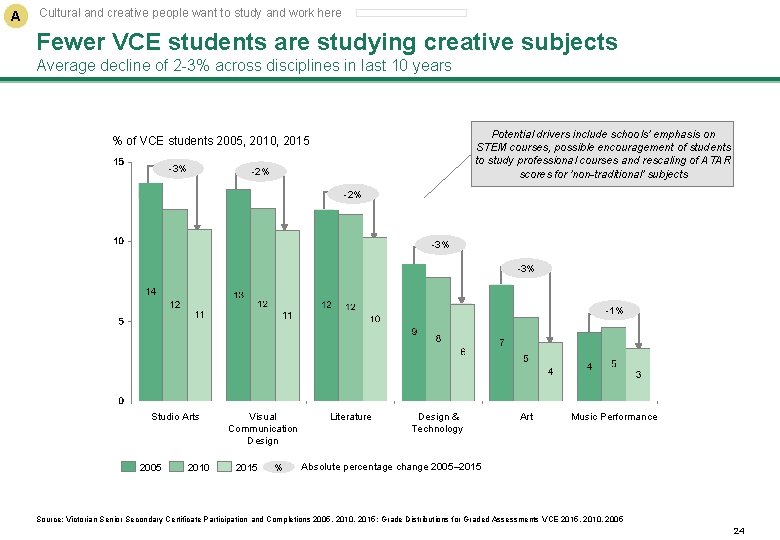
A Cultural and creative people want to study and work here Fewer VCE students are studying creative subjects Average decline of 2 -3% across disciplines in last 10 years Potential drivers include schools' emphasis on STEM courses, possible encouragement of students to study professional courses and rescaling of ATAR scores for 'non-traditional' subjects % of VCE students 2005, 2010, 2015 -3% -2% -3% -1% Studio Arts 2005 2010 Visual Communication Design 2015 % Literature Design & Technology Art Music Performance Absolute percentage change 2005– 2015 Source: Victorian Senior Secondary Certificate Participation and Completions 2005, 2010, 2015; Grade Distributions for Graded Assessments VCE 2015, 2010, 2005 24
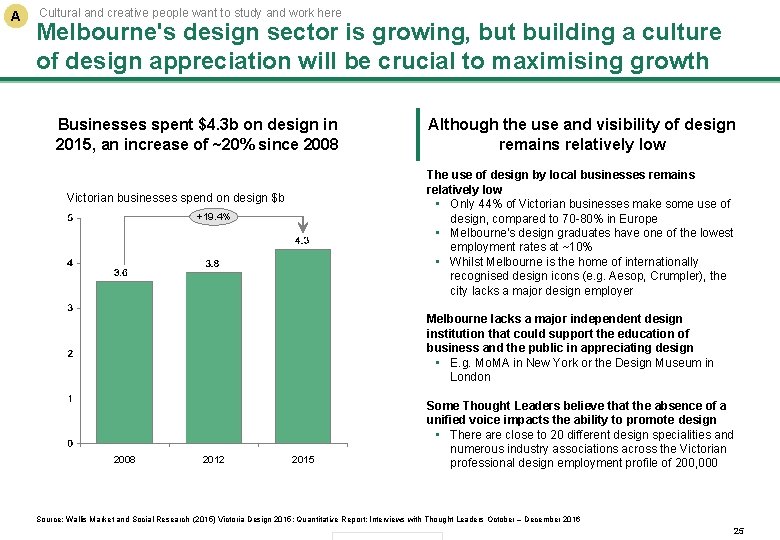
A Cultural and creative people want to study and work here Melbourne's design sector is growing, but building a culture of design appreciation will be crucial to maximising growth Businesses spent $4. 3 b on design in 2015, an increase of ~20% since 2008 Although the use and visibility of design remains relatively low The use of design by local businesses remains relatively low • Only 44% of Victorian businesses make some use of design, compared to 70 -80% in Europe • Melbourne's design graduates have one of the lowest employment rates at ~10% • Whilst Melbourne is the home of internationally recognised design icons (e. g. Aesop, Crumpler), the city lacks a major design employer Victorian businesses spend on design $b +19. 4% Melbourne lacks a major independent design institution that could support the education of business and the public in appreciating design • E. g. Mo. MA in New York or the Design Museum in London 2008 2012 2015 Some Thought Leaders believe that the absence of a unified voice impacts the ability to promote design • There are close to 20 different design specialities and numerous industry associations across the Victorian professional design employment profile of 200, 000 Source: Wallis Market and Social Research (2015) Victoria Design 2015: Quantitative Report; Interviews with Thought Leaders October – December 2016 25
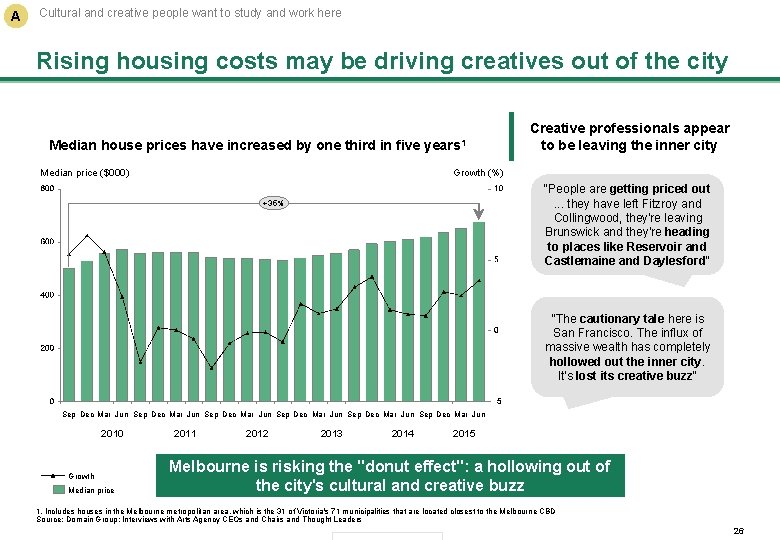
A Cultural and creative people want to study and work here Rising housing costs may be driving creatives out of the city Median house prices have increased by one third in five Median price ($000) years 1 Creative professionals appear to be leaving the inner city Growth (%) "People are getting priced out. . . they have left Fitzroy and Collingwood, they're leaving Brunswick and they're heading to places like Reservoir and Castlemaine and Daylesford" +35% "The cautionary tale here is San Francisco. The influx of massive wealth has completely hollowed out the inner city. It's lost its creative buzz" Sep Dec Mar Jun Sep Dec Mar Jun 2010 Growth Median price 2011 2012 2013 2014 2015 Melbourne is risking the "donut effect": a hollowing out of the city's cultural and creative buzz 1. Includes houses in the Melbourne metropolitan area, which is the 31 of Victoria's 71 municipalities that are located closest to the Melbourne CBD Source: Domain Group; Interviews with Arts Agency CEOs and Chairs and Thought Leaders 26
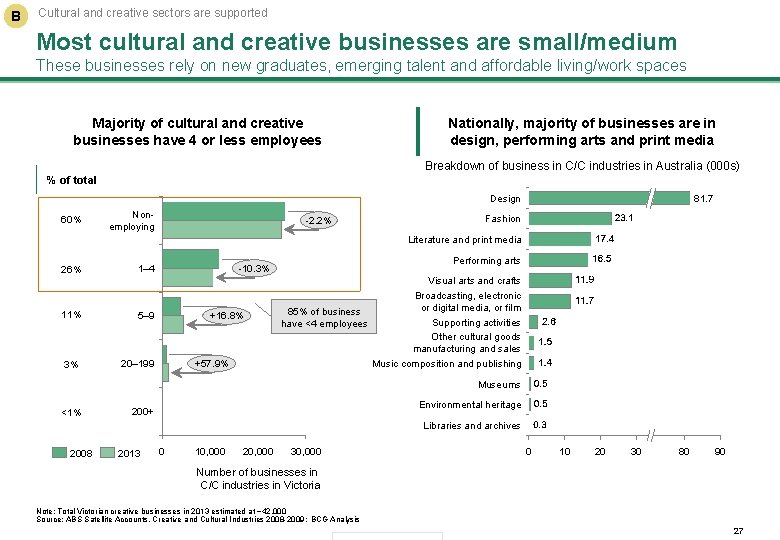
B Cultural and creative sectors are supported Most cultural and creative businesses are small/medium These businesses rely on new graduates, emerging talent and affordable living/work spaces Majority of cultural and creative businesses have 4 or less employees Nationally, majority of businesses are in design, performing arts and print media Breakdown of business in C/C industries in Australia (000 s) % of total Design 60% Nonemploying -2. 2% 81. 7 Fashion Literature and print media 26% 1– 4 11% 5– 9 3% 20– 199 Performing arts -10. 3% +16. 8% +57. 9% Visual arts and crafts Broadcasting, electronic or digital media, or film 85% of business Supporting activities have <4 employees Other cultural goods manufacturing and sales Music composition and publishing Museums <1% Environmental heritage 200+ Libraries and archives 2008 2013 0 10, 000 20, 000 30, 000 0 10 20 30 80 90 Number of businesses in C/C industries in Victoria Note: Total Victorian creative businesses in 2013 estimated at ~42, 000 Source: ABS Satellite Accounts, Creative and Cultural Industries 2008 -2009; BCG Analysis 27
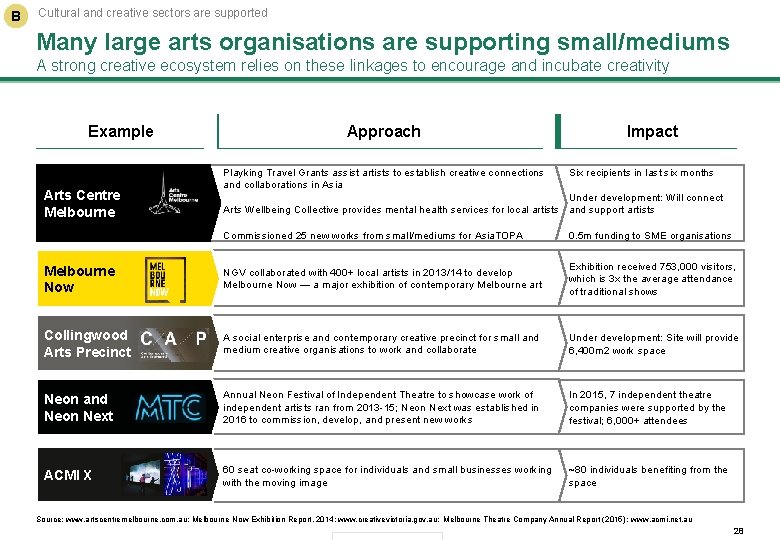
B Cultural and creative sectors are supported Many large arts organisations are supporting small/mediums A strong creative ecosystem relies on these linkages to encourage and incubate creativity Example Arts Centre Melbourne Approach Playking Travel Grants assist artists to establish creative connections and collaborations in Asia Impact Six recipients in last six months Under development: Will connect Arts Wellbeing Collective provides mental health services for local artists and support artists Commissioned 25 new works from small/mediums for Asia. TOPA 0. 5 m funding to SME organisations Melbourne Now NGV collaborated with 400+ local artists in 2013/14 to develop Melbourne Now — a major exhibition of contemporary Melbourne art Exhibition received 753, 000 visitors, which is 3 x the average attendance of traditional shows Collingwood Arts Precinct A social enterprise and contemporary creative precinct for small and medium creative organisations to work and collaborate Under development: Site will provide 6, 400 m 2 work space Neon and Neon Next Annual Neon Festival of Independent Theatre to showcase work of independent artists ran from 2013 -15; Neon Next was established in 2016 to commission, develop, and present new works In 2015, 7 independent theatre companies were supported by the festival; 6, 000+ attendees ACMI X 60 seat co-working space for individuals and small businesses working with the moving image ~80 individuals benefiting from the space Source: www. artscentremelbourne. com. au; Melbourne Now Exhibition Report, 2014; www. creativevictoria. gov. au; Melbourne Theatre Company Annual Report (2015); www. acmi. net. au 28
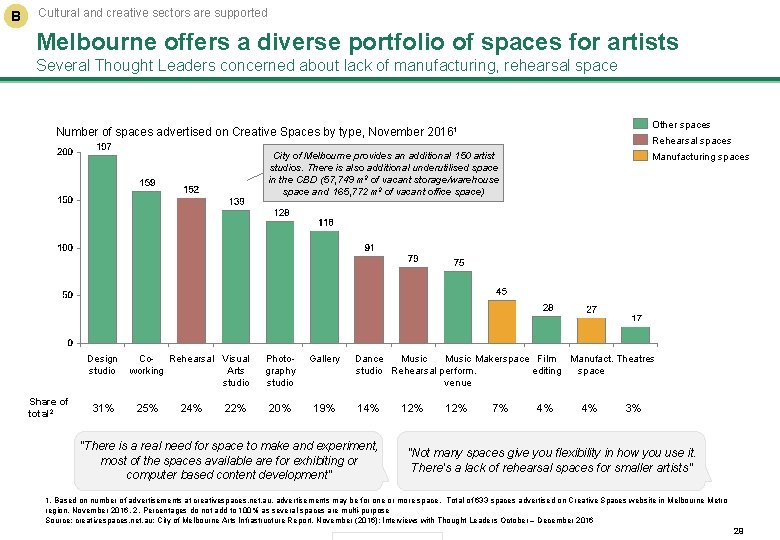
B Cultural and creative sectors are supported Melbourne offers a diverse portfolio of spaces for artists Several Thought Leaders concerned about lack of manufacturing, rehearsal space Other spaces Number of spaces advertised on Creative Spaces by type, November 20161 Rehearsal spaces City of Melbourne provides an additional 150 artist studios. There is also additional underutilised space in the CBD (57, 749 m 2 of vacant storage/warehouse space and 165, 772 m 2 of vacant office space) Design Co- Rehearsal Visual studio working Arts studio Share of total 2 31% 25% 24% 22% Photo- graphy studio Gallery 20% 19% Manufacturing spaces Dance Music Makerspace Film Manufact. Theatres studio Rehearsal perform. editing space venue 14% "There is a real need for space to make and experiment, most of the spaces available are for exhibiting or computer based content development" 12% 7% 4% 4% 3% "Not many spaces give you flexibility in how you use it. There's a lack of rehearsal spaces for smaller artists" 1. Based on number of advertisements at creativespaces. net. au, advertisements may be for one or more space. Total of 633 spaces advertised on Creative Spaces website in Melbourne Metro region, November 2016. 2. Percentages do not add to 100% as several spaces are multi-purpose Source: creativespaces. net. au; City of Melbourne Arts Infrastructure Report, November (2016); Interviews with Thought Leaders October – December 2016 29
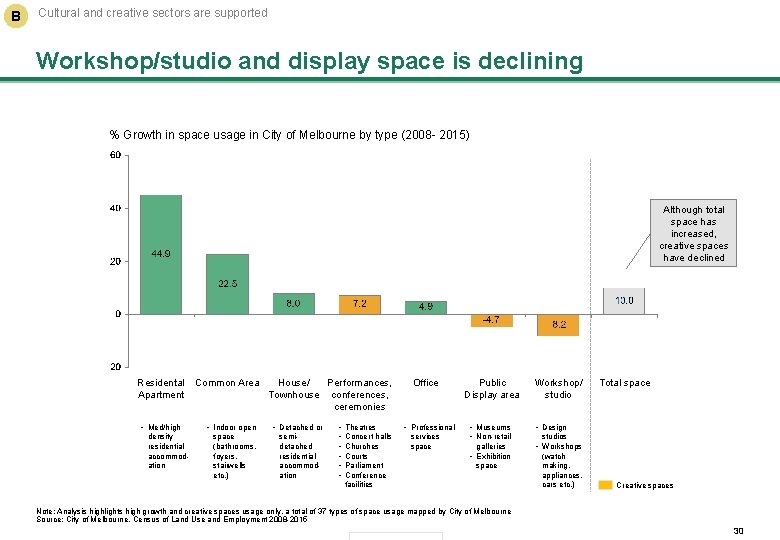
B Cultural and creative sectors are supported Workshop/studio and display space is declining % Growth in space usage in City of Melbourne by type (2008 - 2015) Although total space has increased, creative spaces have declined Residental Common Area House/ Performances, Apartment Townhouse conferences, ceremonies • Med/high density residential accommodation • Indoor open space (bathrooms, foyers, stairwells etc. ) • Detached or semidetached residential accommodation • • • Theatres Concert halls Churches Courts Parliament Conference facilities Office • Professional services space Public Display area Workshop/ studio • Museums • Non-retail • Design galleries • Exhibition space • Workshops Total space studios (watch making, appliances, cars etc. ) Creative spaces Note: Analysis highlights high growth and creative spaces usage only, a total of 37 types of space usage mapped by City of Melbourne Source: City of Melbourne, Census of Land Use and Employment 2008 -2015 30
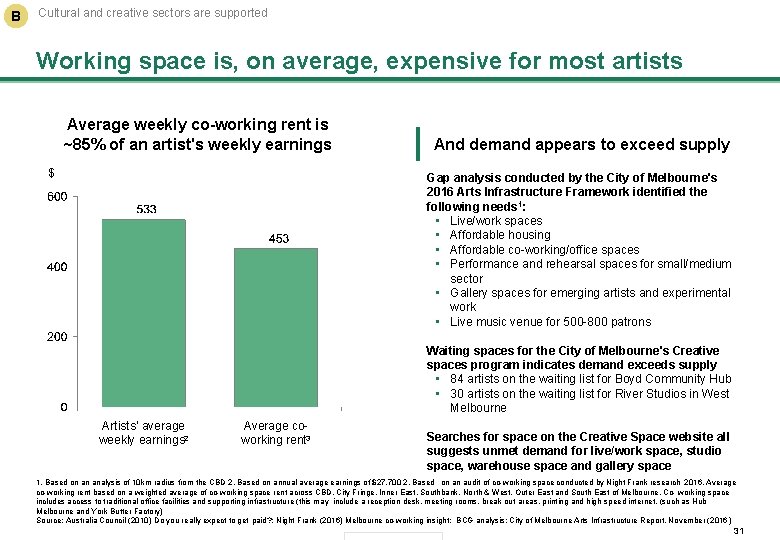
B Cultural and creative sectors are supported Working space is, on average, expensive for most artists Average weekly co-working rent is ~85% of an artist's weekly earnings $ And demand appears to exceed supply Gap analysis conducted by the City of Melbourne's 2016 Arts Infrastructure Framework identified the following needs 1: • Live/work spaces • Affordable housing • Affordable co-working/office spaces • Performance and rehearsal spaces for small/medium sector • Gallery spaces for emerging artists and experimental work • Live music venue for 500 -800 patrons Waiting spaces for the City of Melbourne's Creative spaces program indicates demand exceeds supply • 84 artists on the waiting list for Boyd Community Hub • 30 artists on the waiting list for River Studios in West Melbourne Artists’ average weekly earnings 2 Average coworking rent 3 Searches for space on the Creative Space website all suggests unmet demand for live/work space, studio space, warehouse space and gallery space 1. Based on an analysis of 10 km radius from the CBD 2. Based on annual average earnings of $27, 700 2. Based on an audit of co-working space conducted by Night Frank research 2016. Average co-working rent based on a weighted average of co-working space rent across CBD, City Fringe, Inner East, Southbank, North & West, Outer East and South East of Melbourne. Co- working space includes access to traditional office facilities and supporting infrastructure (this may include a reception desk, meeting rooms, break out areas, printing and high speed internet. (such as Hub Melbourne and York Butter Factory) Source: Australia Council (2010) Do you really expect to get paid? ; Night Frank (2016) Melbourne co-working insight; BCG analysis; City of Melbourne Arts Infrastructure Report, November (2016 ) 31
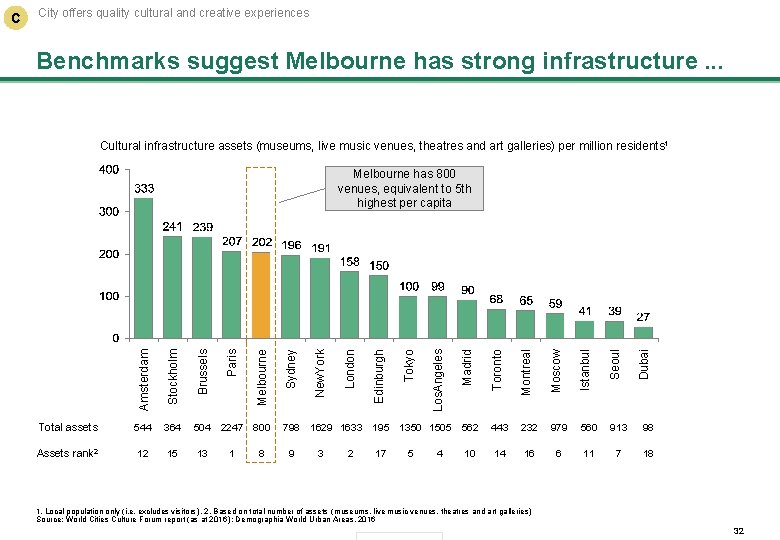
City offers quality cultural and creative experiences Benchmarks suggest Melbourne has strong infrastructure. . . Cultural infrastructure assets (museums, live music venues, theatres and art galleries) per million residents 1 1 8 9 3 2 17 5 4 562 443 232 979 560 913 98 10 14 16 6 11 7 18 Dubai 13 Seoul 15 1350 1505 Istanbul 12 195 Moscow Assets rank 2 1629 1633 Montreal 798 Toronto 800 Madrid 2247 Los. Angeles Sydney 504 Tokyo Melbourne 364 Edinburgh Paris 544 London Brussels Total assets New. York Stockholm Melbourne has 800 venues, equivalent to 5 th highest per capita Amsterdam C 1. Local population only (i. e. excludes visitors ). 2. Based on total number of assets (museums, live music venues, theatres and art galleries) Source: World Cities Culture Forum report (as at 2016 ); Demographia World Urban Areas, 2016 32
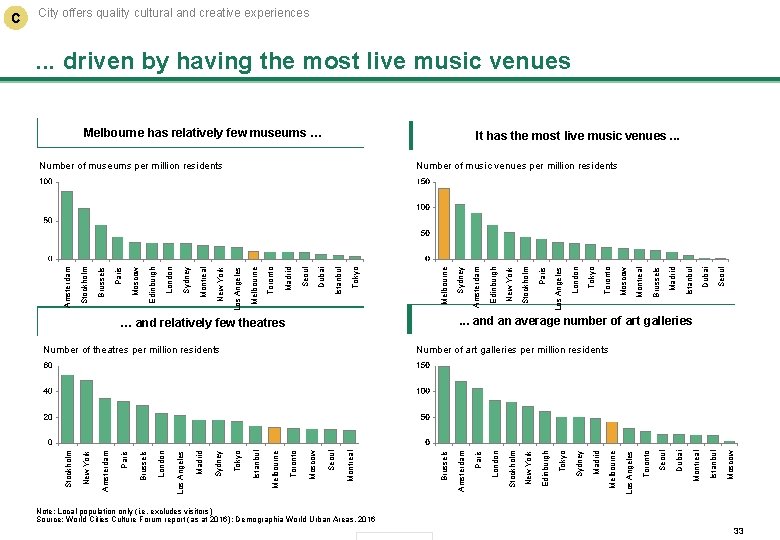
City offers quality cultural and creative experiences . . . driven by having the most live music venues Melbourne has relatively few museums … It has the most live music venues. . . Seoul Dubai Istanbul Madrid Brussels Montreal Moscow Toronto Tokyo London Los Angeles Paris Stockholm New York Edinburgh Moscow Istanbul Montreal Dubai Seoul Toronto Los Angeles Melbourne Madrid Sydney Tokyo Edinburgh New York Stockholm London Paris Amsterdam Brussels Montreal Seoul Moscow Toronto Melbourne Istanbul Number of art galleries per million residents Tokyo Sydney Madrid Los Angeles London Brussels Paris Number of theatres per million residents Amsterdam . . . and an average number of art galleries … and relatively few theatres New York Sydney Melbourne Tokyo Istanbul Dubai Seoul Madrid Toronto Melbourne Number of music venues per million residents Los Angeles New York Montreal Sydney London Edinburgh Moscow Paris Brussels Stockholm Amsterdam Number of museums per million residents Stockholm C Note: Local population only (i. e. excludes visitors) Source: World Cities Culture Forum report (as at 2016 ); Demographia World Urban Areas, 2016 33
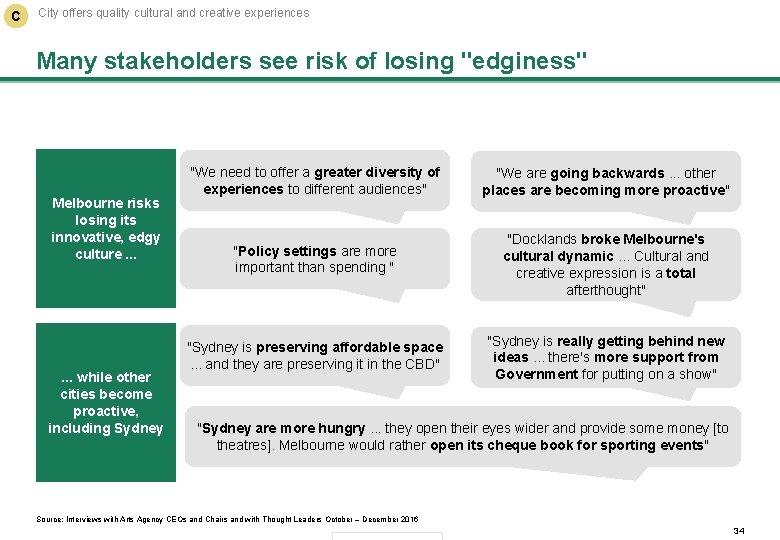
C City offers quality cultural and creative experiences Many stakeholders see risk of losing "edginess" Melbourne risks losing its innovative, edgy culture. . . while other cities become proactive, including Sydney "We need to offer a greater diversity of experiences to different audiences" "We are going backwards. . . other places are becoming more proactive" "Policy settings are more important than spending " "Docklands broke Melbourne's cultural dynamic. . . Cultural and creative expression is a total afterthought" "Sydney is preserving affordable space. . . and they are preserving it in the CBD" "Sydney is really getting behind new ideas. . . there's more support from Government for putting on a show" "Sydney are more hungry. . . they open their eyes wider and provide some money [to theatres]. Melbourne would rather open its cheque book for sporting events" Source: Interviews with Arts Agency CEOs and Chairs and with Thought Leaders October – December 2016 34
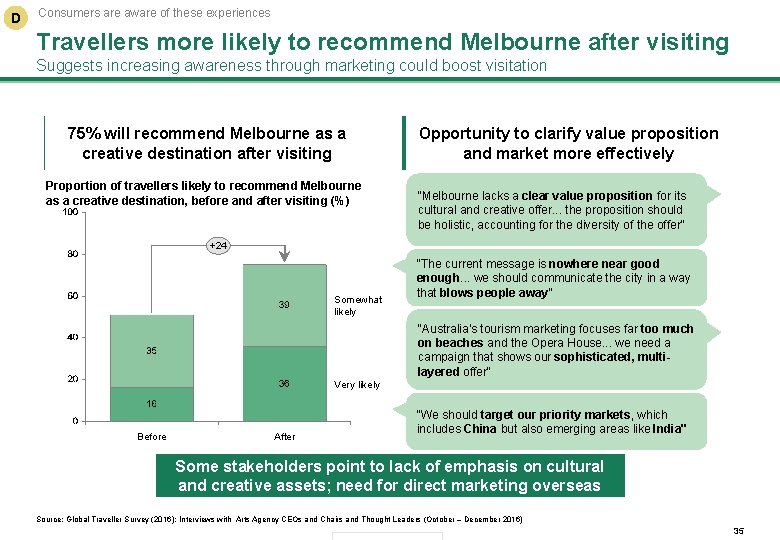
D Consumers are aware of these experiences Travellers more likely to recommend Melbourne after visiting Suggests increasing awareness through marketing could boost visitation 75% will recommend Melbourne as a creative destination after visiting Proportion of travellers likely to recommend Melbourne as a creative destination, before and after visiting (%) Opportunity to clarify value proposition and market more effectively "Melbourne lacks a clear value proposition for its cultural and creative offer. . . the proposition should be holistic, accounting for the diversity of the offer" +24 Somewhat likely "The current message is nowhere near good enough. . . we should communicate the city in a way that blows people away" "Australia's tourism marketing focuses far too much on beaches and the Opera House. . . we need a campaign that shows our sophisticated, multilayered offer" Very likely Before After "We should target our priority markets, which includes China but also emerging areas like India" Some stakeholders point to lack of emphasis on cultural and creative assets; need for direct marketing overseas Source: Global Traveller Survey (2016); Interviews with Arts Agency CEOs and Chairs and Thought Leaders (October – December 2016) 35
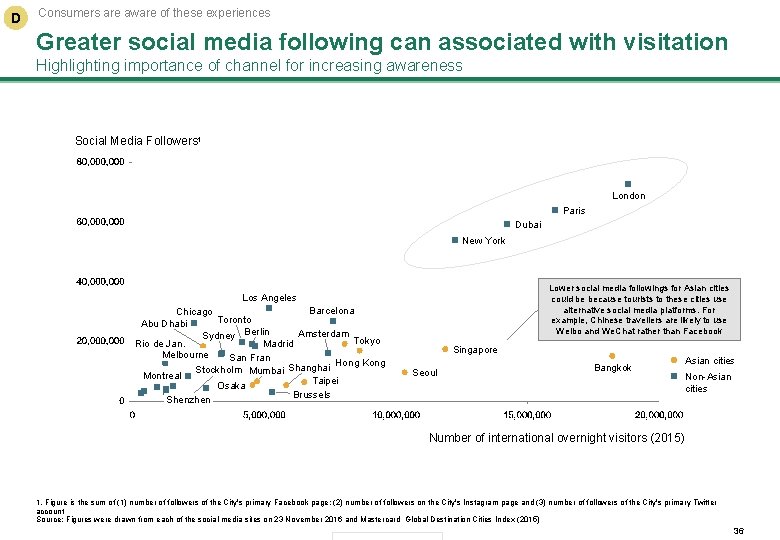
D Consumers are aware of these experiences Greater social media following can associated with visitation Highlighting importance of channel for increasing awareness Social Media Followers 1 London Paris Dubai New York Lower social media followings for Asian cities could be because tourists to these cities use alternative social media platforms. For example, Chinese travellers are likely to use Weibo and We. Chat rather than Facebook Los Angeles Barcelona Chicago Toronto Abu Dhabi Amsterdam Sydney Berlin Tokyo Madrid Rio de Jan. Melbourne San Fran Hong Kong Stockholm Mumbai Shanghai Montreal Taipei Osaka Brussels Shenzhen Singapore Seoul Bangkok Asian cities Non-Asian cities Number of international overnight visitors (2015) 1. Figure is the sum of (1) number of followers of the City's primary Facebook page; (2) number of followers on the City's Instagram page and (3) number of followers of the City's primary Twitter account Source: Figures were drawn from each of the social media sites on 23 November 2016 and Mastercard Global Destination Cities Index (2015) 36
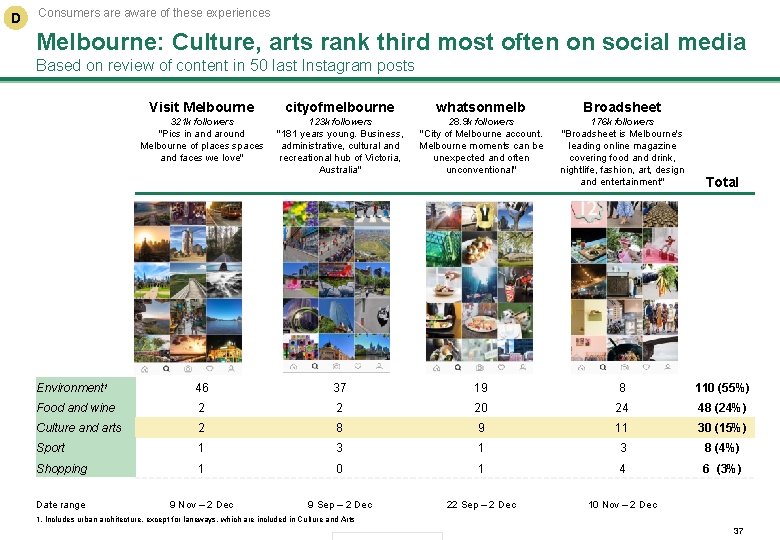
D Consumers are aware of these experiences Melbourne: Culture, arts rank third most often on social media Based on review of content in 50 last Instagram posts Visit Melbourne cityofmelbourne whatsonmelb Broadsheet 321 k followers "Pics in and around Melbourne of places spaces and faces we love" 123 k followers "181 years young. Business, administrative, cultural and recreational hub of Victoria, Australia" 28. 9 k followers "City of Melbourne account. Melbourne moments can be unexpected and often unconventional" 176 k followers "Broadsheet is Melbourne's leading online magazine covering food and drink, nightlife, fashion, art, design and entertainment" Total Environment 1 46 37 19 8 110 (55%) Food and wine 2 2 20 24 48 (24%) Culture and arts 2 8 9 11 30 (15%) Sport 1 3 1 3 8 (4%) Shopping 1 0 1 4 6 (3%) Date range 9 Nov – 2 Dec 9 Sep – 2 Dec 22 Sep – 2 Dec 10 Nov – 2 Dec 1. Includes urban architecture, except for laneways, which are included in Culture and Arts 37
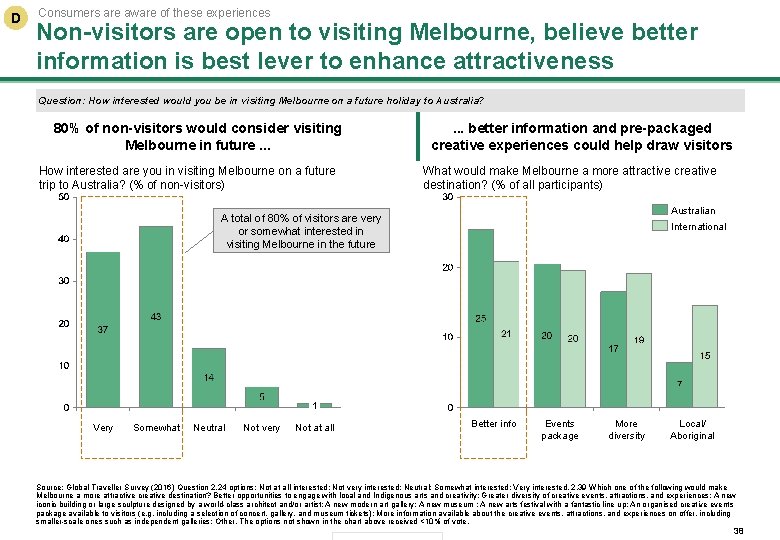
D Consumers are aware of these experiences Non-visitors are open to visiting Melbourne, believe better information is best lever to enhance attractiveness Question: How interested would you be in visiting Melbourne on a future holiday to Australia? 80% of non-visitors would consider visiting Melbourne in future. . . How interested are you in visiting Melbourne on a future trip to Australia? (% of non-visitors) . . . better information and pre-packaged creative experiences could help draw visitors What would make Melbourne a more attractive creative destination? (% of all participants) Australian A total of 80% of visitors are very or somewhat interested in visiting Melbourne in the future International 1 Very Somewhat Neutral Not very Not at all Better info Events package More diversity Local/ Aboriginal Source: Global Traveller Survey (2016) Question 2. 24 options: Not at all interested; Not very interested; Neutral; Somewhat interested; Very interested. 2. 39 Which one of the following would make Melbourne a more attractive creative destination? Better opportunities to engage with local and Indigenous arts and creativity; Greater diversity of creative events, attractions, and experiences; A new iconic building or large sculpture designed by a world-class architect and/or artist; A new modern art gallery; A new museum ; A new arts festival with a fantastic line up; An organised creative events package available to visitors (e. g. including a selection of concert, gallery, and museum tickets); More information available about the creative events, attractions, and experiences on offer, including smaller-scale ones such as independent galleries; Other. The options not shown in the chart above received <10% of vote. 38
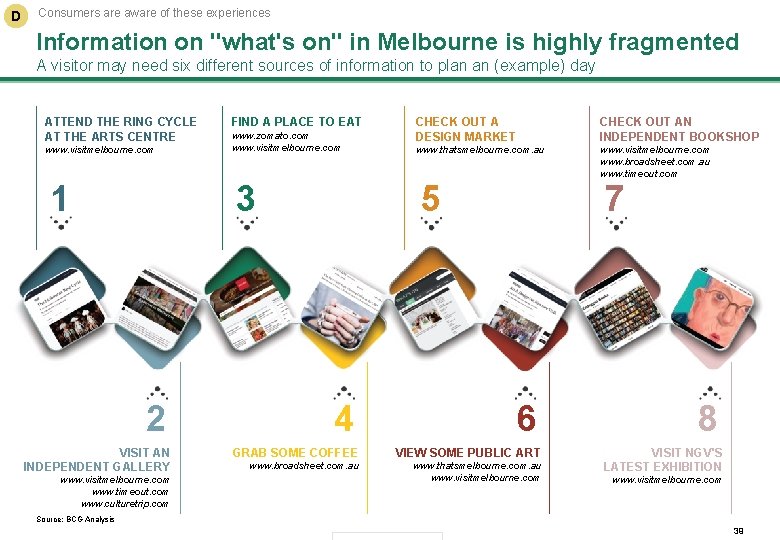
D Consumers are aware of these experiences Information on "what's on" in Melbourne is highly fragmented A visitor may need six different sources of information to plan an (example) day ATTEND THE RING CYCLE AT THE ARTS CENTRE www. visitmelbourne. com 1 FIND A PLACE TO EAT www. zomato. com www. visitmelbourne. com 3 2 VISIT AN INDEPENDENT GALLERY www. visitmelbourne. com www. timeout. com www. culturetrip. com CHECK OUT A DESIGN MARKET CHECK OUT AN INDEPENDENT BOOKSHOP www. thatsmelbourne. com. au www. visitmelbourne. com www. broadsheet. com. au www. timeout. com 5 4 7 6 GRAB SOME COFFEE VIEW SOME PUBLIC ART www. broadsheet. com. au www. thatsmelbourne. com. au www. visitmelbourne. com 8 VISIT NGV'S LATEST EXHIBITION www. visitmelbourne. com Source: BCG Analysis 39
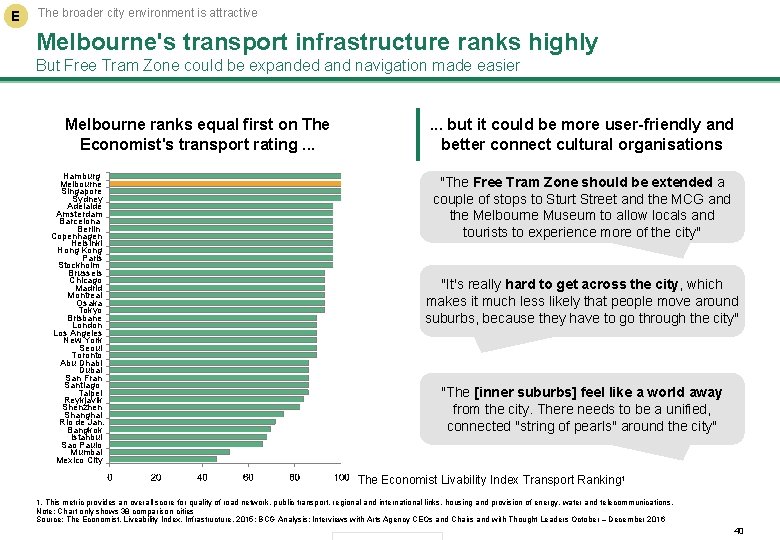
E The broader city environment is attractive Melbourne's transport infrastructure ranks highly But Free Tram Zone could be expanded and navigation made easier Melbourne ranks equal first on The Economist's transport rating. . . Hamburg Melbourne Singapore Sydney Adelaide Amsterdam Barcelona Berlin Copenhagen Helsinki Hong Kong Paris Stockholm Brussels Chicago Madrid Montreal Osaka Tokyo Brisbane London Los Angeles New York Seoul Toronto Abu Dhabi Dubai San Fran Santiago Taipei Reykjavik Shenzhen Shanghai Rio de Jan. Bangkok Istanbul Sao Paulo Mumbai Mexico City . . . but it could be more user-friendly and better connect cultural organisations "The Free Tram Zone should be extended a couple of stops to Sturt Street and the MCG and the Melbourne Museum to allow locals and tourists to experience more of the city" "It's really hard to get across the city, which makes it much less likely that people move around suburbs, because they have to go through the city" "The [inner suburbs] feel like a world away from the city. There needs to be a unified, connected "string of pearls" around the city" The Economist Livability Index Transport Ranking 1 1. This metric provides an overall score for quality of road network, public transport, regional and international links, housing and provision of energy, water and telecommunications. Note: Chart only shows 38 comparison cities Source: The Economist, Liveability Index, Infrastructure, 2015; BCG Analysis; Interviews with Arts Agency CEOs and Chairs and with Thought Leaders October – December 2016 40
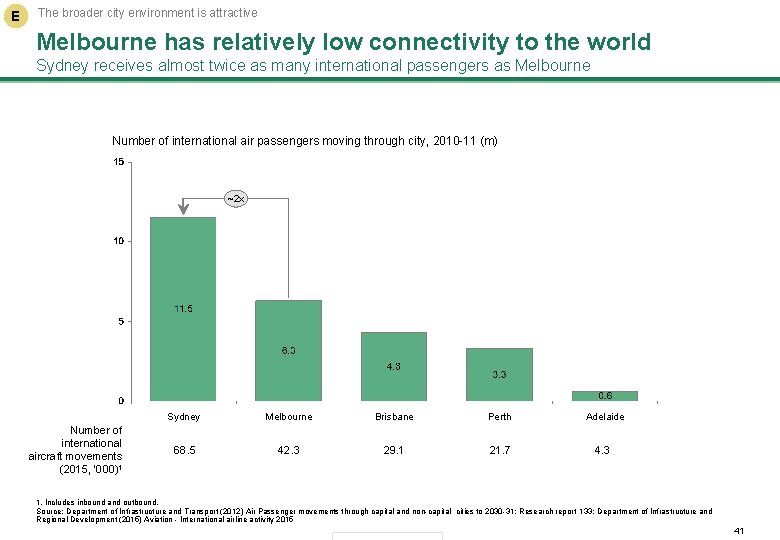
E The broader city environment is attractive Melbourne has relatively low connectivity to the world Sydney receives almost twice as many international passengers as Melbourne Number of international air passengers moving through city, 2010 -11 (m) ~2 x Number of international aircraft movements (2015, '000)1 Sydney Melbourne Brisbane Perth Adelaide 68. 5 42. 3 29. 1 21. 7 4. 3 1. Includes inbound and outbound. Source: Department of Infrastructure and Transport (2012) Air Passenger movements through capital and non-capital cities to 2030 -31: Research report 133; Department of Infrastructure and Regional Development (2015) Aviation - International airline activity 2015 41
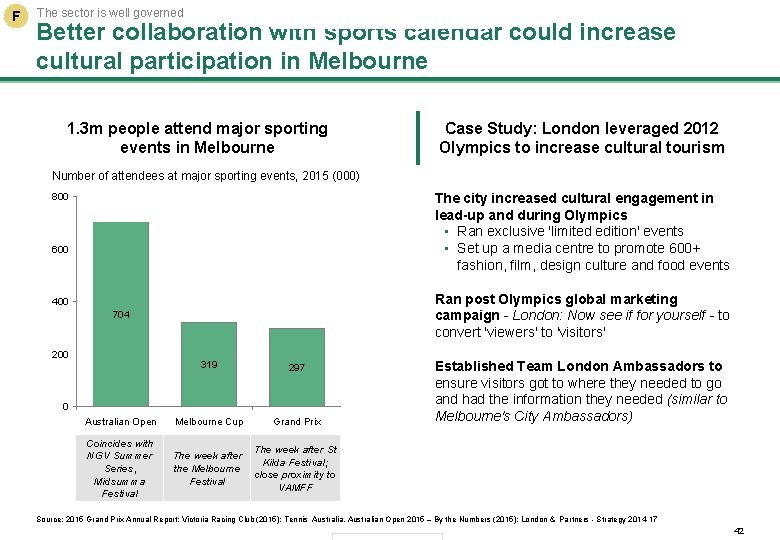
F The sector is well governed Better collaboration with sports calendar could increase cultural participation in Melbourne 1. 3 m people attend major sporting events in Melbourne Case Study: London leveraged 2012 Olympics to increase cultural tourism Number of attendees at major sporting events, 2015 (000) The city increased cultural engagement in lead-up and during Olympics • Ran exclusive 'limited edition' events • Set up a media centre to promote 600+ fashion, film, design culture and food events 800 600 Ran post Olympics global marketing campaign - London: Now see if for yourself - to convert 'viewers' to 'visitors' 400 704 200 319 297 Australian Open Melbourne Cup Grand Prix Coincides with NGV Summer Series, Midsumma Festival The week after the Melbourne Festival The week after St Kilda Festival; close proximity to VAMFF 0 Established Team London Ambassadors to ensure visitors got to where they needed to go and had the information they needed (similar to Melbourne's City Ambassadors) Source: 2015 Grand Prix Annual Report; Victoria Racing Club (2015); Tennis Australia, Australian Open 2015 – By the Numbers (2015); London & Partners - Strategy 2014 -17 42
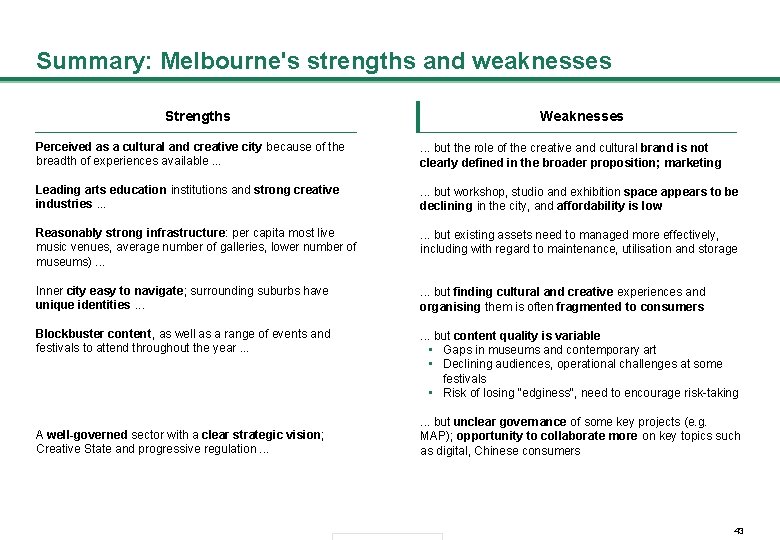
Summary: Melbourne's strengths and weaknesses Strengths Weaknesses Perceived as a cultural and creative city because of the breadth of experiences available. . . . but the role of the creative and cultural brand is not clearly defined in the broader proposition; marketing Leading arts education institutions and strong creative industries. . . . but workshop, studio and exhibition space appears to be declining in the city, and affordability is low Reasonably strong infrastructure: per capita most live music venues, average number of galleries, lower number of museums). . . . but existing assets need to managed more effectively, including with regard to maintenance, utilisation and storage Inner city easy to navigate; surrounding suburbs have unique identities. . . . but finding cultural and creative experiences and organising them is often fragmented to consumers Blockbuster content, as well as a range of events and festivals to attend throughout the year. . . . but content quality is variable • Gaps in museums and contemporary art • Declining audiences, operational challenges at some festivals • Risk of losing "edginess", need to encourage risk-taking A well-governed sector with a clear strategic vision; Creative State and progressive regulation. . . . but unclear governance of some key projects (e. g. MAP); opportunity to collaborate more on key topics such as digital, Chinese consumers 43
Agenda Executive Summary Context Performance Index Assessing Melbourne against best practice Cultural travellers and trends Strategic priorities Next steps 44
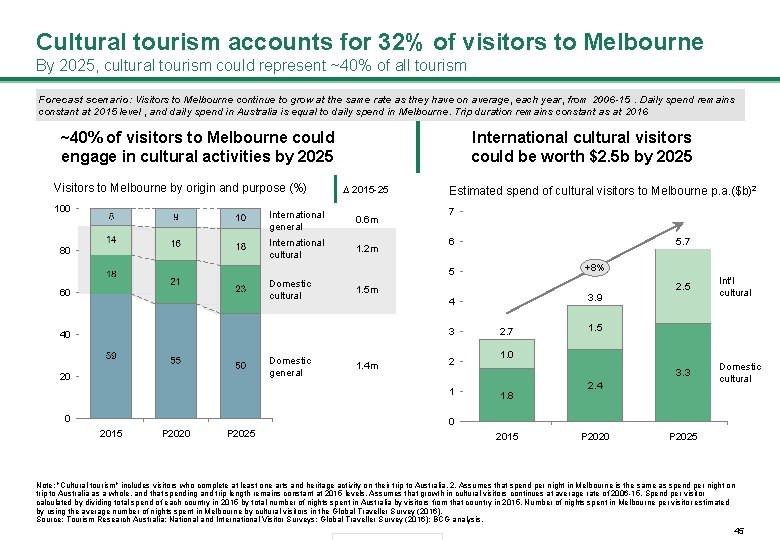
Cultural tourism accounts for 32% of visitors to Melbourne By 2025, cultural tourism could represent ~40% of all tourism Forecast scenario: Visitors to Melbourne continue to grow at the same rate as they have on average, each year, from 2006 -15. Daily spend remains constant at 2015 level , and daily spend in Australia is equal to daily spend in Melbourne. Trip duration remains constant as at 2016 ~40% of visitors to Melbourne could engage in cultural activities by 2025 Visitors to Melbourne by origin and purpose (%) 100 80 International cultural visitors could be worth $2. 5 b by 2025 ∆ 2015 -25 International general 0. 6 m International cultural 1. 2 m Estimated spend of cultural visitors to Melbourne p. a. ($b)2 7 5. 7 6 +8% 5 Domestic cultural 60 1. 5 m 3 40 Domestic general 20 1. 4 m 2 1 0 3. 9 4 2. 7 2. 5 Int'l cultural 3. 3 Domestic cultural 1. 5 1. 0 1. 8 2. 4 0 2015 P 2020 P 2025 Note: "Cultural tourism" includes visitors who complete at least one arts and heritage activity on their trip to Australia. 2. Assumes that spend per night in Melbourne is the same as spend per night on trip to Australia as a whole, and that spending and trip length remains constant at 2015 levels. Assumes that growth in cultural visitors continues at average rate of 2006 -15. Spend per visitor calculated by dividing total spend of each country in 2015 by total number of nights spent in Australia by visitors from that country in 2015. Number of nights spent in Melbourne per visitor estimated by using the average number of nights spent in Melbourne by cultural visitors in the Global Traveller Survey (2016). Source: Tourism Research Australia: National and International Visitor Surveys; Global Traveller Survey (2016); BCG analysis. 45
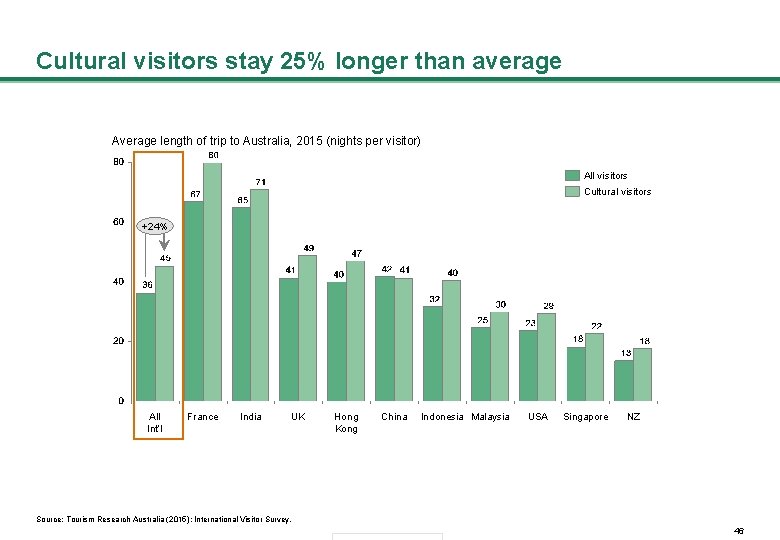
Cultural visitors stay 25% longer than average Average length of trip to Australia, 2015 (nights per visitor) All visitors Cultural visitors +24% All Int’l France India UK Hong Kong China Indonesia Malaysia USA Singapore NZ Source: Tourism Research Australia (2015): International Visitor Survey. 46
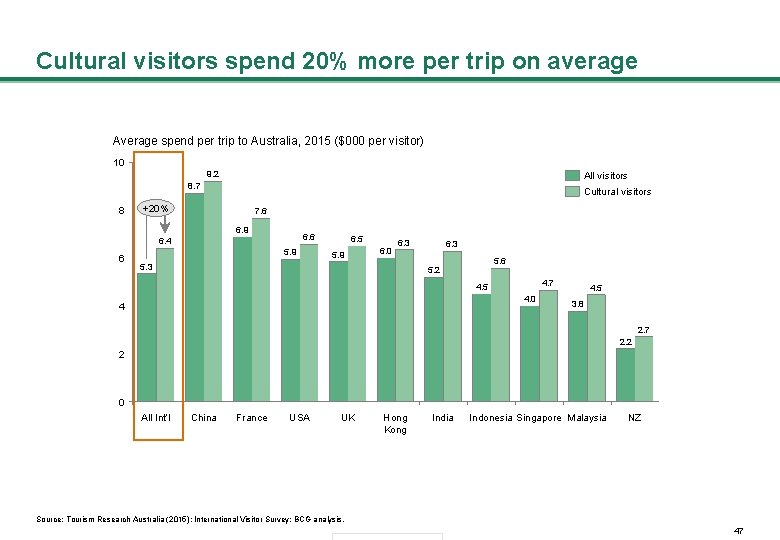
Cultural visitors spend 20% more per trip on average Average spend per trip to Australia, 2015 ($000 per visitor) 10 9. 2 All visitors 8. 7 8 Cultural visitors +20% 7. 6 6. 9 6. 6 6. 4 6 5. 9 6. 5 5. 9 6. 0 6. 3 5. 3 6. 3 5. 6 5. 2 4. 7 4. 5 4. 0 4 4. 5 3. 8 2. 7 2. 2 2 0 All Int’l China France USA UK Hong Kong India Indonesia Singapore Malaysia NZ Source: Tourism Research Australia (2015): International Visitor Survey; BCG analysis. 47
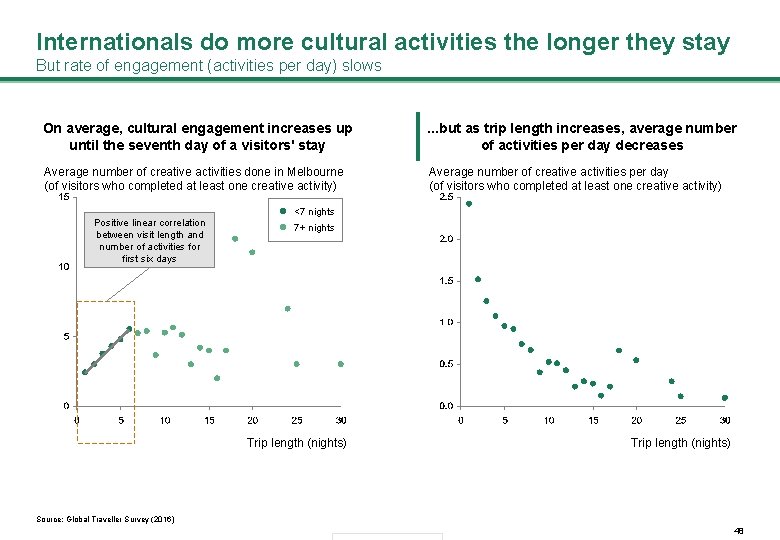
Internationals do more cultural activities the longer they stay But rate of engagement (activities per day) slows On average, cultural engagement increases up until the seventh day of a visitors' stay . . . but as trip length increases, average number of activities per day decreases Average number of creative activities done in Melbourne (of visitors who completed at least one creative activity) Average number of creative activities per day (of visitors who completed at least one creative activity) Positive linear correlation between visit length and number of activities for first six days <7 nights 7+ nights Trip length (nights) Source: Global Traveller Survey (2016) 48
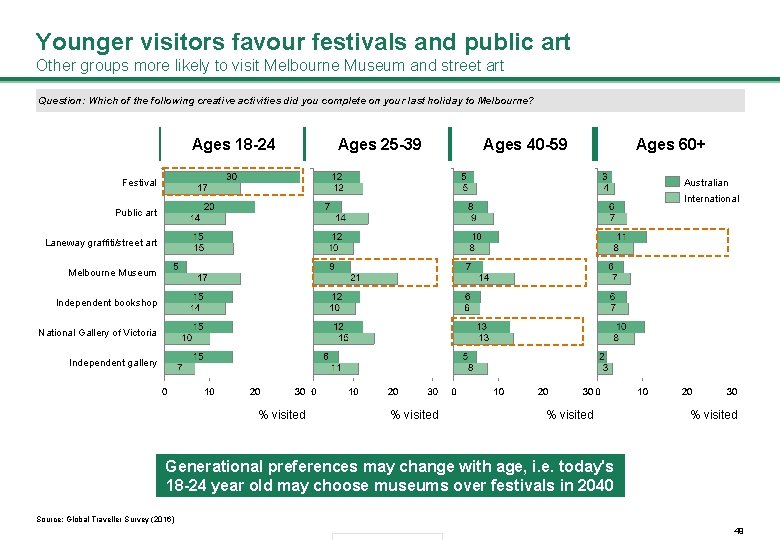
Younger visitors favour festivals and public art Other groups more likely to visit Melbourne Museum and street art Question: Which of the following creative activities did you complete on your last holiday to Melbourne? Ages 18 -24 Ages 25 -39 Ages 40 -59 Ages 60+ Australian Festival International Public art Laneway graffiti/street art Melbourne Museum Independent bookshop National Gallery of Victoria Independent gallery % visited Generational preferences may change with age, i. e. today's 18 -24 year old may choose museums over festivals in 2040 Source: Global Traveller Survey (2016) 49
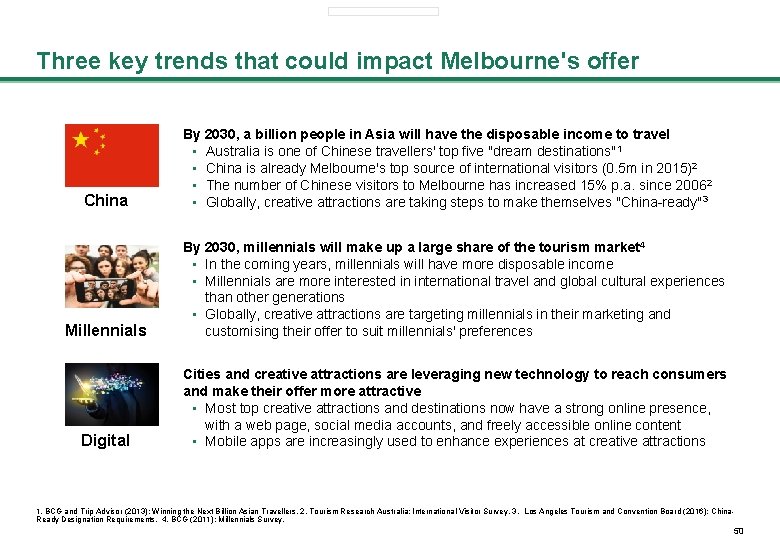
Three key trends that could impact Melbourne's offer China By 2030, a billion people in Asia will have the disposable income to travel • Australia is one of Chinese travellers' top five "dream destinations"1 • China is already Melbourne's top source of international visitors (0. 5 m in 2015)2 • The number of Chinese visitors to Melbourne has increased 15% p. a. since 20062 • Globally, creative attractions are taking steps to make themselves "China-ready"3 Millennials By 2030, millennials will make up a large share of the tourism market 4 • In the coming years, millennials will have more disposable income • Millennials are more interested in international travel and global cultural experiences than other generations • Globally, creative attractions are targeting millennials in their marketing and customising their offer to suit millennials' preferences Digital Cities and creative attractions are leveraging new technology to reach consumers and make their offer more attractive • Most top creative attractions and destinations now have a strong online presence, with a web page, social media accounts, and freely accessible online content • Mobile apps are increasingly used to enhance experiences at creative attractions 1. BCG and Trip Advisor (2013): Winning the Next Billion Asian Travellers. 2. Tourism Research Australia: International Visitor Survey. 3. Los Angeles Tourism and Convention Board (2016): China. Ready Designation Requirements. 4. BCG (2011): Millennials Survey. 50
Agenda Executive Summary Context Performance Index Assessing Melbourne against best practice Cultural travellers and trends Strategic priorities Next steps 51
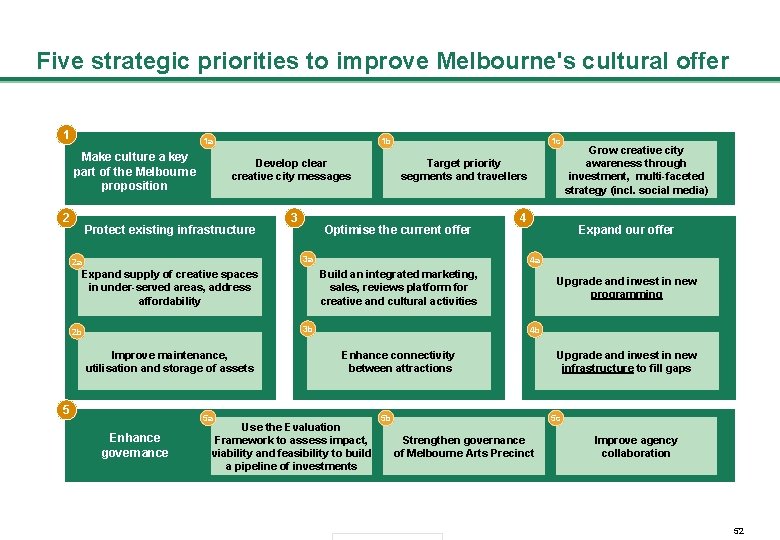
Five strategic priorities to improve Melbourne's cultural offer 1 1 a Make culture a key part of the Melbourne proposition 2 1 b Develop clear creative city messages Protect existing infrastructure 3 1 c Target priority segments and travellers Optimise the current offer 3 a 2 a Expand supply of creative spaces in under-served areas, address affordability Improve maintenance, utilisation and storage of assets 5 5 a Enhance governance Expand our offer 4 a Build an integrated marketing, sales, reviews platform for creative and cultural activities 3 b 2 b 4 Grow creative city awareness through investment, multi-faceted strategy (incl. social media) Upgrade and invest in new programming 4 b Enhance connectivity between attractions Use the Evaluation Framework to assess impact, viability and feasibility to build a pipeline of investments 5 b Upgrade and invest in new infrastructure to fill gaps 5 c Strengthen governance of Melbourne Arts Precinct Improve agency collaboration 52
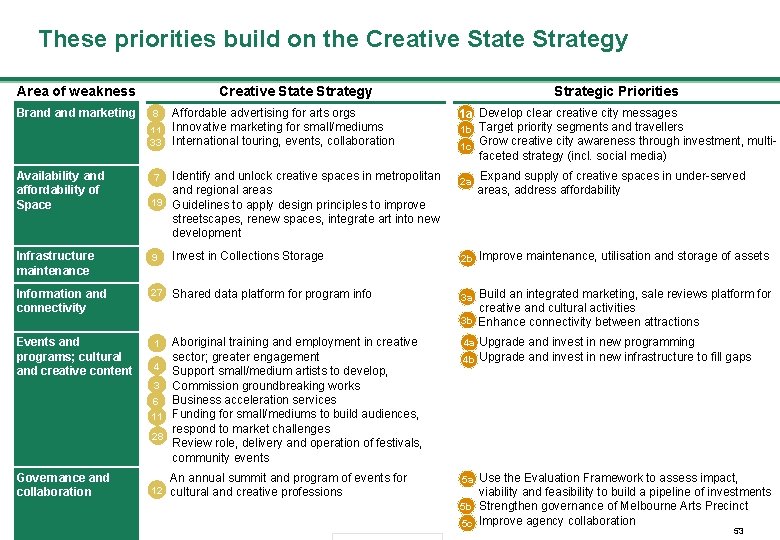
These priorities build on the Creative State Strategy Area of weakness Creative State Strategy Brand marketing 8 • Affordable advertising for arts orgs 11 • Innovative marketing for small/mediums 33 • International touring, events, collaboration Availability and affordability of Space 7 • Identify and unlock creative spaces in metropolitan and regional areas 19 • Guidelines to apply design principles to improve Strategic Priorities 1 a • Develop clear creative city messages • Target priority segments and travellers 1 b • Grow creative city awareness through investment, multi 1 c faceted strategy (incl. social media) 2 a Expand supply of creative spaces in under-served areas, address affordability streetscapes, renew spaces, integrate art into new development Infrastructure maintenance 9 • Invest in Collections Storage • Improve maintenance, utilisation and storage of assets 2 b Information and connectivity 27 • Shared data platform for program info • Build an integrated marketing, sale reviews platform for 3 a Events and programs; cultural and creative content 1 • Aboriginal training and employment in creative • Upgrade and invest in new programming 4 a sector; greater engagement Support small/medium artists to develop, Commission groundbreaking works Business acceleration services Funding for small/mediums to build audiences, respond to market challenges 28 • Review role, delivery and operation of festivals, community events • Upgrade and invest in new infrastructure to fill gaps 4 b Governance and collaboration creative and cultural activities 3 b Enhance connectivity between attractions 4 • 3 • 6 • 11 • An annual summit and program of events for 12 cultural and creative professions • Use the Evaluation Framework to assess impact, 5 a viability and feasibility to build a pipeline of investments 5 b • Strengthen governance of Melbourne Arts Precinct • Improve agency collaboration 5 c 53
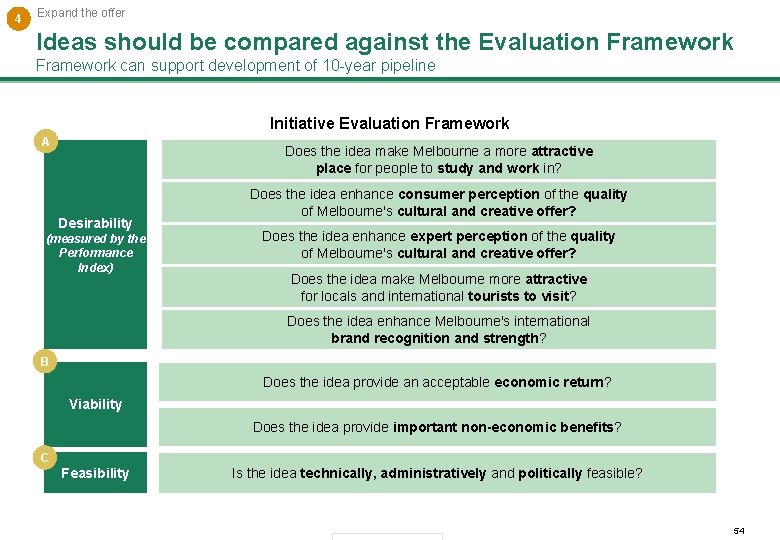
4 Expand the offer Ideas should be compared against the Evaluation Framework can support development of 10 -year pipeline Initiative Evaluation Framework A Does the idea make Melbourne a more attractive place for people to study and work in? Desirability (measured by the Performance Index) Does the idea enhance consumer perception of the quality of Melbourne's cultural and creative offer? Does the idea enhance expert perception of the quality of Melbourne's cultural and creative offer? Does the idea make Melbourne more attractive for locals and international tourists to visit? Does the idea enhance Melbourne's international brand recognition and strength? B Does the idea provide an acceptable economic return? Viability Does the idea provide important non-economic benefits? C Feasibility Is the idea technically, administratively and politically feasible? 54
Disclaimer The services and materials provided by The Boston Consulting Group (BCG) are subject to BCG's Standard Terms (a copy of which is available upon request) or such other agreement as may have been previously executed by BCG does not provide legal, accounting, or tax advice. The Client is responsible for obtaining independent advice concerning these matters. This advice may affect the guidance given by BCG. Further, BCG has made no undertaking to update these materials after the date hereof, notwithstanding that such information may become outdated or inaccurate. The materials contained in this presentation are designed for the sole use by the board of directors or senior management of the Client and solely for the limited purposes described in the presentation. The materials shall not be copied or given to any person or entity other than the Client ("Third Party") without the prior written consent of BCG. These materials serve only as the focus for discussion; they are incomplete without the accompanying oral commentary and may not be relied on as a stand-alone document. Further, Third Parties may not, and it is unreasonable for any Third Party to, rely on these materials for any purpose whatsoever. To the fullest extent permitted by law (and except to the extent otherwise agreed in a signed writing by BCG), BCG shall have no liability whatsoever to any Third Party, and any Third Party hereby waives any rights and claims it may have at any time against BCG with regard to the services, this presentation, or other materials, including the accuracy or completeness thereof. Receipt and review of this document shall be deemed agreement with and consideration for the foregoing. BCG does not provide fairness opinions or valuations of market transactions, and these materials should not be relied on or construed as such. Further, the financial evaluations, projected market and financial information, and conclusions contained in these materials are based upon standard valuation methodologies, are not definitive forecasts, and are not guaranteed by BCG has used public and/or confidential data and assumptions provided to BCG by the Client. BCG has not independently verified the data and assumptions used in these analyses. Changes in the underlying data or operating assumptions will clearly impact the analyses and conclusions. 55
Thank you bcg. com | bcgperspectives. com
- Slides: 56