SCIENCE 1206 Unit 3 Physical Science Motion Required

You will need a ruler 2) Bring a calculator to")


. • Most")


 QUALITATIVE DESCRIPTIONS • are descriptions made")


 125 cm => m b)")


 = ? seconds")
 120 sec => min")

 360 m/s => km/hr b)")


 4. 5 cm")


: • There at least two reasons for being familiar with")
 helpful for indicating how many significant figures are present in a")


 PROPORTIONALITY –occurs when a change in the independent variable causes an inverse")


Speed of the ball")


.")
 is a scalar quantity which refers to \"how much")


![Student Questions: 1. A car travels 10 km [North] then turns and goes 8](https://slidetodoc.com/presentation_image_h2/fb746aaa8d2afca1b800b5df3ec518d7/image-107.jpg "Student Questions: 1. A car travels 10 km [North] then turns and goes 8")


 and (b) are very easy to do. The hunter walked a")

 30. 0 km West Ɵ 40. 0 km South Right triangle so we")


 near the top")


")


- Slides: 167
SCIENCE 1206 Unit 3 Physical Science – Motion
Required items for Physics 1)You will need a ruler 2) Bring a calculator to every Class 3) Graphing paper
What is Physics? • Physics is the study of motion, matter, energy, and force. Called the Fundamental Science
Famous Physicist • Galileo Galilei • Stephen Hawkings Sir Isaac Newton • Albert Einstein
If I have seen farther than others, it is because I was standing on the shoulders of giants. ” Sir Isaac Newton
Why Study Physics? • Most modern technology came from physics (blackberry, internet). • Most branches of sciences us principles obtained from physics. electricity, magnetism, optics. • Physics classes hone thinking skills. • The job market for people with skills in physics is strong. • To understand how things work • Because Einstein says so? ?
Career Branches in Physics • • Research Education Engineering Medicine Meteorology Geosciences roller coaster designers etc.
Science 1206 Section 1: • Units, Measurements and Error
Qualitative and Quantitative Descriptions (p. 679 – 680) QUALITATIVE DESCRIPTIONS • are descriptions made by observing with the 5 senses, such as the smell or colour. They include observations which cannot be measured. This bird has a large wingspan
QUANTITATIVE DESCRIPTIONS • are descriptions that are based on measurements or counting (i. e. they are numerical. They deal with quantities. This bird has a wingspan of two meters.
SI MEASURMENTS • Scientists all over the world have agreed on a single measurement system called Le Système International d’Unités, abbreviated SI
BASE AND DERIVED UNITS-p. 689 • Base units are units that are defined.
Derived units are ones that we “figure out” by using base units. example: The length and width of a rectangle Area = length x width =m x m = m 2 =(base unit) x (base unit) = ( Derived unit)
Converting measurements is a skill that will be tested in high school math and science classes, as well as in some college classes The Step Stair Method is a simple trick to converting these units. Larger unit as you go up the steps! Divide by a power of ten 10 Smaller unit as you go down the steps! Multiple by a power of ten 10
You Try! • • Convert the following measurements: a) 125 cm => m b) 2234 m => km c) 23 mm => cm d) 45 g => kg e) 300 ml => kl f) 1 200 000 mm => km Do Metric Conversion sheet
• Converting units really just involves multiplying and dividing. • Example • However to convert units sometimes, we need to multiply the quantity we want to convert by a conversion factor. The conversion factor basically tells us how to convert one unit into another.
Example 1 • 12 feet = ? meters • Note : 1 feet = 0. 3048 meters • therefore:
Example 2 • 7 a ( years) = ? seconds
You Try! • • • Convert the following measurements: a) 120 sec => min b)2. 5 hours => sec c)3. 5 years => hours d)183 min => hours e) 1. 5 years => sec
Example 3: General Rule: To change from km/hr = m/s ÷ 3. 6 To change from m/s to km/hr x 3. 6
You Try! • • Convert the following measurements: a) 360 m/s => km/hr b) 50 km/hr => m/s c) 23 cm/s => m/s d) 0. 0012 km/s => km/hr e) 300 ml => kl f) 1 200 000 mm => km
ACCURACY AND PRECISION • Accuracy refers to the closeness of measurements to is how close a measured value is to the actual (true ) value. • Precision is how close the measured values are to each other. true) value.
• So, if you are playing soccer and you always hit the left goal post instead of scoring, then you are not accurate, but you are precise
Which ruler is more precise? Pencil A: Pencil B The smaller the unit you use to measure with, the more precise the measurement is.
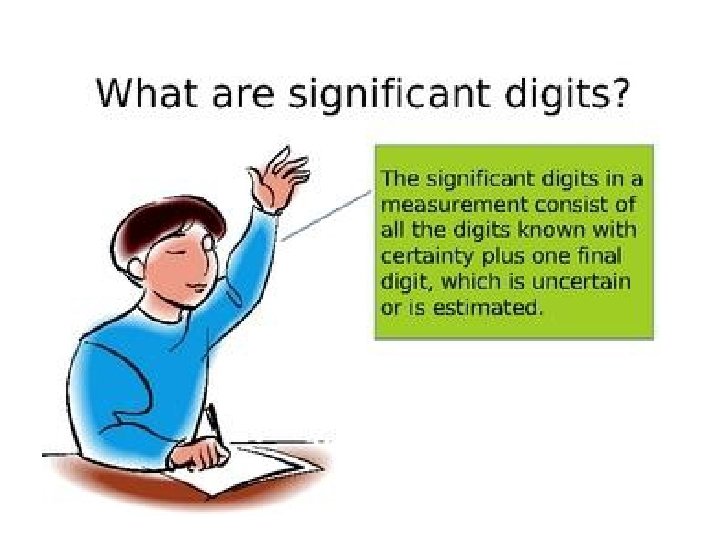
MEASUREMENTS AND SIGNIFICANT DIGITS p. 344 -349 What is the measurement of the Stick? • The # of significant digits in a value includes all digits that are certain and one that is uncertain Therefore significant digits are digits that are statistically significant
Learning Check What is the length of the wooden stick? 1) 4. 5 cm 2) 4. 54 cm 3) 4. 547 cm
What Time is it? • Someone might say “ 1: 30” or “ 1: 28” or “ 1: 27: 55” • Each is appropriate for a different situation • In science we describe a value as having a certain number of “significant digits” • “ 1: 30” likely has 2, 1: 28 has 3, 1: 27: 55 has 5 • There are rules that dictate the # of significant digits in a value
Rules for Determining the Number of Significant Digits : • 1. All non-zero digits (1 -9) are to be counted as significant. • Ex. 517, 51. 7 and 5. 17 all have 3 sig figs • 2. For any decimal number, any zero that appears after the last non-zero digit( or between 2 nonzero digits) are significant. Ex. 0. 05057 , 5057 and 56. 50 all have 4 sig figs •
3. For a whole numbers, only zeros between two non -zero digits are significant Ex, 470, 4700 all have 2 sig fig
EXAMPLE • All digits count 45. 8736 6 . 000239 3 • Leading 0’s don’t . 00023900 5 • Trailing 0’s do 48000. 5 • 0’s count in decimal form 48000 2 • 0’s don’t count w/o decimal 3. 980 4 • All digits count 6 • 0’s between digits count as well as trailing in decimal form 1. 00040
How many Significant Figures? 1. 2. 3. 4. 5. 6. 7. 8. 9. 10. 2. 83 36. 77 14. 0 0. 0033 0. 02 0. 2410 2. 350 1. 00009 3. 0. 0056040
ROUNDING • Often when doing arithmetic on a pocket calculator, the answer is displayed with more significant figures than are really justified. How do you decide how many digits to keep?
Rules to be used in Rounding #1. If the leftmost digit is 5 or greater, add 1 to the last digit to be kept and drop all other digits farther to the right. Ex: Rounding 1. 2151 to 3 significant figures gives 1. 22 #2. If the digit is less than 5, simply drop it and all digits farther to the right. Ex: Rounding 1. 2143 to 3 significant figures gives 1. 21
THE GOLDEN RULE • • IF THE DIGIT IS 5 OR MORE ROUND UP IF THE DIGIT IS LESS THAN 5 ROUND DOWN
EXAMPLE 1 • Make the following into a 3 Sig Fig number 1. 5587. 0037421 1367 128, 522 1. 6683 X 106 Your Final number must be of the same value as the number you started with, 129, 000 and not 129
EXAMPLE 2 • For example you want a 4 Sig Fig number • 4965. 03 0 is dropped, it is <5 • 780, 582 8 is dropped, it is >5; Note you must include the 0’s • 1999. 5 5 is dropped it is = 5; note you need a 4 Sig Fig
ADDING OR SUBTRACTING SIGNIFICANT FIGURES • Rule: When adding or subtracting sig fig, the answer should have the same number of decimal places as the smallest number of decimal places in the numbers that were added or subtracted. Answer is 641. 63
ADDITION/SUBTRACTION • 25. 5 +34. 270 59. 770 59. 8 32. 72 - 0. 0049 32. 7151 32. 7 320 + 12. 5 330
ADDITION AND SUBTRATION • • . 56 +. 153 = 82000 + 5. 32 = 10. 0 - 9. 8742 = 10 – 9. 8742 = Look for the last important digit
MULTIPLYING OR DIVIDING SIGNIFICANT FIGURES • When multiplying and dividing sig, fig. the answer will contain the same number of digits as in the original number with the least number of digits
32. 27 x 1. 54 = 3. 68 /. 07925 = 1. 750 x. 0342000 =
Mixed Order of Operation 8. 52 + 4. 1586 x 18. 73 + 153. 2 = = 8. 52 + 77. 89 + 153. 2 = 239. 61 = 239. 6 (8. 52 + 4. 1586) x (18. 73 + 153. 2) = = 12. 68 x 171. 9 = 2179. 692 = 2180.
Using Scientific Notation (Page): • There at least two reasons for being familiar with scientific notation. 1) Method of writing numbers that are very big and very small. It works like this: • a big number Speed of light => 300, 000 m/s = 3. 0 x 108 • a small number Charge on an electron => 0. 0000000001602 C => 1. 602 x 10 -19
• 2) helpful for indicating how many significant figures are present in a number 100 cm as 1. 00 x 102 ( 3 sig fig )cm 1. 0 x 102 ( 2 sig fig )cm 1 x 10² ( 1 sig fig )cm
Scientific notation • Read “Scientific Notation” on page 621 Worksheet significant digits and rounding
Sources of Error • no measurement is exact; any scientific investigation will involve error. 1. Random error (uncertainty) • an error that relates to reading a measuring device • Ex. a person measuring the length of an object using a ruler must estimate the last digit; another person may not estimate to the same digit • Can be reduced by taking many measurements and then averaging them (and having the same person take the measurement each time)
2. Systematic error • An error due to the use of an incorrectly calibrated measuring device. • Ex. a clock that runs slow or a ruler with a rounded end • Can be reduced by inspecting and recalibrating equipment regularly.
3. Parallax • The change in relative position of an object with a change in the viewing angle • Ex. Stretch out your arm and close your right eye and “hide” something behind your index finger. Now, switch eyes while maintaining your finger position. The background shifts; this is parallax.
How to Reduce Parallax: #1. All readings should be taken looking in a perpendicular line that joins the eye, the needle and the scale Ex: speedometer #2. Minimize the distance between the scale and the object being measured Ex: place meter stick on its edge, not flat
Error and Discrepancy • ERROR: • Refers to the uncertainty in a measurement. Ex: using a meter stick • 1. 56 m ± 0. 05 m lies between 1. 51 m and 1. 61 m • 6. 4 m ± 0. 1 m, means that the reading lies between 6. 3 m and 6. 5 m
Discrepancy • The difference between the value determined by your experimental procedure and the generally accepted value Example: A student measures the acceleration due to gravity and finds it to be 9. 72 m/s 2. If the accepted value is 9. 81 m/s 2, what is the percent discrepancy.
Activity • Extra Read Text P. 5 • Text Practice Problems: • Worksheet unit conversions and stuff.
Science 1206 • Section 2: PHYSICAL & MATHEMATICAL RELATIONSHIPS
Independent and dependent Variables, Page 672 INDEPENDENT VARIABLE • is the one whose values the experimenter chooses. (Often in nice, even intervals) • Ex: time • is always plotted on the x-axis • Also called the manipulated variable
• DEPENDENT VARIABLE • is the one which responds to changes in the independent variable. Also called the responding variable Ex: distance • is always plotted on the y-axis • Graphing Experimental Results, Page 700 • Example: A Running White-Tailed Deer, page 362
Example: A Running White-Tailed Deer, page 362 Table 1, Page 362
Step #1: Prepare the Grid for your Graph • On graph paper, construct a grid for your graph. The horizontal bottom edge is the x-axis and the vertical edge on the left is called the y-axis. • Be sure to use the majority of your sheet of paper. DO NOT try to fit the graph into one corner of the paper!
Step #2: Choose the Axes • Recall that the independent variable is plotted on the x-axis and the dependent variable is plotted on the y-axis. • Time is USUALLY plotted on the x-axis. • When labelling the axes, remember to include the correct unit for each measurement.
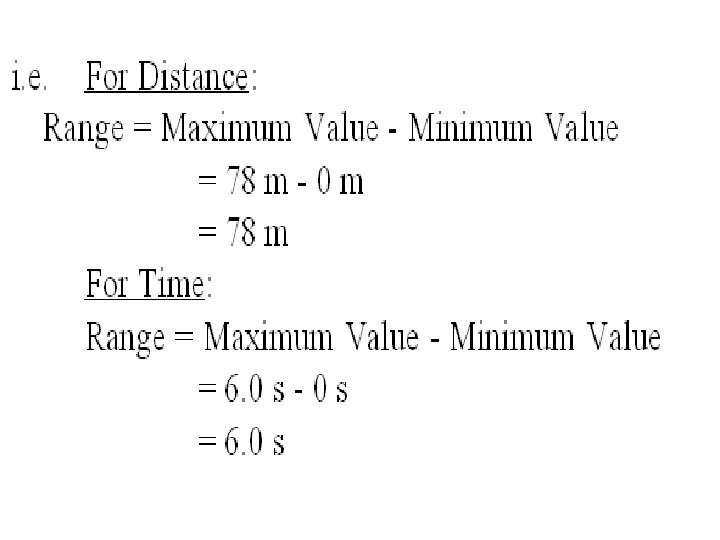
Step #3: Determine the Range of Values • For each variable in the table, find the difference between the largest value and the smallest valuethis is the range.
Step #4: Choose a Scale for Each Axis • The scale you choose depends on the range of values, and the amount of space you have. • Each line on the grid usually increases by equal divisions. Leave a little extra space to avoid “crowdedness” • i. e. For the x-axis: Each line equals 1 second • For the y-axis: Each line equals 10 m
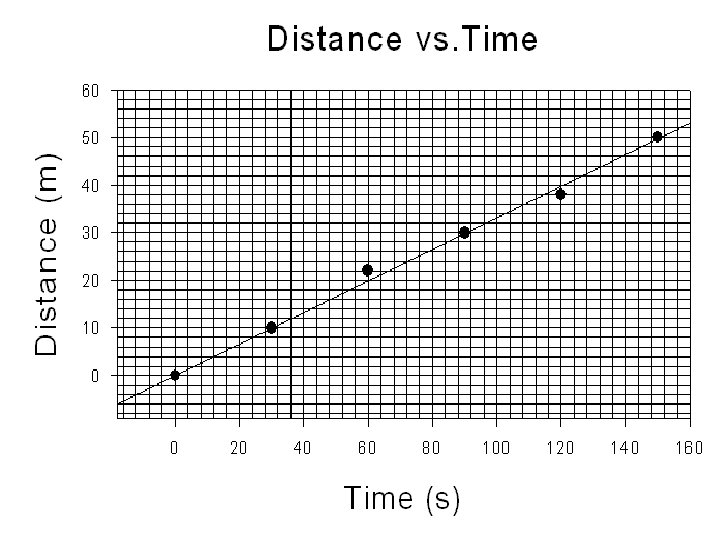
Step #5: Plot the Points • Start with the first pair of values from the data table, in this case 0 s and 0 m. • Place the point where the line starting at 0 s on the x-axis meets the line starting at 0 m on the y-axis. Continue this for all points in the table.
Step #6: Draw a Line through your Data Points and Title your Graph • If possible, draw a straight line through your data which lies closest to the most points- DO NOT connect the dots. –This line which passes through the majority of the points on a graph is called the line of best fit. –The title of your graph should be meaningful, and i. e. NOT distance versus time, UNLESS no other information is given about the data being graphed.
Ex: Plot the following data using proper graphing techniques:
Activity • Extra Read Text P. 5 • Text Practice Problems: • Worksheet Graphing Uniform Motion • Worksheet eps#3 graphing
INTERPOLATION • finding values between measured points • Ex: What is the distance travelled at 3. 5 s?
EXTRAPOLATION • finding values beyond measured points by extending the graph using a dotted line. • Ex: What is the distance travelled at 9. 0 s?
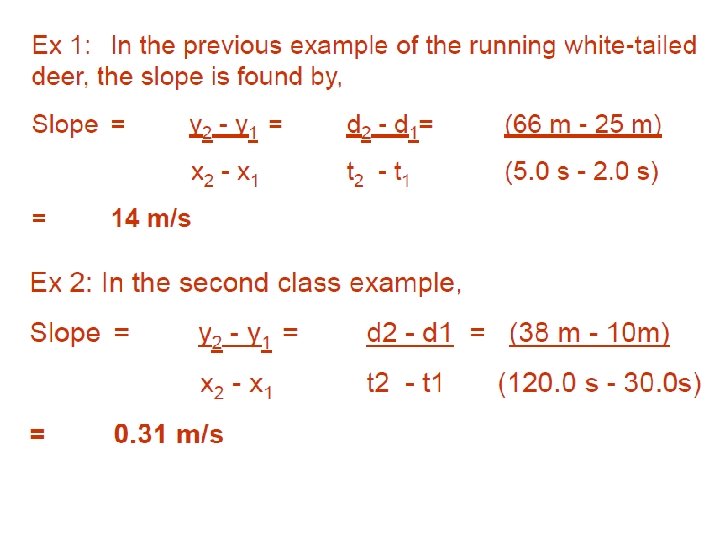
Distance-Time Graphs, p. 363 -364 • The slope of a graph represents a mathematical relationship between the variables, and can be calculated by • The values of x and y can be determined using any 2 points along the straight line graph.
Types of Relationships • 1. DIRECT PROPORTIONALITY • occurs when a change in the independent variable causes a corresponding change in the dependent variable, as in the case of the straight line graph • written mathematically as y α x • spoken as “ y is directly proportional to x”
Example • In the example above, d increases as t increases.
INVERSE (INDIRECT) PROPORTIONALITY –occurs when a change in the independent variable causes an inverse (or reciprocal) change in the dependent variable. –written mathematically as y α 1 /x
Examples • In Example A, rate decreases as time increases at a constant rate • In Example B, rate decreases as time increases at a non-constant
Writing an Equation for 2 Quantities Related by a Straight Line Graph • When a line of best fit is a straight line, there is a simple relationship between the two variables. This relationship can be represented by a general mathematical equation: • y = mx + b • where – y is the dependent variable = DISTANCE – x is the independent variable = TIME – m is the slope (steepness) of the line – b is the y-intercept (i. e. where the graph crosses the yaxis) - AT POINT (0, 0)
Science 1206 • Section 3: • Speed
Introduction • Motion is a common theme in our everyday lives: birds fly, babies crawl, and we, run, drive, and walk. • Kinematics is the study of how o objects move.
• Recall: Slope can be calculated using the formula m/s is the unit for SPEED (v). The SLOPE OF A d-t GRAPH IS SPEED (v)!
INSTANTANEOUS SPEED • the speed at which an object is moving at a particular moment in time • it is NOT affected by the object’s previous speed, or how long it has been moving. • For any object moving at a constant speed, the instantaneous speed is the same at any time, and equals the constant speed.
Example A: In Example A, recall that the slope of the d-t graph represents speed. Since the slope is the same no matter what points are chosen, the object is moving at a CONSTANT speed, thus the instantaneous speed remains the same at all points.
Slopes and Speeds
Science 1206 • Section 4: Average Speed
Average Speed • Average speed distance per time ratio. is a measure of the distance traveled in a given period of time; Change In Change in distance Change in time
Average Speed
Example 1: Suppose that during your trip to school, you traveled a distance of 1002 m and the trip lasted 300 seconds. The average speed of your car could be determined as.
Example 2: You go out for some exercise in which you run 12. 0 km in 2 hours, and then bicycle another 20. 0 km in 1 more hour. What was your average speed for the entire marathon?
Example 3 A traveler journeys by plane at 400. 0 km/hr for 5. 0 hours, then drives by car for 180 km in 2. 0 hours and finally takes a 45 minute ferry ride the last 12 km to his home. What is her average speed for the entire trip? Sheet 4
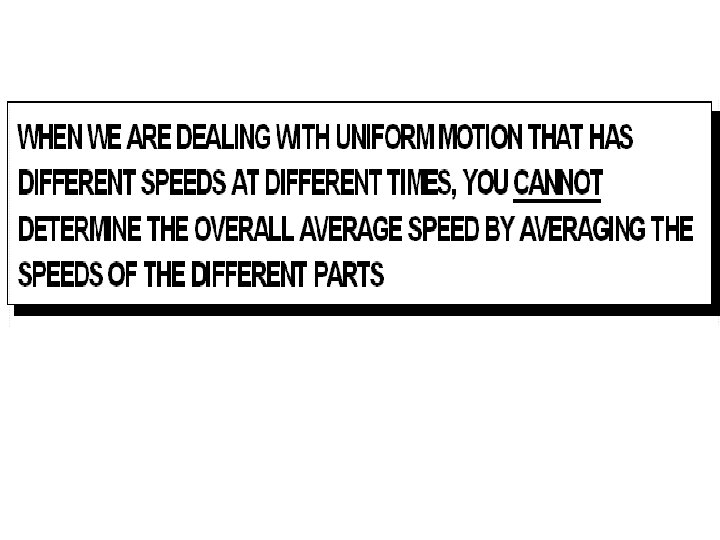
Science 1206 • Section 4: • UNIFORM MOTION Definition: When an object is moving at a constant speed/velocity in a straight line.
Uniform Motion Rolling ball is an example of uniform motion. 1)Speed of the ball is constant (with no friction). 2) In a straight line
Summary • The slope of a position time graph for uniform motion equals the average speed/velocity. • At uniform motion the average speed/velocity is equal to the instantaneous speed/velocity. • The y-intercept is equal to the initial speed/velocity. • The steeper the slope the greater the speed/velocity.
Activity Handout :
Scalar Quantity • a quantity that involves size, but not direction ie. has a magnitude and units. • Eg. distance, time, speed
Vector Quantity • A quantity that involves direction ie. has a magnitude, units and direction. • Eg. displacement, velocity
Vector diagram • Vector diagrams are diagrams that depict the direction and relative magnitude of a vector quantity by a vector arrow. -the magnitude of a vector quantity is represented by the size of the vector arrow.
• Vectors are always added tip to tail. • The resultant or net vector goes from the start of the first vector to the tip of the last vector.
Direction • Stated relative to a reference point (usually the origin or starting point). • Can be indicated by:
Distance –Position- Displacement Distance (d) is a scalar quantity which refers to "how much ground an object has covered" during its motion. • Position is a vector quantity which refers to the straight line distance and direction from a reference point. Displacement is a vector quantity which refers to "how far out of place an object is"; it is the object's change in position.
Example 2 A person started from the zero position, moved 3. 0 km East (or to the right), then moved backward 4. 0 km West (or to the left). A)What is the distance 3. 0 km + 4. 0 km = 7. 0 km B) What is the displacement 3. 0 km East + 4. 0 km West = +3 km + -4. 0 km = -1. 0 km Notice that the plus symbol right, and a negative symbol for left.
Example 3: • Mr. Abbott walks 4 meters East, 2 meters South, 4 meters West, and finally 2 meters North. A)What is the distance? 4. 0 m + 2. 0 m + 4. 0 m + 2. 0 m = 12. 0 m B) What is the displacement? displacement = 0 m
Student Questions: 1. A car travels 10 km [North] then turns and goes 8 km [South]. Which statement is correct? (a) the distance is 18 km and the displacement is 2 km. (b) the distance is 2 km and the displacement is 18 km. (c) both the distance and the displacement are 18 km. (d) both the distance and the displacement are 2 km. 2. Which statement is true? (a) Displacement can never be equal to distance. (b) Displacement can never be greater than distance. (c) Displacement can never be less than distance. (d) Displacement is always equal to distance.
3. A car moves to the right 100 m then goes to the left for 150 m. What is the displacement (assuming motion to the right is positive)? (a) 250 m (b) 50 m (c) -50 m (d) 100 m
What about speed and velocity?
The formulae… and in symbol form: Symbols for vectors have arrows printed over them. as (note the arrows on d and v)
A simpler way to look at distance and displacement is to consider the number line. The smaller arrows indicate that a person started from the zero position, moved 3. 0 km East (or to the right), then moved backwards 4. 0 km West (or to the left). Q. What is the distance? A. The DISTANCE is the complete path covered, which is 7. 0 km. Q. What is the displacement? A. The Displacement is the change in the person’s position, which is 1. 0 km [West] or -1. 0 km
Practice Examples Question #1 • An ant on a picnic table walks 130 cm to the right and then 290 cm to the left in a total of 40. 0 s. Determine the ant’s distance covered, displacement from original point, average speed, average velocity.
Solution distance = d = total path of the ant = l 30 cm + 290 cm = 420 cm displacement = d = change in position of the ant =130 cm+ (– 290) cm =– 160 cm = 160 cm [left] of the starting point
Question #2 A caribou hunter walks 4. 0 km East, then 2. 0 km North, and finally 3. 0 km West. The entire trek took 3. 0 h. Determine the hunter's: • (a) total distance traveled • (b) average speed • (c) displacement (actual distance and direction from where he started) • (d) average velocity
Solution Parts (a) and (b) are very easy to do. The hunter walked a total distance of 9. 0 km, and since this was done in 3. 0 hr, his average speed is
Question #3 Vectors at 90 degrees. A crow flies 30. 0 km west, then 40. 0 km south. The entire trek took 3. 0 h. Determine the crow’s: (a) total distance traveled (b) average speed (c) displacement (actual distance and direction from where he started) (d) average velocity
Solution(c&d) 30. 0 km West Ɵ 40. 0 km South Right triangle so we can use: Pythagorean Theorem Resultant or net To get the angle of direction we use Tan Ɵ tan(Theta) = (40/30) = 1. 333 Theta = tan-1 (1. 333) Theta = 53. 1 degrees R 2 = (30)2 + (40)2 R 2 = 2500 R = SQRT (2500) R = 50 km Put it together: The crow has a velocity of 50 km/h [ W 53. 10 S ] Worksheet 6
ACCELERATION • Acceleration is a vector quantity which is defined as "the rate at which an object changes its velocity. " An object is accelerating if it is changing its velocity
CONSTANT ACCELERATION • Sometimes an accelerating object will change its velocity by the same amount each second. This is known as a constant acceleration since the velocity is changing by the same amount each second.
Calculating Acceleration • Acceleration can be found using the following formula: A = acceleration V 1 = initial velocity V 2 = Final velocity T = change in time Note: The units for acceleration is m/s/s or m/s 2
Example 1: A skier is moving at 1. 8 m/s (down) near the top of a hill. 4. 2 s later she is travelling at 8. 3 m/s (down). What is her average acceleration?
Example 2: A rabbit, eating in a field, scents a fox nearby and races off. It takes only 1. 8 s to reach a top velocity of 7. 5 m/s [N]. What is the rabbit’s acceleration during this time?
Example 3: Canadian Myriam Bedard won two gold medals in the biathlon in the 1994 Winter Olympics. If she accelerates at an average of 2. 5 m/s 2 (E) for 1. 5 s, what is her final velocity at the end of 1. 5 s?
Note: The direction of velocity and acceleration will determine the size of the velocity (ie. If an object is speeding up or slowing down) If they are in the same direction (both are positive or both are negative) then the object is speeding up If they are in opposite directions (one is positive and the other is negative), the object is slowing down See Table 1, page 465
Example 4: An air puck on an air table is attached to a spring. The puck is fired across the table at an initial velocity of 0. 45 m/s right and the spring accelerates the air puck at an average acceleration of 1. 0 m/s 2 left. What is the velocity of the air puck after 0. 60 s? (Figure 2, page 464)
Example 5: A person throws a ball straight up from the ground. The ball leaves the person’s hand at an initial velocity of 10. 0 m/s up. The acceleration of the ball is 9. 81 m/s 2 down. Assume up is positive and down is negative. • What is the velocity of the ball after 0. 50 s and after 1. 5 s?
Activity • Practice: Acceleration worksheet • p. 388 -399, # 1 -15; p. 465 # 2, 3, 5 -8
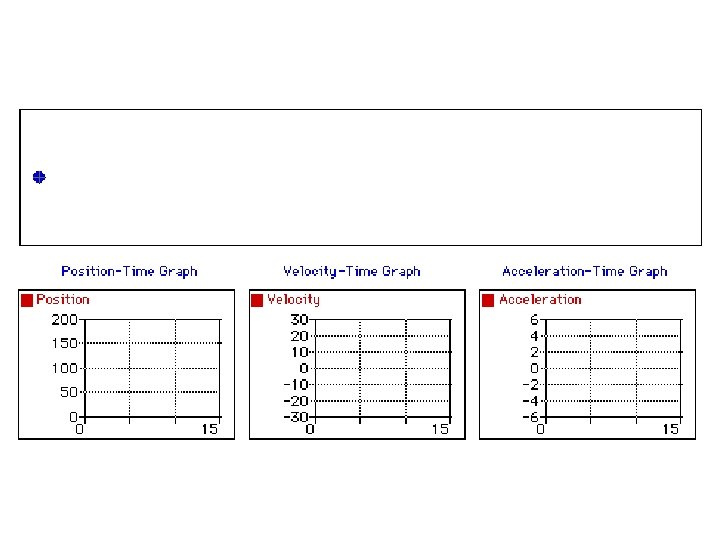
• Over the next few slides we will summarize some facts about graphs and motion. • Velocity-time Graphs: The basics
Slope is zero therefore the acceleration is zero.
Describe the motion:
Explanation
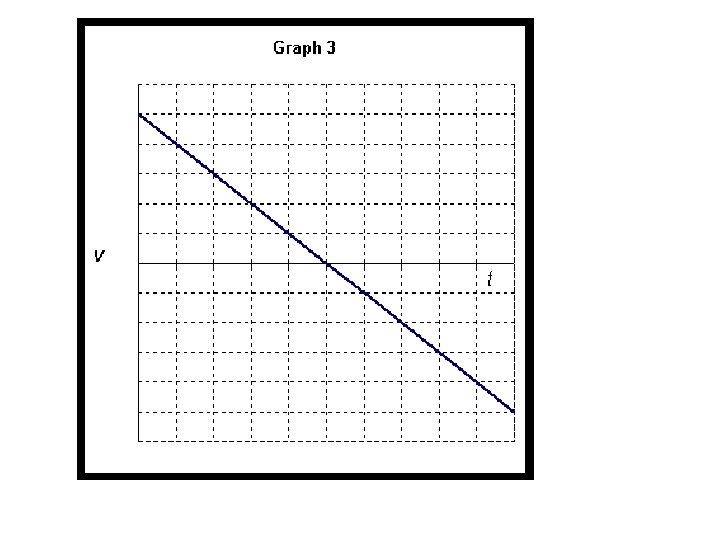
Describe the motion depicted by the v-t graph below
Explanation Answer The object is moving at a fixed speed to the left. As time goes on, the speed remains constant. All “v” values are in the “negative”, fourth quadrant, meaning the object is traveling to the left.
The slope of the line on a velocity time graph equals the average acceleration.
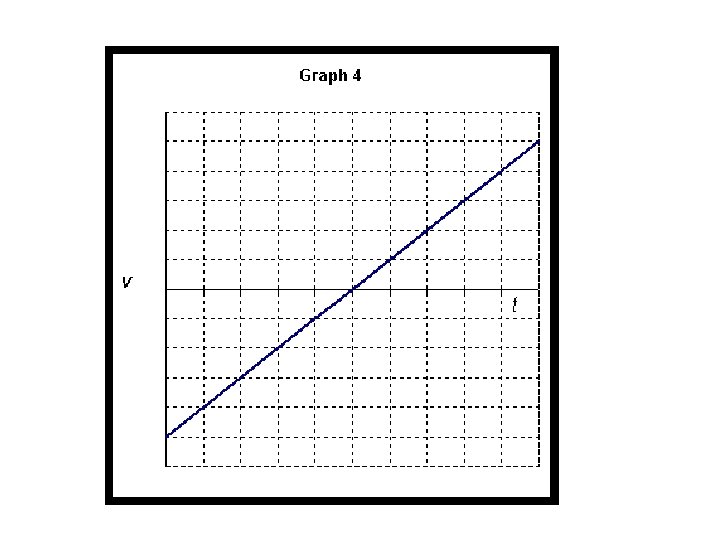
Describe the motion depicted by the v-t graph below
Explanation Answer The object starts from rest and accelerates to the right. As time goes on, the speed increases from zero. All “v” values are positive meaning the object is traveling to the right.
Describe the motion depicted by the v-t graph below
Explanation Answer At time zero the object is already moving to the right. It continues to accelerate to the right. At time zero, there is already a positive value for the speed. As time goes on, the positive speeds increase. That is, the object picks up speed to the right.
Describe the motion depicted by the v-t graph below
Explanation Answer The object is moving to the right but accelerating to the left. It therefore slows down and stops. At time zero, there is already a positive value for the speed. As time goes on, the positive speeds decrease. The object keeps moving to the right but slows down and stops.
THE DIRECTION OF THE ACCELERATION VECTOR The general RULE OF THUMB is: If an object is slowing down, then its acceleration is in the opposite direction of its motion.
Describe the motion depicted by the v-t graph below
Explanation Answer The object starts from rest and accelerates to the left. At time zero, the object is not moving. Then, as time goes on there is an increase in “negative” speeds as the object picks up speed to the left.
Describe the motion depicted by the v-t graph below
Explanation Answer The object starts with an initial speed to the left but slows down and stops. At time zero, the object has a maximum speed to the left. However, as time increases, speed decreases, and the object stops.
Describe the motion depicted by the v-t graph below
Explanation At time zero, the object has a Answer maximum speed to the left. The object starts with an However, as time increases, speed initial speed to the left decreases, and the object stops. and accelerates to the But it continues to accelerate to right. the right, meaning that after its brief stop, it took off to the right.
On a velocity - time graph the area between the graphed line and the x-axis equals the displacement Area = l x w = 6 s x 30 m/s = 180 m
Object is moving at a constant speed for 5. 0 s then it speeds up for the next 5. 0 sec. Displacement = area of rectangle + area of a triangle = lxw + ½ base x height = 10. 0 s x 5. 0 m/s + ½ 10. 0 m/s x 5. 0 s = 50 m + 25 m = 75 m
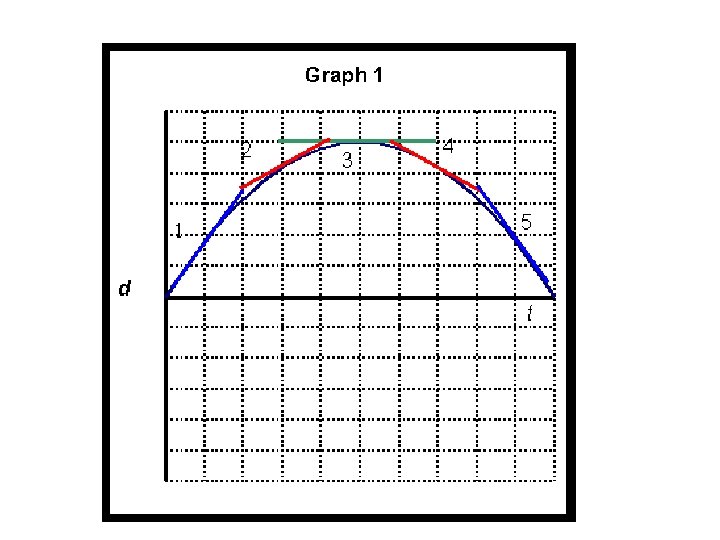
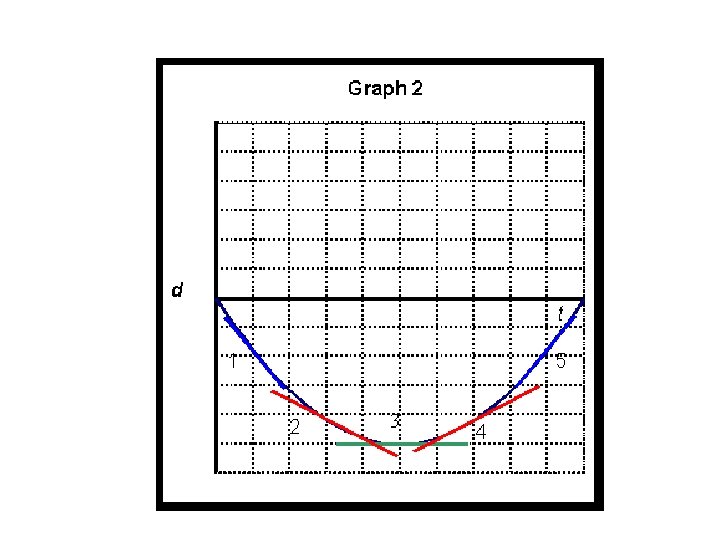
Displacement-time Graphs (Accelerated Motion)
Describe the motion depicted by the dt graph below
Explanation As time goes on, the tangents Answer acquire larger and larger The object is accelerating to positive slopes, i. e. larger the right. speeds to the right.
Describe the motion depicted by the dt graph below
Explanation Answer The object heads left but with ever decreasing speed. At half-time it stops very briefly and then speeds up to the right. Tangents 1, 2, and 3 have negative slopes that are getting smaller. This means the object is moving to the left and slowing down. At 4 it is stopped. Then it picks up speed to the right as indicated by the positive slopes of 5 & 6.
Activity 1: • Read 10. 3 "Defining Acceleration" on pages 384 - 388. Answer questions 1 - 14 from "Understanding Concepts" on pages 388 - 389. Activity 2: • Read 10. 4 "Speed-Time Graphs for Acceleration" on pages 390 - 392. Answer questions 1 - 11 from "Understanding Concepts" on page 393 Worksheets 7, 8, 9 and 15
Section 4 Multipart Motion
A. Describe what is happening in each leg of the trip. B. During which parts of the trip is the object stopped? C. During which part of the trip is the object moving the fastest? What is its Velocity?
A. Describe the motion of the object for each line section. B. What is the acceleration for each line section? C. What is the displacement between times 4. 0 seconds and 12. 0 seconds? Worksheet 14
How can you determine if your acceleration is to high?