chapter two RAINFALL Precipitation Rainfall All forms of
 �Rainfall : �All forms of water reaching the Earth from")


 �the rainfall at a single station, for small")
 Thiessen polygon method—This method attempts to allow for non-uniform distribution of gauges by")


 has")


 Mass curve of rainfall, plot of accumulated rainfall (cm) with time")


 of the line: As a result, the linear equation can")

 and (1). � �For the rainfall values at station")
- Slides: 55
chapter two RAINFALL (Precipitation) �Rainfall : �All forms of water reaching the Earth from the air and its forms of normal rainfall and snow and cold and frost and dew. �Rainfall made up should provide the following : A. Air must contain moisture. B. There are enough atoms help to condensation. C. Weather conditions must be suitable for the condensation of water vapor. D. The result of condensation must be down to the ground.
FORMS OF rainfall �Drizzle — ﺭﺫﺍﺫ a light rain in fine drops (0. 5 mm) and intensity < 1 mm/hr. �Rain — ﻣﻄﺮ the condensed water vapour of the atmosphere falling in drops (>0. 5 mm, maximum size— 6 mm) from the clouds. �Glaze — ﺍﻟﺼﻘﻴﻊ freezing of drizzle or rain when they come in contact with cold. �Sleet — ( ﺛﻠﺠﻲ ﻣﻄﺮ ) ﺷﻔﺸﺎﻑ frozen rain drops while falling through air. �Snow — ﺛﻠﺞ ice crystals. �Snow flakes — ﺣﺎﻟﻮﺏ ice crystals fused together. �Hail — ﺍﻟﺒﺮﺩ small lumps of ice (>5 mm in diameter) formed by freezing.
�Dew — ﻧﺪﻯ moisture condensed from the atmosphere in small drops upon cool surfaces. �Frost — ﺭﻳﺸﻲ ﺛﻠﺞ ice formed on the ground or on the surface �Fog — ﺿﺒﺎﺏ a thin cloud of varying size �Mist — ﺳﺪﻳﻢ a very thin fog
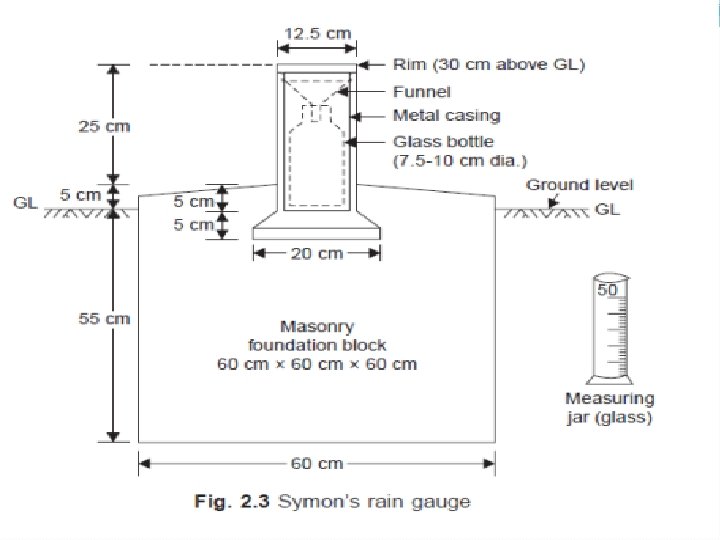
MEASUREMENT OF RAINFALL �Rainfall may be measured by a network of rain gauges which may either by : �Non-recording rain gauge type. �Recording rain gauge type. �The non-recording rain gauge used the Symon’s rain gauge (Fig. 2. 1) �the non-recording rain gauge gives only the total depth of rainfall for the 24 hours and does not give the intensity and duration of rainfall during different time intervals of the day
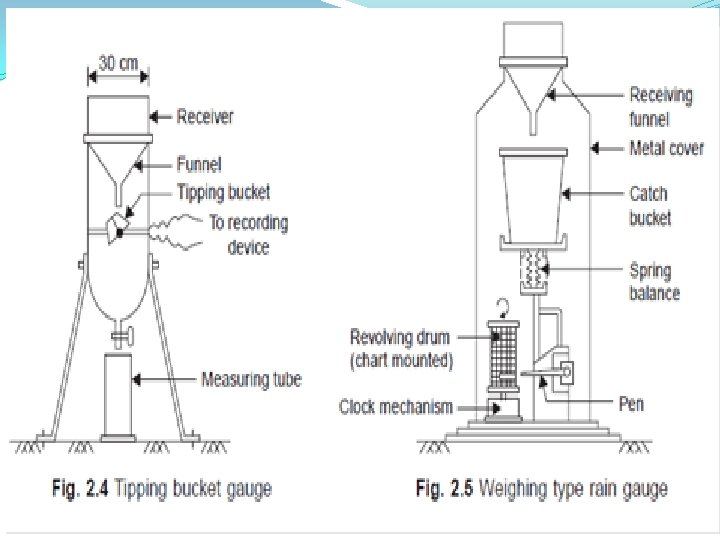
�Recording Rain Gauge: �This is also called self-recording, automatic or integrating rain gauge. This type of rain gauge Figs. 2. 4, 2. 5 and 2. 6 has an automatic mechanical arrangement. �There are three types of recording rain gauges—tipping bucket gauge, weighing gauge and float gauge.
RAIN-GAUGE DENSITY �The following figures give a guideline as to the number of rain-gauges to be erected in a given area or what is termed as ‘rain-gauge density �Area Rain-gauge density �Plains 1 in 520 km 2 �Elevated regions 1 in 260 -390 km 2 �Hilly and very heavy 1 in 130 Km 2 with 10% of the rainfall areas
OPTIMUM RAIN-GAUGE NETWORK DESIGN �the optimum number of rain-gauge stations is given by the equation : - �where : �N = optimum number of rain gauge stations to be established in the basin �Cv = Coefficient of variation of the rainfall of the existing rain gauge stations
�x = Arithmetic mean, � σ = standard deviation. �p = The optimum number of rain-gauge stations to limit the error in the mean value of rainfall to p = 10%.
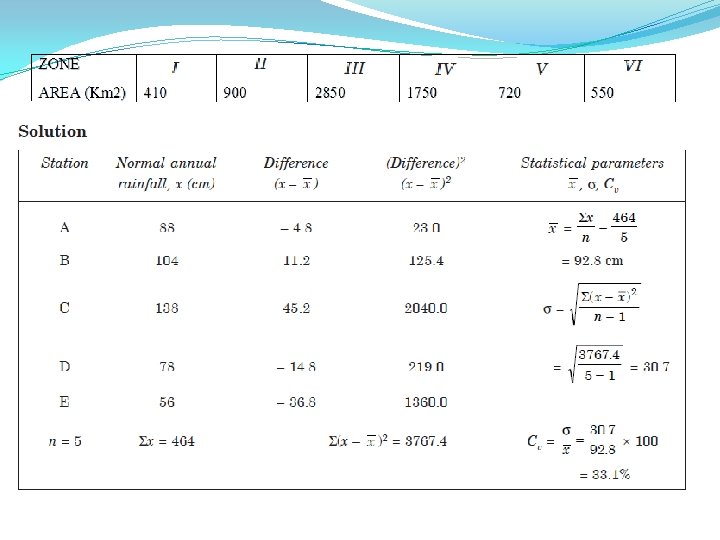
�Example 1 �For the basin shown blow, the normal annual rainfall depths recorded, and the area table zone. Determine the optimum number of rain-gauge stations to be established in the basin if it is desired to limit the error in the mean value of rainfall to 10%. Indicate how you are going to distribute the additional raingauge stations required ?
�Additional rain-gauge stations to be established = N – n = 11 – 5 = 6 �The additional six rain gauge stations have to be distributed in proportion to the areas between the isohyetals as shown below:
MEAN AREAL DEPTH OF RAINFALL (Pave) �the rainfall at a single station, for small areas less than 50 km 2, point rainfall may be taken as the average depth over the area. �In large areas, there will be a network of rain-gauge stations the average depth of rainfall over the area is determined by one of the following three methods: �(i) Arithmetic average method—It is obtained by average arithmetically the amounts of rainfall at the individual rain -gauge stations in the area : � Where � Pave = average depth of rainfall over the area � ΣP 1 = sum of rainfall amounts at individual rain-gauge stations � n = number of rain-gauge stations in the area
�(ii) Thiessen polygon method—This method attempts to allow for non-uniform distribution of gauges by providing a weighting factor for each gauge : �(iii) The isohyetal method—In this method, the point rainfalls are plotted on a suitable base map and the lines of equal rainfall (isohyets) are drawn giving consideration to orographic �where A 1– 2 = area between the two successive isohyets P 1 and P 2
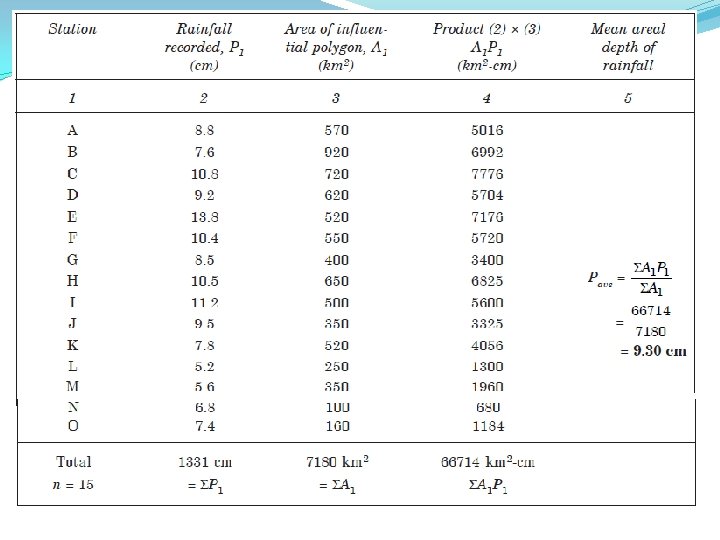
�Example 2 �Point rainfalls due to a storm at several rain-gauge stations in table shown blow. Determine the mean areal depth of rainfall over the basin by the Thiessen method. � �Solution
�Example 3 �Point rainfalls due to a storm at several rain-gauge stations in a basin are shown in Fig below with area zone table. Determine the mean areal depth of rainfall over the basin by the Isohyetal method ?
�Solution
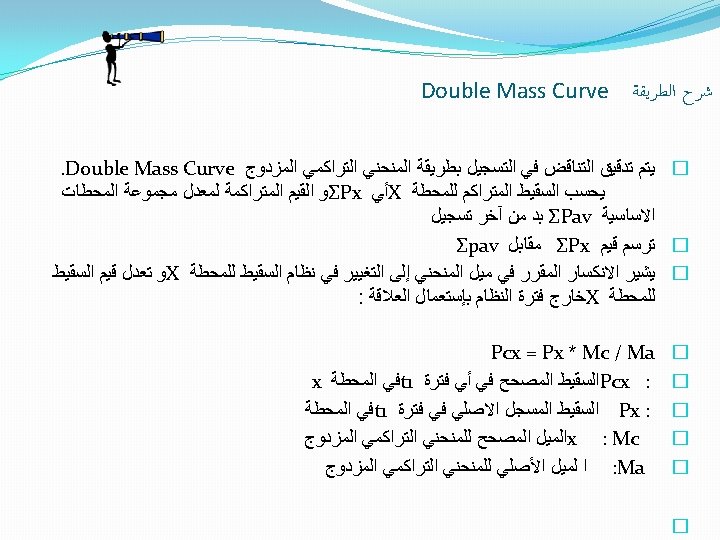
�The rainfall records at a station may slightly change after some years due to a change in the environment of a station either due to coming of a new building, fence, planting of trees �Double-mass method: �The records at the station (say, X) is tested by a double mass curve by plotting the cumulative annual rainfall at station X against the concurrent cumulative values of mean annual rainfall for a group of surrounding stations, for the number of years of record.
�From the plot, the year in which a change in regime (or environment) has occurred is indicated by the change in slope of the straight line plot. � The rainfall records of the station x are adjusted by multiplying the recorded values of rainfall by the ratio of slopes of the straight lines before and after change in environment.
�Example 3 �checking out our records of the information set forth rain D of the station with other stations, then corrected information using cumulative double curved way confined to the period between the month of May 1996 and April 1997 Sta. D Sta. C 140. 15 125. 2 123 116. 9 155. 1 168. 1 88. 6 93. 7 93. 5 90. 2 83. 5 82. 4 78. 4 67. 9 60 62. 3 81. 8 87. 3 89. 9 94. 7 92. 8 89. 9 84. 9 87. 1 Sta. B 77. 2 66. 5 61. 3 68. 1 80. 1 85. 6 90. 1 93. 7 91. 5 90. 3 83. 6 83. 4 Sta. A 79. 7 69. 4 65. 3 71. 7 83 82. 7 89. 4 91. 5 92. 4 90. 1 82. 3 80. 7 Month may 1996 jun 1996 july 1996 Aug. 1996 Dec. 1996 Oct. 1996 Nov. 1996 dec. 1996 jan. 1997 Feb. 1997 march 1997 april 1997
Pcx ΣPav Pav MONTH 82. 4 83. 73 april 1997 83. 5 165. 9 167. 33 83. 6 march 1997 90. 2 256. 1 257. 43 90. 1 Feb. 1997 93. 5 349. 66 92. 23 jan. 1997 93. 7 443. 3 442. 96 93. 3 dec. 1996 88. 6 531. 9 532. 76 89. 8 Nov. 1996 93. 29 700 617. 96 85. 2 Oct. 1996 86. 16 855. 1 699. 59 81. 63 Dec. 1996 64. 87 972 766. 96 67. 37 Aug. 1996 68. 27 1095 829. 16 62. 2 july 1996 69. 45 1220. 2 897. 09 67. 93 jun 1996 77. 76 1360. 35 975. 52 78. 43 may 1996 Oct. 1996 Pcx = Px * 1/1. 8 = 168. 1 * 0. 555 = 93. 29
1500 1360. 35 1400 Pcx = Px * Mc /Ma Pcx = Px * 1/1. 8 1300 Accumulated Annual Rainfall at X station 1200 1220. 2 1095 Ma = 180 /100 = 1. 8 1100 972 1000 855. 1 900 800 Mc = 100/ 100 =1 October 1996 , 700 600 531. 9 500 443. 3 349. 6 400 256. 1 300 165. 9 200 82. 4 100 0 0 100 200 300 400 500 600 700 800 900 1000 Accumulated Annual Rainfall at multi stations
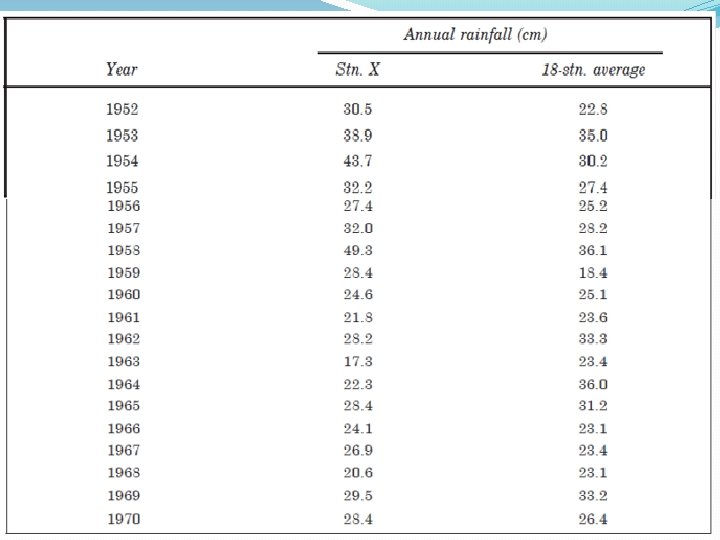
� Home work � Example 4 �The annual rainfall at station X and the average annual rainfall at 18 surrounding stations are given below. � Check the consistency of the record at station X and determine the year in which a change in regime has occurred. State how you are going to adjust the records for the change ?
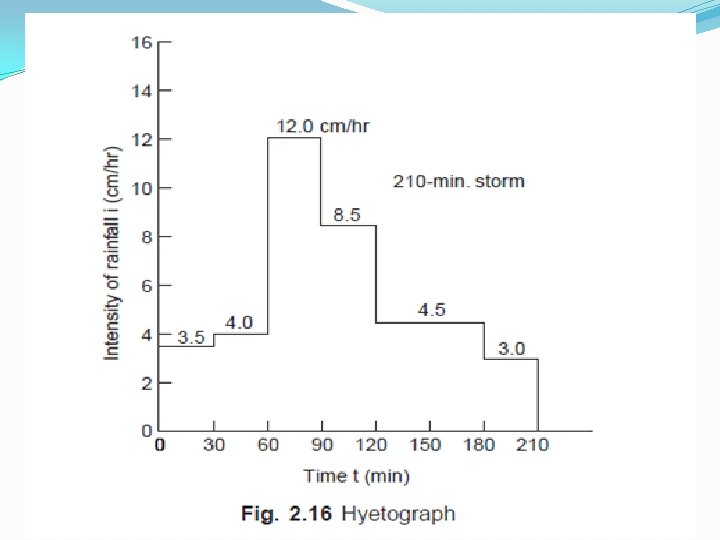
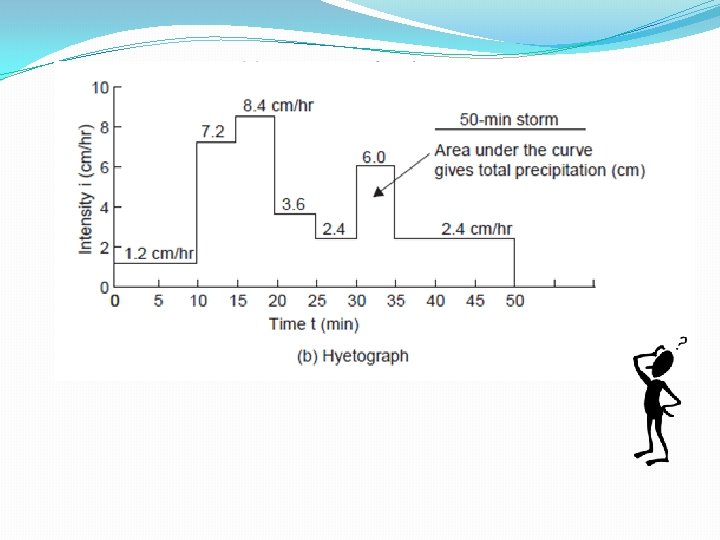
GRAPHICAL REPRESENTATION OF RAINFALL �The variation of rainfall with respect to time may be shown graphically by �(i) a hyetograph � (ii) mass curve �A hyetograph �is a bar graph showing the intensity of rainfall with respect to time (Fig. 2. 16) and is useful in determining the maximum intensities of rainfall during a storm as is required in land drainage and design of culverts.
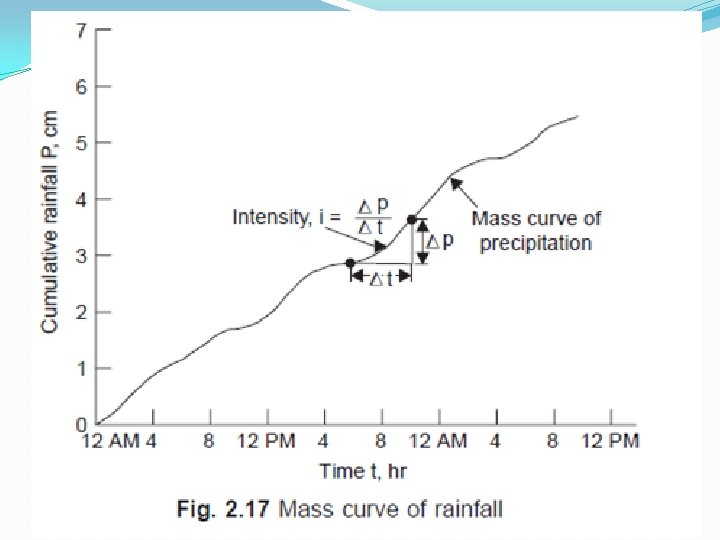
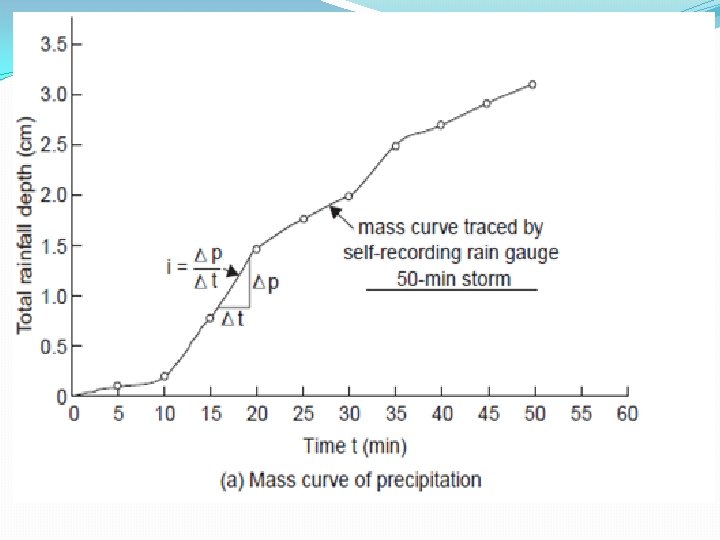
�Mass curve of rainfall �is a plot of cumulative depth of rainfall against time (Fig. 2. 17). �From the mass curve, the total depth of rainfall and intensity of rainfall at any instant of time can be found. �The intensity of rainfall at any time is the slope of the mass curve (i. e. , i = ΔP/Δt) at that time.
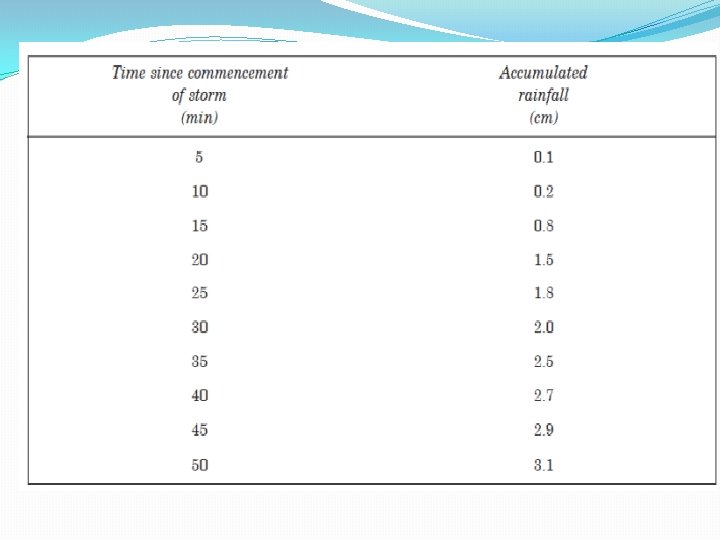
�Example 6 The following data blow are the rain gauge observations during a storm. Draw: �(a) mass curve of rainfall � (b) hyetograph �
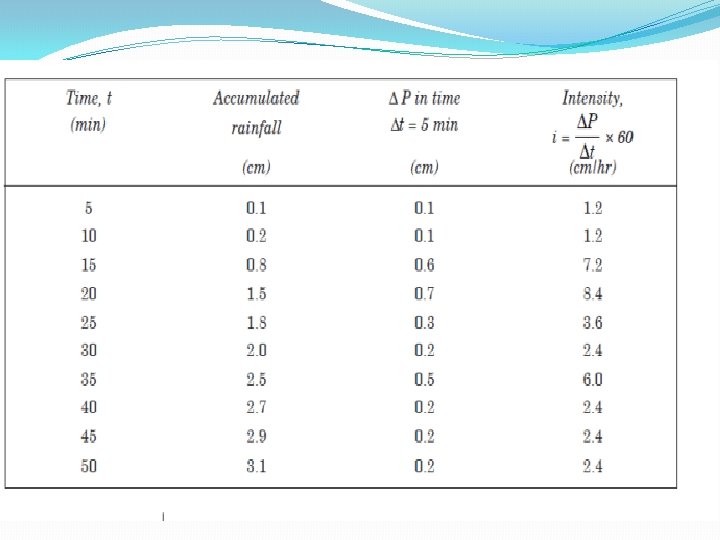
�Solution � (a) Mass curve of rainfall, plot of accumulated rainfall (cm) with time (min) Fig. 2. 19 (a). � (b) Hyetograph. The intensity of rainfall at successive 5 min interval is calculated and a bar-graph of ‘i (cm/hr) with. t (min)’ and is called the ‘hyetograph; 2. 19 (b).
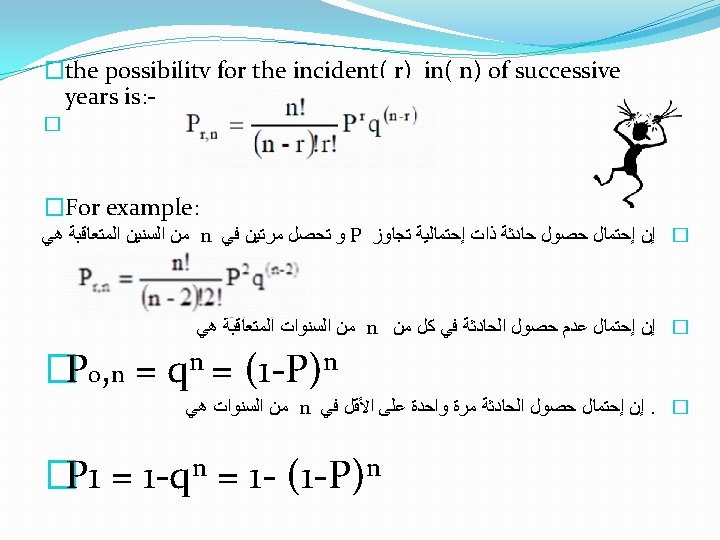
Frequency-site rain fall �In many hydraulic engineering applications such as floods, it is necessary to know the probability of drop of the rainstorm. �The relationship between the annual maximum values of the storm for (24) hours of time per year, is called the curved gross annual chained to the rain storm.
�The probability of rainstorm for amount that equals or exceeds a certain value X , Symbolized by the symbol P and it will be a period of repetition (T) equal : � T = 1/P �For example, if I assume that the rain storm that reach period (20) cm in 24 hours occurred every (10) years at a certain �station A. � This means that the amounts of rain rate equal to or exceeding 20 cm in 24 hours occur once every 10 years or 10 times every 100 years �P = 1/T �Unlikely to get the incident is P �q = 1 -P
�Example 7 �The maximum depth of rainfall for one day in a certain area showed that the depth of 280 mm has a return period of 50 years each, calculate the probability occurrence of the depth of rainfall for one day is equal to or greater than 280 mm: �a. Once in 20 sequent years �b. Twice in sequent 15 years �c. Once at least 20 sequent years � Solution : - . � n = 20 , r = 1 , T = 50 , P = 1/50 = 0. 02 � a. P 1, 20 = (20 !)/(19! * 1!) * 0. 02 * (0. 98)19 = 0. 272 � b. n = 15 , r = 2 � P 2, 15 = (15!)/(13!*2!)*(0, 02)2 * (0. 98)13 = 0. 0323 �c. P 1 = 1 - (0. 98)20 = 0. 332
�Quiz � Q 1 The maximum depth of rainfall for one day in a certain area showed that the depth of 400 mm has a return period of 70 years each, calculate the probability occurrence of the depth of rainfall for one day is equal to or greater than 400 mm: � a. Twice in 25 sequent years �b. Three times in sequent 20 years �c. Once at least 30 sequent years � Q 2 Match the items in ‘A’ with items in ‘B’: � A B � (i) Hydrology deals with (a) one of hydrology data � (ii) Stream-flow records (b) Rainfall may be measured � (iii) by network of Rain-gauges (c) water science � (iv) Double mass curve (d) type of recording rain gauges � (v) Tipping bucket gauge (e)Used in Optimum rain-gauge network � (vi) Recording rain-gauge � (vii) Coefficient of variation, Cv
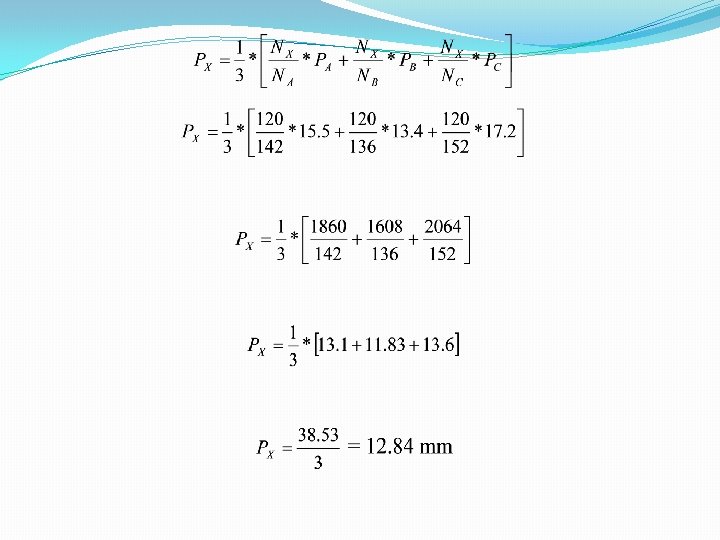
Interpolation of Missing Data: �Sometimes it becomes necessary to interpolate the missing data of one station due to the changes in gauge location or due to the changes in the surroundings and observation technique etc. This can be done by the use of following methods. - Normal Ratio Method: �Let at a certain station X, Rainfall data could not be recorded for a certain long period then following procedure may be adopted.
a. Choose three stations, which surround the index station X. b. Let the rainfall at X be Px. c. Let rainfall at A, B, and C, the surrounding stations will be PA, PB and PC. d. Nx, NA, NB, Nc : - The normal annual of rainfall �Then,
� Example 1: � Station X remained inactive for a certain period during which a storm occurred. The storm rainfall at the three surrounding stations, A, B, and C was recorded as 15. 5, 13. 4, and 17. 2 mm respectively. The normal annual rainfall at X, A, B, and C was observed as 120, 142, 136, and 152 mm respectively. Find the storm rainfall at station X.
� Least Square Method �The least square method is being used for comparing the records of station having some missing values with the recorded data for the same years of another station and the end finding the relationship as a linear equation. �The form of the linear equation is given as: � Y = a + b * X �In order to find the linear equation, defining the “a” and “b” �
�And �N : - number of stations �In order to check if there is good relationship between the two variables then the relationship coefficient (r) can be found by the following equation: �Where the value of (r) ranges between (-1) and (1). The minus value of (r) means that, the line is decreasing towards X-axis and vise versa.
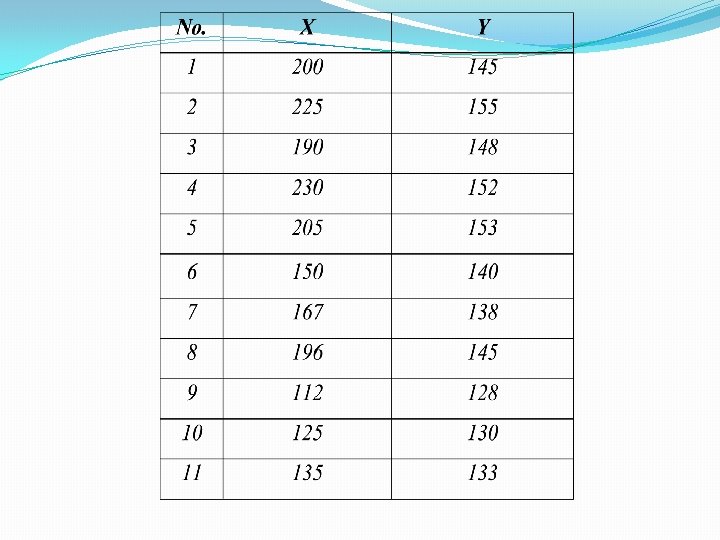
�Example: 2 � X and Y are two neighboring rainfall stations. Station X has complete records and station Y has some missing values for X records , 110, 170 and 166 mm, computed the missing of Y station by Find the linear relation equation between the two series in the following table :
�Solution/ Step 1: preparing of table No. X Y X*Y X 2 Y 2 1 200 145 29000 40000 21025 2 225 155 34875 50625 24025 3 190 148 28120 36100 21904 4 230 152 34960 52900 23104 5 205 153 31365 42025 23409 6 150 140 21000 22500 19600 7 167 138 23046 27889 19044 8 196 145 28420 38416 21025 9 112 128 14336 12544 16384 10 125 130 16250 15625 16900 11 135 133 17955 18225 17689 Total 1935 1567 279327 356849 224109
�Step 2: Computation of the slope of the line:
�Step 3: Computation (a) of the line: As a result, the linear equation can be written as:
�Step 3: Compute the relationship coefficient of the line:
� O. K. between (-1) and (1). � �For the rainfall values at station X, 110, 170 and 166 mm, we can have the computed the missing values at station Y as follows: �Y 1 = 103. 17+ 0. 2334*110 = 128. 8 mm �Y 2 = 103. 17+ 0. 2334*170 = 142. 8 mm �Y 3 = 103. 17+ 0. 2334*166 = 141. 9 mm