SCIENCE 1206 Unit 3 Physical Science Motion Section


 QUALITATIVE DESCRIPTIONS • are descriptions made")


 125 cm => m")
 120 sec => min b)2.")

 360 m/s => km/hr •")


: • There at least two reasons for being familiar with")
 helpful for indicating how many significant figures are present in a")


Speed of the ball")


![Ways to write a vector… 1. 10 m [W] (number, unit, direction) 2. (vector](https://slidetodoc.com/presentation_image_h/990eecac959f810ea5ce671cfcfc7858/image-60.jpg "Ways to write a vector… 1. 10 m [W] (number, unit, direction) 2. (vector")


 right (+) east (+) north")


![Example #2 • A jogger travels 52 m[E] in 10. 0 s and then](https://slidetodoc.com/presentation_image_h/990eecac959f810ea5ce671cfcfc7858/image-69.jpg "Example #2 • A jogger travels 52 m[E] in 10. 0 s and then")


 can be represented using")


 to 9. 0 m/s")


")


- Slides: 123
SCIENCE 1206 Unit 3 Physical Science – Motion
Section 1: • Units, Measurements and Error
What is Physics? • Physics is the study of motion, matter, energy, and force.
Qualitative and Quantitative Descriptions (p. 679 – 680) QUALITATIVE DESCRIPTIONS • are descriptions made by observing with the 5 senses, such as the smell or colour. They include observations which cannot be measured. This bird has a large wingspan
QUANTITATIVE DESCRIPTIONS • are descriptions that are based on measurements or counting (i. e. they are numerical. They deal with quantities. This bird has a wingspan of two meters.
SI MEASURMENTS • Scientists all over the world have agreed on a single measurement system called Le Système International d’Unités, abbreviated SI
BASE AND DERIVED UNITS-p. 689 • Base units are units that are defined.
Derived units are ones that we “figure out” by using base units. example: The length and width of a rectangle Area = length x width =m x m = m 2 =(base unit) x (base unit) = ( Derived unit)
Converting measurements is a skill that will be tested in high school math and science classes, as well as in some college classes. The Step Stair Method is a simple trick to converting these units. Larger unit as you go up the steps! Divide by a power of ten 10 Smaller unit as you go down the steps! Multiple by a power of ten 10
You Try! • • • Convert the following measurements: a) 125 cm => m b) 2234 m => km c) 23 mm => cm d) 45 g => kg Do Metric Conversion sheet
You Try! • • Convert the following measurements: a) 120 sec => min b)2. 5 hours => sec c)3. 5 years => hours
Example 3: General Rule: To change from km/hr = m/s ÷ 3. 6 To change from m/s to km/hr x 3. 6
You Try! • Convert the following measurements: • a) 360 m/s => km/hr • b) 50 km/hr => m/s
ACCURACY AND PRECISION • Accuracy: refers to the closeness of measurements to is how close a measured value is to the actual (true ) value. • Precision: is how close the measured values are to each other. true) value.
• So, if you are playing soccer and you always hit the left goal post instead of scoring, then you are not accurate, but you are precise
Which ruler is more precise? Pencil A: Pencil B The smaller the unit you use to measure with, the more precise the measurement is.
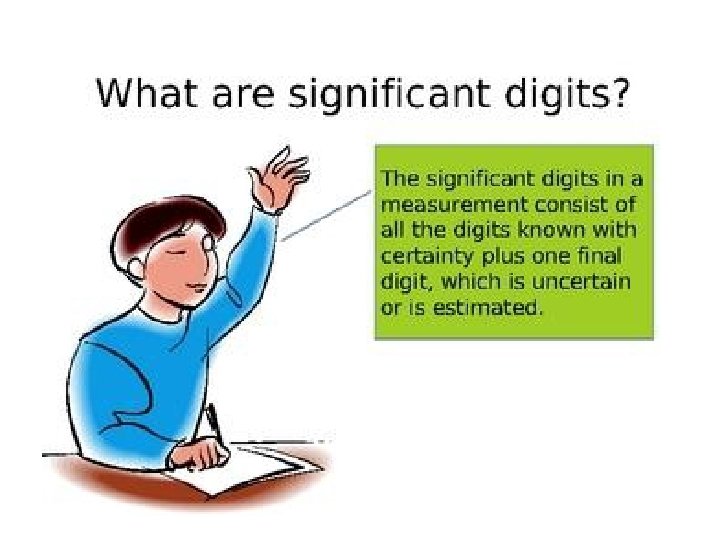
MEASUREMENTS AND SIGNIFICANT DIGITS p. 344 -349 What is the measurement of the Stick? • The # of significant digits in a value includes all digits that are certain and one that is uncertain Therefore significant digits are digits that are statistically significant
Rules for Determining the Number of Significant Digits : • 1. All non-zero digits (1 -9) are to be counted as significant. • Ex. 517, 51. 7 and 5. 17 all have 3 sig figs • 2. For any decimal number, any zero that appears after the last non-zero digit( or between 2 nonzero digits) are significant. Ex. 0. 05057 , 5057 and 56. 50 all have 4 sig figs •
EXAMPLE 6 • All digits count . 000239 3 • Leading 0’s don’t . 00023900 5 • Trailing 0’s do 3. 980 4 1. 00040 6 45. 8736
How many Significant Figures? 1. 2. 3. 4. 5. 6. 7. 8. 9. 10. 2. 83 36. 77 14. 0 0. 0033 0. 02 0. 2410 2. 350 1. 00009 3. 25 0. 0056040
Rounding Review • IF THE DIGIT IS 5 OR MORE ROUND UP • IF THE DIGIT IS LESS THAN 5 ROUND DOWN
EXAMPLE 1 • Make the following into a 3 Sig Fig number 1. 5587. 0037421 1. 367 1. 6683 X 106
ADDING OR SUBTRACTING SIGNIFICANT FIGURES • Rule: When adding or subtracting sig fig, the answer should have the same number of decimal places as the smallest number of decimal places in the numbers that were added or subtracted. Answer is 641. 63
ADDITION/SUBTRACTION • 25. 5 +34. 270 59. 770 59. 8 32. 72 - 0. 0049 32. 7151 32. 72 320 + 12. 5 333
ADDITION AND SUBTRATION • • . 56 +. 153 = 82000 + 5. 32 = 10. 0 - 9. 8742 = 10 – 9. 8742 = Look for the last important digit
MULTIPLYING OR DIVIDING SIGNIFICANT FIGURES • When multiplying and dividing sig, fig. the answer will contain the same number of digits as in the original number with the least number of digits
Practice: 32. 27 x 1. 54 = 3. 68 /. 07925 = 1. 750 x. 0342000 =
Using Scientific Notation (Page): • There at least two reasons for being familiar with scientific notation. 1) Method of writing numbers that are very big and very small. It works like this: • a big number Speed of light => 300, 000 m/s = 3. 0 x 108 • a small number Charge on an electron => 0. 0000000001602 C => 1. 602 x 10 -19
• 2) helpful for indicating how many significant figures are present in a number 100 cm as 1. 00 x 102 ( 3 sig fig )cm 1. 0 x 102 ( 2 sig fig )cm 1 x 10² ( 1 sig fig )cm
Scientific notation • Read “Scientific Notation” on page 621 Worksheet significant digits and rounding
Sources of Error • no measurement is exact; any scientific investigation will involve error. 1. Random error (uncertainty) • an error that relates to reading a measuring device • Ex. a person measuring the length of an object using a ruler must estimate the last digit; another person may not estimate to the same digit • Can be reduced by taking many measurements and then averaging them (and having the same person take the measurement each time)
2. Systematic error • An error due to the use of an incorrectly calibrated measuring device. • Ex. a clock that runs slow or a ruler with a rounded end • Can be reduced by inspecting and recalibrating equipment regularly.
3. Parallax • The change in relative position of an object with a change in the viewing angle • Ex. Stretch out your arm and close your right eye and “hide” something behind your index finger. Now, switch eyes while maintaining your finger position. The background shifts; this is parallax.
How to Reduce Parallax: #1. All readings should be taken looking in a perpendicular line that joins the eye, the needle and the scale Ex: speedometer #2. Minimize the distance between the scale and the object being measured Ex: place meter stick on its edge, not flat
Error and Discrepancy • ERROR: • Refers to the uncertainty in a measurement. Ex: using a meter stick • 1. 56 m ± 0. 05 m lies between 1. 51 m and 1. 61 m • 6. 4 m ± 0. 1 m, means that the reading lies between 6. 3 m and 6. 5 m
Discrepancy • The difference between the value determined by your experimental procedure and the generally accepted value Example: A student measures the acceleration due to gravity and finds it to be 9. 72 m/s 2. If the accepted value is 9. 81 m/s 2, what is the percent discrepancy.
Introduction • Motion is a common theme in our everyday lives: birds fly, babies crawl, and we, run, drive, and walk. • Kinematics is the study of how o objects move.
Average Speed • Average speed distance per time ratio. is a measure of the distance traveled in a given period of time; Change In Change in distance Change in time
Average Speed
Example 1: Suppose that during your trip to school, you traveled a distance of 1002 m and the trip lasted 300 seconds. The average speed of your car could be determined as.
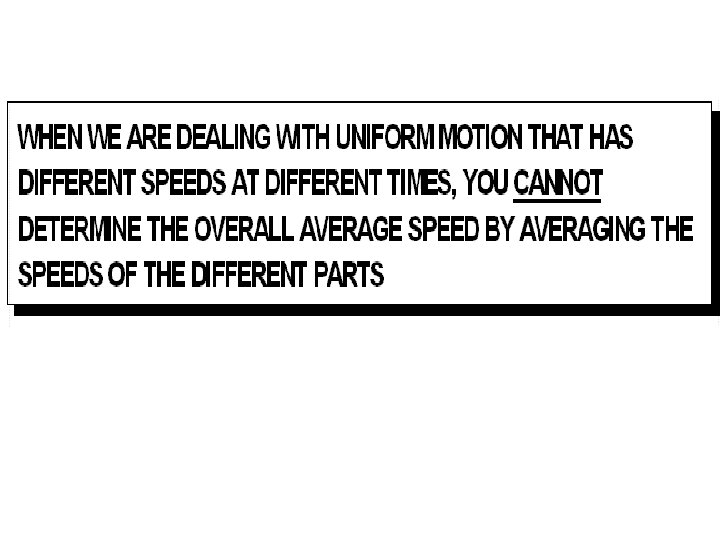
Example 2: You go out for some exercise in which you run 12. 0 km in 2 hours, and then bicycle another 20. 0 km in 1 more hour. What was your average speed for the entire marathon?
Example 3 A traveler journeys by plane at 400. 0 km/hr for 5. 0 hours, then drives by car for 180 km in 2. 0 hours and finally takes a 45 minute ferry ride the last 12 km to his home. What is her average speed for the entire trip? Sheet 4
Uniform Motion Rolling ball is an example of uniform motion. 1)Speed of the ball is constant (with no friction). 2) In a straight line
• Recall: Slope can be calculated using the formula m/s is the unit for SPEED (v). The SLOPE OF A d-t GRAPH IS SPEED (v)!
Review… • The slope of a distance time graph is equal to the SPEED. • If the graph is increasing by a constant amount, the object is moving at a CONSTANT SPEED. • The steeper the slope, the greater the speed!
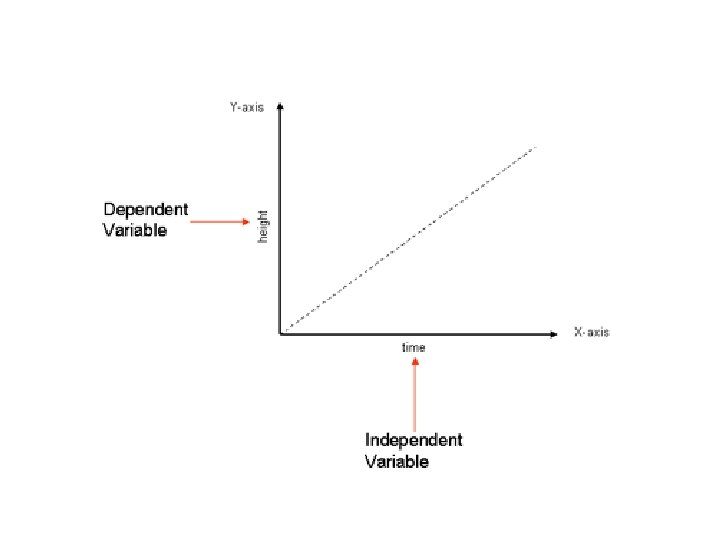
Independent and dependent Variables, Page 672 INDEPENDENT VARIABLE • is the one whose values the experimenter chooses. (Often in nice, even intervals) – Ex: time • is always plotted on the x-axis • Also called the manipulated variable
• DEPENDENT VARIABLE • is the one which responds to changes in the independent variable. Ex: distance • is always plotted on the y-axis • Also called the responding variable
INSTANTANEOUS SPEED • the speed at which an object is moving at a particular moment in time • For any object moving at a constant speed, the instantaneous speed is the same at any time, and equals the constant speed.
INTERPOLATION • finding values between measured points • Ex: What is the distance travelled at 3. 5 s?
EXTRAPOLATION • finding values beyond measured points by extending the graph using a dotted line. • Ex: What is the distance travelled at 9. 0 s?
Scalar Quantity • a quantity that includes a number and a unit. Example - Distance : 10 km Time: 100 s
• Two friends are both told to go 3 m in the hall. What is the problem with this?
Vector Quantity • A quantity that includes a number, a unit and direction
How to Specify Direction… • Left, right, up, down • Usually use compass symbol • The direction is always put in [ ] – Example: 125 km [E]
Ways to write a vector… 1. 10 m [W] (number, unit, direction) 2. (vector diagram)
• Write all of the quantities below… 1. 25 kg 2. 23 km/h 3. 2 mm [S] 4. **Now, circle the scalar, underline the vector
Example #1 A student walks 2 km east, 3 km south, 2 km west and 3 km north. a) Draw a vector diagram. b) What is the total distance traveled?
Displacement • A vector quantity • The change in position of an object from where it started. • Symbol: In the above example, what was the displacement?
Example #2 • A car travels 10 km north and then turns around and goes 8 km south. a) What is the total distance? b) What is the total displacement?
Note • If combining vectors using equations: up (+) right (+) east (+) north (+) down (-) left (-) west (-) south (-)
Example #3 • Eric leaves the base camp and hikes 11 km, north and then hikes 11 km east. Determine Eric's resulting displacement.
Velocity • A vector quantity • A rate of change of position with respect to time.
Example #1 • A train travels at a constant speed through the countryside and has a displacement 150 km [E] in a time of 1. 7 h. What is the velocity of the train?
Example #2 • A jogger travels 52 m[E] in 10. 0 s and then 41 m [W] in 8. 0 s. a) What is the jogger’s displacement? b) What is the jogger’s velocity?
Displacement – Time Graphs • Also, known as Position – Time graphs. • Remember, displacement is distance from the starting position with direction (Ex: 10 km [E] )
1. If there is NO change in direction, a position time graph looks very similar to a distance – time graph with the exception that the distance is indicated.
2. If there is a change in direction, the position – time graph and the distance time graph looks different.
Slope Meaning… Slope of position-time graph = velocity **Positive slope MEANS you are going EAST or NORTH. **Negative slope MEANS you are going SOUTH or WEST **Slope of 0 means you are stopped.
Note • The 0 usually indicates the position of home. Not always where you are starting from…
Example:
1. What is happening at each point? 2. What is the velocity at A? 3. At which points is the object stopped?
e p S e m i T d e s h p a r G
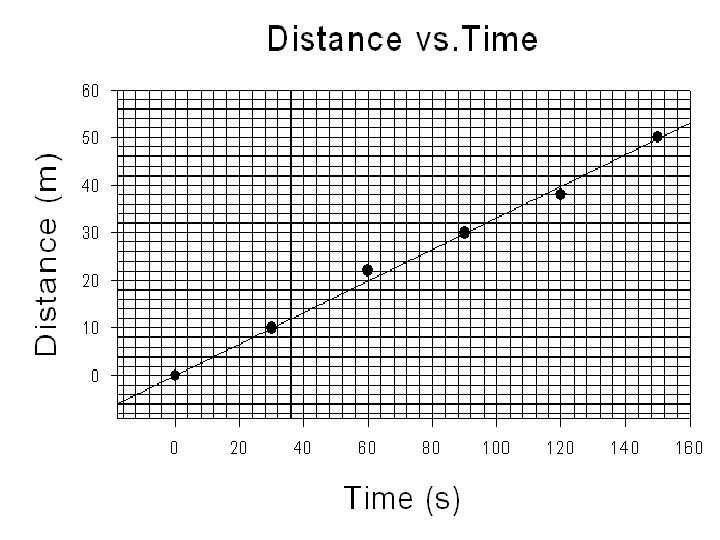
Recall… • A object moving with uniform motion (constant speed) can be represented using a distance-time graph. • Straight, diagonal line • Slope of the line = speed • The steeper the slope, greater speed
• You can also show the motion of the same object using a speed – time graph instead…
Example • Draw a speed – time graph of a roller skating 5 m/s for 5 minutes. Time (s) Speed (m/s) 0 5 1 5 2 5 3 5 4 5 5 5
Speed – Time Graph • Straight, horizontal line • Y-intercept = speed of object • Distance = speed x time So, distance is the area under the line!!!
Describe the motion:
Explanation
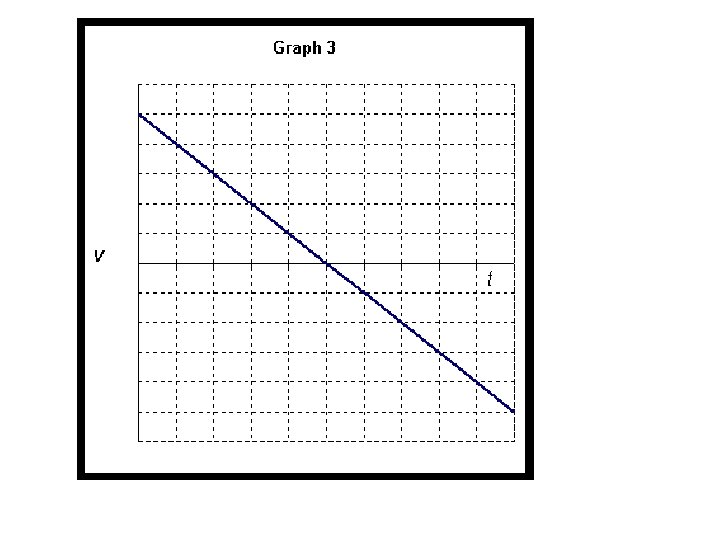
Describe the motion depicted by the v-t graph below
Explanation Answer The object is moving at a fixed speed to the left. As time goes on, the speed remains constant. All “v” values are in the “negative”, fourth quadrant, meaning the object is traveling to the left.
Describe the motion depicted by the v-t graph below
Explanation Answer The object starts from rest and accelerates to the right. As time goes on, the speed increases from zero. All “v” values are positive meaning the object is traveling to the right.
Describe the motion depicted by the v-t graph below
Explanation Answer The object is moving to the right but accelerating to the left. It therefore slows down and stops. At time zero, there is already a positive value for the speed. As time goes on, the positive speeds decrease. The object keeps moving to the right but slows down and stops.
Describe the motion depicted by the v-t graph below
Explanation Answer The object starts from rest and accelerates to the left. At time zero, the object is not moving. Then, as time goes on there is an increase in “negative” speeds as the object picks up speed to the left.
Describe the motion depicted by the v-t graph below
Explanation At time zero, the object has a Answer maximum speed to the left. The object starts with an However, as time increases, speed initial speed to the left decreases, and the object stops. and accelerates to the But it continues to accelerate to right. the right, meaning that after its brief stop, it took off to the right.
Uniform Motion vs. Acceleration • d-t graphs so far always had a constant speed, the object did NOT speed up or slow down (Uniform Motion)
• There are many instances when an object’s speed is NOT constant, an object may speed up of slow down (Acceleration)
ACCELERATION • Acceleration can be a scalar or vector quantity which is defined as "the rate at which an object changes its speed or velocity. "
How is it calculated?
Example #1 • You speed up from rest (0 m/s) to 9. 0 m/s while riding your motorcycle. You do this in 2. 0 s. What is your acceleration?
Unit for acceleration • m/s 2 “meters per second or meters per second squared” • km/h/s “kilometers per hour per second”
Example #2 • A car traveling 100 km/h comes to a complete stop in 5 seconds. What is its average acceleration?
Note: • The words “rest” or “stopped” means your speed is 0 • A negative answer indicates that the object is slowing down.
Example #3 • An object has an acceleration of 0. 85 m/s 2. If the object moves for 18 s and its initial speed is 10. 0 m/s, what is its final speed?
The slope of the line on a velocity time graph equals the average acceleration.
CONSTANT ACCELERATION • Sometimes an accelerating object will change its speed/velocity by the same amount each second. This is known as a constant acceleration.
Describe the motion… • Object is speeding up • Positive acceleration
Describe the motion… • Constant speed • No acceleration
Describe the motion. . • Object is slowing to a stop • Decreasing speed • Negative acceleration (deceleration)
Example #1 • Given the graph below, calculate the acceleration of the object.
Recall! Area under a speed-time graph = distance travelled!
Example #1 • Using the graph below, calculate the object’s distance.
Example #2 • Using the graph below, calculate the object’s distance.
Displacement-time Graphs (Accelerated Motion)
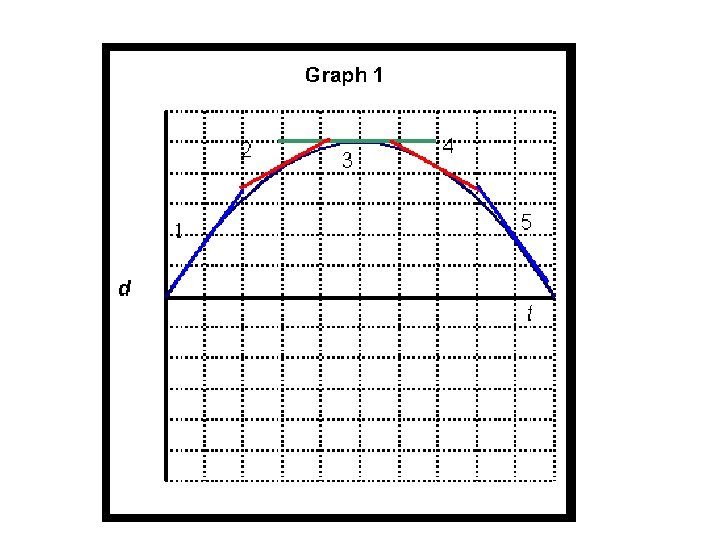
Describe the motion depicted by the dt graph below
Explanation As time goes on, the tangents Answer acquire larger and larger The object is accelerating to positive slopes, i. e. larger the right. speeds to the right.
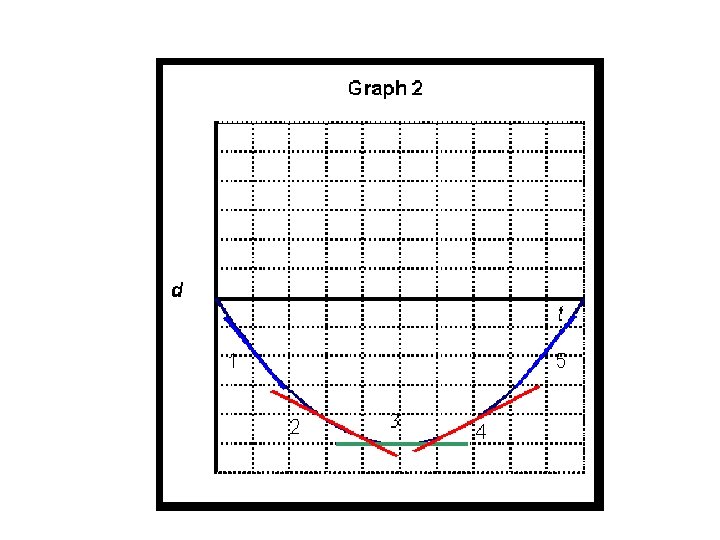
Describe the motion depicted by the dt graph below
Explanation Answer The object heads left but with ever decreasing speed. At half-time it stops very briefly and then speeds up to the right. Tangents 1, 2, and 3 have negative slopes that are getting smaller. This means the object is moving to the left and slowing down. At 4 it is stopped. Then it picks up speed to the right as indicated by the positive slopes of 5 & 6.
Multipart Motion
A. Describe what is happening in each leg of the trip. B. During which parts of the trip is the object stopped? C. During which part of the trip is the object moving the fastest? What is its Velocity?
A. Describe the motion of the object for each line section. B. What is the acceleration for each line section? C. What is the displacement between times 4. 0 seconds and 12. 0 seconds? Worksheet 14