Developing an Integrated Clinical Decisionmaking Scheme ICDS for
 for Predicting SPCs in Women with Endometrial")


 breast cancer (1. 7 million cases) wor There")
 breast cancer (1. 7 million cases) wor There")


 Lu, Chi-Jie Lu, Chalong Cheewakriangkrai, Chi-Chang * (2018).")
 Lu, Chi-Jie Lu, Chalong Cheewakriangkrai, Chi-Chang * (2018).")
 SPCs can reflect the result of early detection, supportive care,")
 Cancer registration provides core information for cancer surveillance and control.")


 Female Second cancer First cancer 140_9 Oral cancer")
 Both Male & Female First and second caner (6")


 ü e.")


 Random Search or Cross-validation k-folds Cross Validation Hyperparameters")


 DOE")


 DOE The")


 DOE The")


 2. Journal")


- Slides: 77
Developing an Integrated Clinical Decision-making Scheme (ICDS) for Predicting SPCs in Women with Endometrial Cancer: A Retrospective Analysis in Taiwan and Thailand Prof. Chi-Chang Chung-Shan Medical University, Taiwan Dr. Gin-Den Chung-Shan Medical University Hospital, Taiwan Dr. Wen-Chien Ting Chung-Shan Medical University Hospital, Taiwan This study was a joint work with Dr. Chalong Cheewakriangkrai Chiang Mai University, Thailand Prof. Ssu-Han Chen Ming Chi University of Technology, Taiwan Prof. Chi-Jie Lu Chien Hsin University of Science and Technology, Taiwan
This work is supported by the Taiwan Ministry of Science and Technology: 106 -2633 -E-040 -001 - (2 -yrs, International Cooperation Project) Non-Conflict of Interest Statement.
Primary Messages Understand the increasing burden due to cancer poses a threat to human development. To assess the trends of Second Primary Cancers (SPCs) in Taiwan. To propose an Integrated Clinical Decision-making Scheme (ICDS) for Predicting the Risk Factors of SPCs. To demonstrate predicting SPCs in women with Endometrial Cancer in Taiwan and Thailand.
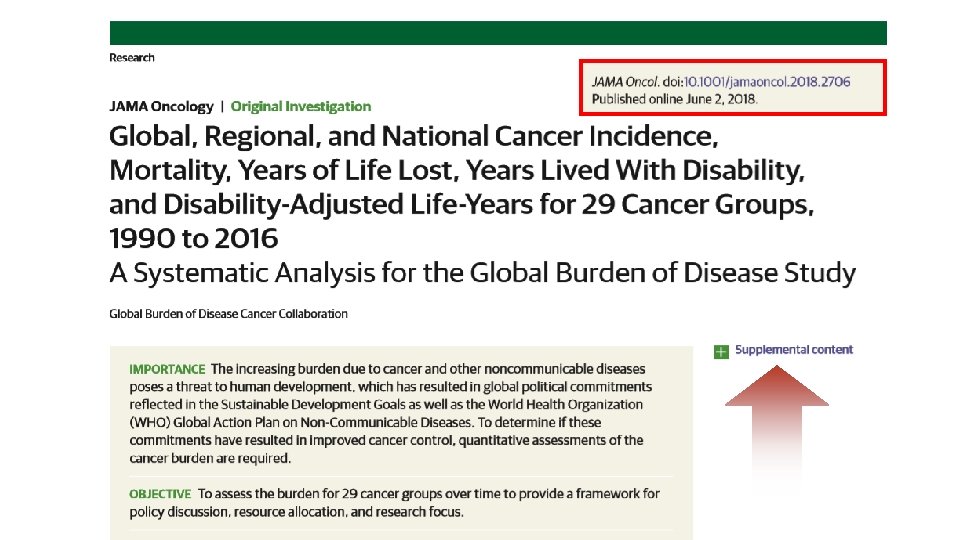
Cancer burden in the WORLD
wor ldw ide There were 17. 2 million cancer cases and 8. 9 million deaths in 2016 ide w d l r wo
prostate cancer (1. 4 million cases) breast cancer (1. 7 million cases) wor There were 17. 2 million cancer cases and 8. 9 million deaths in 2016 ldw ide w d l r wo
prostate cancer (1. 4 million cases) breast cancer (1. 7 million cases) wor There were 17. 2 million cancer cases and 8. 9 million deaths in 2016 ide w d l r wo ldw ide Cancer caused 213. 2 million DALYs globally for both sexes combined DALYs: disability-adjusted life-years
Cancer cases increased by 28% between 2006 and 2016 prostate cancer (1. 4 million cases) breast cancer (1. 7 million cases) wor There were 17. 2 million cancer cases and 8. 9 million deaths in 2016 ide w d l r wo ldw ide Cancer caused 213. 2 million DALYs globally for both sexes combined DALYs: disability-adjusted life-years
Cancer cases increased by 28% between 2006 and 2016 prostate cancer (1. 4 million cases) wor breast cancer (1. 7 million cases) There were 17. 2 million cancer cases and 8. 9 million deaths in 2016 ide w d l r wo ldw ide Cancer caused 213. 2 million DALYs globally for both sexes combined DALYs: disability-adjusted life-years IMPORTANCE The increasing burden due to cancer poses a threat to human development, …as well as the World Health Organization (WHO) Global Action Plan on Non-Communicable Diseases. To determine if these commitments have resulted in improved cancer control, quantitative assessments of the cancer burden are required.
Cancer burden in ASIA
Asia is the most diverse and populous continent; 4. 3 billion of the world’s 7. 1 billion people live here, and The population will increase by 1 billion by 2050.
Asia is the most diverse and populous continent; 4. 3 billion of the world’s 7. 1 billion people live here, and The population will increase by 1 billion by 2050. According to the WHO, Asia accounts for 60% of the world population and half the global burden of cancer. The incidence of cancer cases is estimated to increase from 7. 5 million in 2008 to 10. 6 million in 2030.
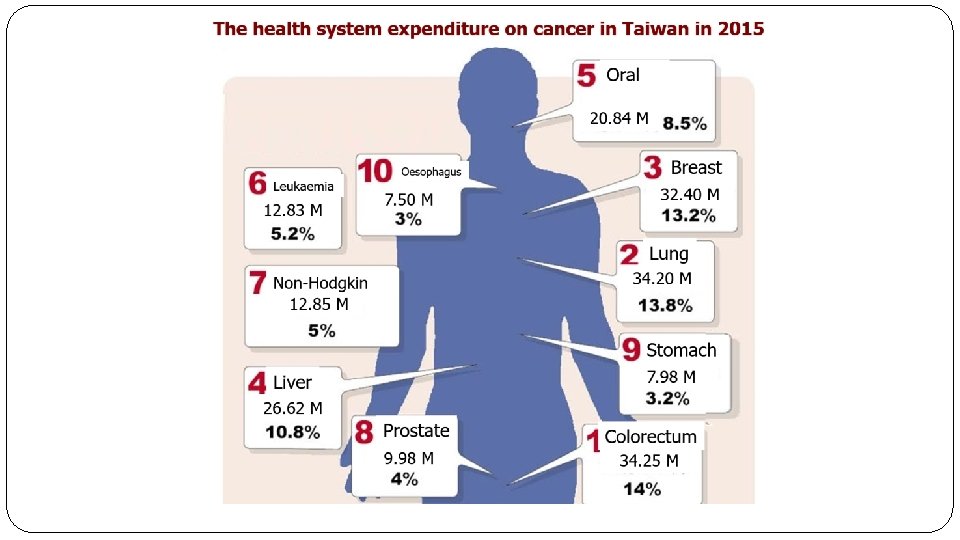
Cancer patterns and burden in Taiwan
Cancer patterns and burden in Taiwan The high effectiveness of cancer screening and therapies resulted in the increased diagnosis of SPCs in Taiwan. In Taiwan, among all cancer survivors, the 5 -year survival rate is ~55. 77% and By 2020, an estimation of 99, 491 new cases with cancer will be The 5 -year relative survival rate with stages (selected) (2011 -2015) diagnosed. Stage Breast CRC Oral Cervical I 97. 7 84. 6 80. 7 93. 5 II 95. 3 76. 2 68. 2 88. 8 III 92. 5 70. 2 62. 3 85. 6 IV 90. 0 66. 4 58. 6 83. 7 V 88. 1 63. 5 55. 5 82. 7 Data Source: Taiwan Cancer Registry
Cancer survivors: living longer, and now, better? +1. 41 M
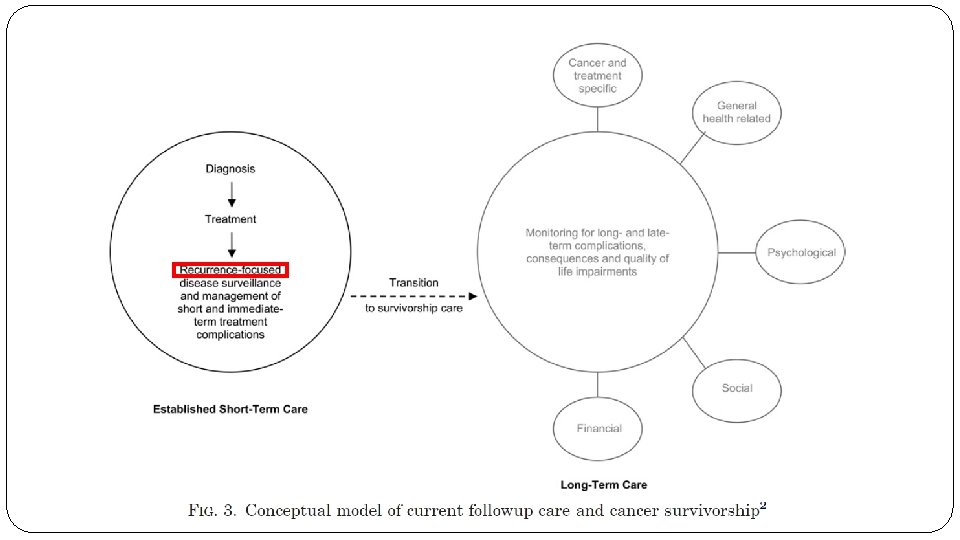
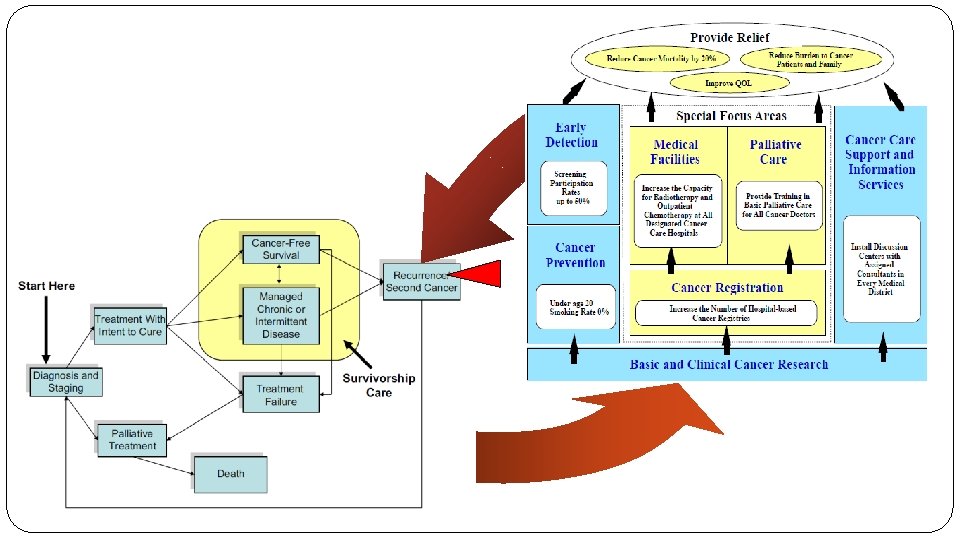
New paradigm: Comprehensive management of cancer Beyond prevention, diagnosis and treatment… Taking care of survivors
Figure 1. The cancer treatment trajectory with special identification of the post-treatment survivorship care phase.
Figure 1. The cancer treatment trajectory with special identification of the post-treatment survivorship care phase.
Figure 1. The cancer treatment trajectory with special identification of the post-treatment survivorship care phase.
JOURNAL PUBLICATIONS Wen-Chien Ting, Yen-Chiao (Angel) Lu, Chi-Jie Lu, Chalong Cheewakriangkrai, Chi-Chang * (2018). Recurrence Impact of Primary Site and Pathologic Stage in Patients Diagnosed with Colorectal Cancer. Journal of Quality, Vol. 25, No. 3, pp. 166 -184. Chih-Jen Tseng, Chi-Chang, Chi-Jie Lu, Chalong Cheewakriangkrai (2017, Jul). Integration of ensemble learning and data mining techniques to predict risk factors for recurrent ovarian cancer. Artificial Intelligence in Medicine, 78 (2017) 47 -54. Chien-Sheng Cheng, Pei-Wei Shueng, Chi-Chang*, Chi-Wen Kuo (2018) Adapting an Evidence-based Diagnostic Model for Predicting Recurrence Risk Factors of Oral Cancer, Journal of Universal Computer Science, vol. 24, no. 6, pp. 742 -752. Wen-Chien Ting, Yen-Chiao (Angel) Lu, Chi-Jie Lu, Chalong Cheewakriangkrai, Chi-Chang * (2018). Recurrence Impact of Primary Site and Pathologic Stage in Patients Diagnosed with Colorectal Cancer. Journal of Quality, Vol. 25, No. 3, pp. 166 -184 Chih-Jen Tseng, Chi-Chang*, Chi-Jie Lu (2017, Jul). Integration of ensemble learning and data mining techniques to predict risk factors for recurrent ovarian cancer. Artificial Intelligence in Medicine, 78 (2017) 47 -54. Chang Chi-Chang, Wen-Chien Ting, Ting Teng, Che-Hsin Hsu (2014) Evaluating the Accuracy of ensemble learning approaches for Prediction on Recurrent Colorectal Cancer, International Journal of Engineering and Innovative Technology, Vol. 3, Issue 10, pp. 19 -22 Chang Chi-Chang (2014) Bayesian Decision Analysis for Recurrent Cervical Cancer, Open Journal of Clinical Diagnostics, Vol. 4, No. 2, pp. 71 -76 Chih-Kuang Chang, Chi-Chang* (2014) Bayesian Imperfect Information Analysis for Clinical Recurrent Data, Therapeutics and Clinical Risk Management, Vol. 2015: 11, pp. 17 -26. Chang Chi-Chang, Chih-Jen Tseng, Ting-Huan Chang*, Chiu-Hsiang Lee (2014, Nov). Bayesian Decision Analysis for
JOURNAL PUBLICATIONS Wen-Chien Ting, Yen-Chiao (Angel) Lu, Chi-Jie Lu, Chalong Cheewakriangkrai, Chi-Chang * (2018). Recurrence Impact of Primary Site and Pathologic Stage in Patients Diagnosed with Colorectal Cancer. Journal of Quality, Vol. 25, No. 3, pp. 166 -184. Chih-Jen Tseng, Chi-Chang, Chi-Jie Lu, Chalong Cheewakriangkrai (2017, Jul). Integration of ensemble learning and data mining techniques to predict risk factors for recurrent ovarian cancer. Artificial Intelligence in Medicine, 78 (2017) 47 -54. Chien-Sheng Cheng, Pei-Wei Shueng, Chi-Chang*, Chi-Wen Kuo (2018) Adapting an Evidence-based Diagnostic Model for Predicting Recurrence Risk Factors of Oral Cancer, Journal of Universal Computer Science, vol. 24, no. 6, pp. 742 -752. Wen-Chien Ting, Yen-Chiao (Angel) Lu, Chi-Jie Lu, Chalong Cheewakriangkrai, Chi-Chang * (2018). Recurrence Impact of Primary Site and Pathologic Stage in Patients Diagnosed with Colorectal Cancer. Journal of Quality, Vol. 25, No. 3, pp. 166 -184 Chih-Jen Tseng, Chi-Chang*, Chi-Jie Lu (2017, Jul). Integration of ensemble learning and data mining techniques to predict risk factors for recurrent ovarian cancer. Artificial Intelligence in Medicine, 78 (2017) 47 -54. Chang Chi-Chang, Wen-Chien Ting, Ting Teng, Che-Hsin Hsu (2014) Evaluating the Accuracy of ensemble learning approaches for Prediction on Recurrent Colorectal Cancer, International Journal of Engineering and Innovative Technology, Vol. 3, Issue 10, pp. 19 -22 Chang Chi-Chang (2014) Bayesian Decision Analysis for Recurrent Cervical Cancer, Open Journal of Clinical Diagnostics, Vol. 4, No. 2, pp. 71 -76 Chih-Kuang Chang, Chi-Chang* (2014) Bayesian Imperfect Information Analysis for Clinical Recurrent Data, Therapeutics and Clinical Risk Management, Vol. 2015: 11, pp. 17 -26. Chang Chi-Chang, Chih-Jen Tseng, Ting-Huan Chang*, Chiu-Hsiang Lee (2014, Nov). Bayesian Decision Analysis for
Second Primary Cancers (SPCs) SPCs can reflect the result of early detection, supportive care, and advanced radiological and chemical treatments. Previous studies indicated that the prevalence of Second Primary Cancers (SPCs) ranged between 0. 73% and 11. 7%. Nevertheless, the clinical correlation of SPCs has not yet been clarified in Taiwan. From Travis LB. Acta Oncologica 2002; 41: 323 -333.
Taiwan Cancer Registry (TCR) Cancer registration provides core information for cancer surveillance and control. The population based Taiwan Cancer Registry was implemented in 1979. After the Cancer Control Act was promulgated in 2003, the completeness (97%) and data quality of cancer registry database has achieved at an excellent level. The Taiwan Cancer Registry has run smoothly for >30 years, which provides essential foundation for academic research TCR
A Nationwide Retrospective Analysis of Second Primary Cancers in Taiwan: 1996 -2010 From 1996 to 2010, a total of 994, 734 patients was screened and obtained retrospectively from the Taiwan Cancer Registry. We quantified the clinical characteristics and the most common cancer pairs of SPCs using statistical and epidemiological indicators. 1996 2010
Summary information Both sexes Second Cancer Negative Positive exist Unkown Total Year(First cancer diagnosis year) 1996 39123 90. 31 4198 9. 69 3923 1997 43163 90. 33 4623 9. 67 4313 1998 47304 89. 81 5367 10. 19 4704 1999 51596 90. 07 5687 9. 93 5156 2000 53376 89. 73 6109 10. 27 5336 2001 54502 90. 1 5988 9. 90 5402 2002 57636 90. 57 6001 9. 43 5766 2003 56800 90. 68 5839 9. 32 5600 2004 63350 89. 99 7044 10. 01 6330 2005 64486 90. 52 6756 9. 48 6486 2006 67820 90. 79 6879 9. 21 6820 2007 70639 90. 57 7351 9. 43 7639 2008 71948 90. 77 7312 9. 23 7148 2009 77018 90. 39 8187 9. 61 7018 2010 80509 90. 84 8123 9. 16 8009 90. 31 923 90. 31 43321 90. 33 413 90. 33 47786 89. 81 404 89. 81 52671 90. 07 516 90. 07 57283 89. 73 336 89. 73 59485 90. 1 542 90. 1 60490 90. 57 576 90. 57 63637 90. 68 500 90. 68 62639 89. 99 330 89. 99 70394 90. 52 486 90. 52 71242 90. 79 820 90. 79 74699 90. 57 739 90. 57 77990 90. 77 748 90. 77 79260 90. 39 708 90. 39 85205 90. 84 209 90. 84 88632 Total 899270 95464 899270 994734 Male Second Cancer Negative Positive Total Year(First cancer diagnosis year) 1996 21109 90. 25 2281 9. 75 1997 22874 90. 24 2475 9. 76 1998 24998 89. 54 2920 10. 46 1999 27112 89. 75 3095 10. 25 2000 28188 89. 4 3343 10. 60 2001 29032 89. 8 3299 10. 20 2002 30976 89. 93 3470 10. 07 2003 30772 89. 84 3480 10. 16 2004 33618 89 4154 11. 00 2005 34212 89. 71 3926 10. 29 2006 36097 89. 91 4052 10. 09 2007 37724 89. 66 4349 10. 34 2008 38210 89. 99 4249 10. 01 2009 40462 89. 43 4780 10. 57 2010 42152 89. 65 4868 10. 35 Total 477536 23390 25349 27918 30207 31531 32331 34446 34252 37772 38138 40149 42073 42459 45242 47020 532277 2006 31723 91. 82 2827 8. 18 34550 2007 32915 91. 64 3002 8. 36 35917 2008 33738 91. 68 3063 8. 32 36801 2009 36556 91. 47 3407 8. 53 39963 2010 38357 92. 18 3255 7. 82 41612 Total 421734 54741 Female Second Cancer Negative Positive Total Year(First cancer diagnosis year) 1996 18014 90. 38 1917 9. 62 19931 1997 20289 90. 43 2148 9. 57 22437 1998 22306 90. 11 2447 9. 89 24753 1999 24484 90. 43 2592 9. 57 27076 2000 25188 90. 11 2766 9. 89 27954 2001 25470 90. 45 2689 9. 55 28159 2002 26660 91. 33 2531 8. 67 29191 2003 26028 91. 69 2359 8. 31 28387 2004 29732 91. 14 2890 8. 86 32622 2005 30274 91. 45 2830 8. 55 33104 40723 462457
Summary information No. Cases 9000 不分性別 男性個數 女性個數 Both Male Female 8000 7000 6000 5000 4000 3000 2000 1000 Year 0 1996 1997 1998 1999 2000 2001 2002 2003 2004 2005 2006 2007 2008 2009 2010
The Frequent Types of Secondary Cancer Both sexes Second cancer First cancer 140_9 Oral cancer 151 Gastric cancer 153_4 Colorect al cancer 155 Liver cancer 162 Lung cancer 174 Breast cancer 180 Cervical cancer 182 Endometri al cancer 183 Ovarian cancer 185 Prostate cancer Total 140_9 Oral cancer 151 Gastric 153_4 Colorec 155 162 cancer tal cancer Liver cancer Lung cancer 174 Breast cancer 180 Cervical 182 Endo 183 Ovaria 185 Prostate Other cancer metrial n cancer 5932 161 481 626 823 55 26 5 8 132 3236 10. 23 0. 28 0. 83 1. 08 1. 42 0. 09 0. 04 0. 01 0. 23 5. 58 113 147 672 458 416 99 64 18 25 229 1293 0. 23 0. 3 1. 36 0. 93 0. 84 0. 2 0. 13 0. 04 0. 05 0. 46 2. 61 302 673 9494 1289 1405 495 286 168 115 716 2878 0. 24 0. 54 7. 64 1. 04 1. 13 0. 4 0. 23 0. 14 0. 09 0. 58 2. 32 343 385 787 718 600 162 100 11 28 265 2458 0. 26 0. 29 0. 54 0. 45 0. 12 0. 07 0. 01 0. 02 0. 2 1. 83 132 192 437 365 1577 168 69 21 30 228 1326 0. 12 0. 17 0. 4 0. 33 1. 43 0. 15 0. 06 0. 02 0. 03 0. 21 1. 2 87 244 916 462 712 2333 578 523 224 0 1724 0. 09 0. 26 0. 96 0. 49 0. 75 2. 46 0. 61 0. 55 0. 24 0 1. 82 94 240 1016 563 828 1222 908 435 186 0 2333 0. 11 0. 28 1. 2 0. 67 0. 98 1. 45 1. 07 0. 51 0. 22 0 2. 76 13 34 189 65 132 218 272 112 264 0 299 0. 1 0. 27 1. 51 0. 52 1. 05 1. 74 2. 17 0. 89 2. 11 0 2. 39 6 46 166 30 80 157 79 198 94 0 233 0. 05 0. 38 1. 35 0. 24 0. 65 1. 28 0. 64 1. 62 0. 77 0 1. 9 100 352 876 476 784 0 0 45 1674 0. 27 0. 94 2. 35 1. 28 2. 1 0 0 0. 12 4. 49 7122 2474 15034 5052 7357 4909 2382 1491 974 1615 17454 Have second cancer 8249 No second cancer 46519 Total 58004 80. 2 2241 45938 49472 92. 86 14943 106425 124246 85. 66 3399 128328 134185 95. 64 3219 105538 110083 95. 87 6079 87135 94938 91. 78 5492 76707 84532 90. 74 1299 10918 12516 87. 23 856 11168 12257 91. 12 2633 32968 37275 88. 45 48410 651644 717508
The Distribution of Cancer Pairs (Female) Female Second cancer First cancer 140_9 Oral cancer 151 Gastric cancer 153_4 Colorecta l cancer 155 Liver cancer 162 Lung cancer 174 Breast cancer 180 Cervical cancer 182 Endometria l cancer 183 Ovarian cancer Total 140_9 Oral cancer 151 Gastric cancer 153_4 Colorect 155 al cancer Liver cancer 162 Lung cancer 174 Breast cancer 180 Cervical cancer 182 Endom 183 Ovarian Have second etrial cancer 317 16 41 28 56 55 26 5 8 6. 44 0. 32 0. 83 0. 57 1. 14 1. 12 0. 53 0. 16 6 50 219 98 86 99 64 18 25 0. 03 0. 29 1. 27 0. 58 0. 37 0. 15 42 235 3767 384 443 495 286 168 115 0. 08 0. 44 7. 11 0. 72 0. 84 0. 93 0. 54 0. 32 0. 22 13 83 233 228 124 162 100 11 28 0. 03 0. 22 0. 61 0. 33 0. 43 0. 27 0. 03 0. 07 12 32 119 76 532 168 69 21 30 0. 03 0. 09 0. 33 0. 21 1. 46 0. 19 0. 06 0. 08 87 244 916 462 712 2333 578 523 224 0. 09 0. 26 0. 96 0. 49 0. 75 2. 46 0. 61 0. 55 0. 24 94 240 1016 563 828 1222 908 435 186 0. 11 0. 28 1. 2 0. 67 0. 98 1. 45 1. 07 0. 51 0. 22 13 34 189 65 132 218 272 112 264 0. 1 0. 27 1. 51 0. 52 1. 05 1. 74 2. 17 0. 89 2. 11 6 46 166 30 80 157 79 198 94 0. 05 0. 38 1. 35 0. 24 0. 65 1. 28 0. 64 1. 62 590 980 6666 1934 2993 4909 2382 1491 1 2 3 552 665 5935 982 1059 6079 5492 1299 856 0. 77 974 22919 No second cancer Other cancer 4139 234 84. 04 4. 75 16204 319 94. 28 1. 86 46078 967 86. 97 1. 83 35648 759 95. 34 2. 03 34859 407 95. 96 1. 12 87135 1724 91. 78 1. 82 76707 2333 90. 74 2. 76 10918 299 87. 23 2. 39 11168 233 91. 12 1. 9 322856 7275 Total 4925 17188 52980 37389 36325 94938 84532 12516 12257 353050
Synchronous versus Metachronous (both sexes) Both Male & Female First and second caner (6 months as a dividing line) synchronous metachronous No second cancer Total Year(First cancer diagnosis year) 1996 1997 1998 1999 2000 2001 2002 2003 2004 2005 2006 2007 2008 2009 2010 981 1127 1450 1679 1816 1715 1629 1703 2337 2247 2336 2657 2872 3892 4171 2. 26 2. 36 2. 75 2. 93 3. 05 2. 84 2. 56 2. 72 3. 32 3. 15 3. 13 3. 41 3. 62 4. 57 4. 71 3217 3496 3917 4008 4293 4273 4372 4136 4707 4509 4543 4694 4440 4295 3952 7. 43 7. 32 7. 44 7 7. 22 7. 06 6. 87 6. 69 6. 33 6. 08 6. 02 5. 6 5. 04 4. 46 39123 43163 47304 51596 53376 54502 57636 56800 63350 64486 67820 70639 71948 77018 90. 31 90. 33 89. 81 90. 07 89. 73 90. 1 90. 57 90. 68 89. 99 90. 52 90. 79 90. 57 90. 77 90. 39 43321 47786 52671 57283 59485 60490 63637 62639 70394 71242 74699 77990 79260 85205 5000 Total 32612 62852 80509 899270 90. 84 88632 994734 8 4500 7 4000 6 3500 5 3000 synchronous 2500 4 Metachronous Probability of Synchronous 2000 3 1500 2 1000 1 500 0 1996 1997 1998 1999 2000 2001 2002 2003 2004 2005 2006 2007 2008 2009 2010 0 Probability of Metachronous
Due to early detection, effective therapies and appropriate intervention the probability of SPCs in the same patient has increased. Indeed, the cancer registries can help us understand the disease better and use our resources to the best effect in the prevention and treatment of SPCs. Based on these findings, further analysis the risk factors of the relationship between them is worthwhile.
Preliminary Study We quantify the clinical characteristics, develop a predictive model and identify related risk factors for the SPC of patients with endometrial cancer. The dataset is difficult to predict because the data in different classes are mixed together and there are class imbalance problem. The proposed an Integrated Clinical Decision-making Scheme (ICDS) which introduces different strategies for increasing the prediction performance and then auto-select a strategy combination to improve classification performance using a Taguchi Design of Experiment (DOE).
Preliminary Study We quantify the clinical characteristics, develop a predictive model and identify related risk factors for the SPC of patients with endometrial cancer. The dataset is difficult to predict because the data in different classes are mixed together and there are class imbalance problem. The proposed an Integrated Clinical Decision-making Scheme (ICDS) which introduces different strategies for increasing the prediction performance and then auto-select a strategy combination to improve classification performance using a Taguchi Design of Experiment (DOE).
Preliminary Study We quantify the clinical characteristics, develop a predictive model and identify related risk factors for the SPC of patients with endometrial cancer. The dataset is difficult to predict because the data in different classes are mixed together and there are class imbalance problem. The proposed an Integrated Clinical Decision-making Scheme (ICDS) which introduces different strategies for increasing the prediction performance and then auto-select a strategy combination to improve classification performance using a Taguchi Design of Experiment (DOE).
Integrated Clinical Decision-making Design Ensemble Learning ü classification and regression tree (CART) ü e. Xtreme gradient boosting (XGBOOST) Basic Classification Flowchart Balanced Metric ü training a classifier ü exploring risk factors Features Extraction ü accuracy ü area under curve (AUC) ü correspondence analysis (CA) ü original features Taguchi Method Cross-validation ü selecting strategy combination ü reducing experiment times ü searching hyper-parameters ü k-fold cross-validation Resampling ü upsampling ü without doing resampling Clustering ü k-means or expectation maximization (EM) ü without doing clustering
Basic Flowchart of Classification • In the proposed model, we first divide the originally dataset into training data and testing data with a specific percentage.
Strategies for Improving Balanced Accuracy Transformation: to transform original feature space into other lower dimensional space. Yu, Chum and Sim (2014); Nasution, Sitompul and Ramli (2018) Resampling: to balance the number of cases in each class. Jishan, Rashu, Haque and Rahman (2015); Yan, Qian, Guan and Zheng (2016); Bennin, Keung, Phannachitta, Monden and Mensah (2017) Clustering: to group similar cases in advance. Kyriakopoulou and Kalamboukis (2008); Yong, Youwen and Shixiong (2009); Trivedi, Pardos and Heffernan (2015); Alapati and Sindhu (2016) Ensemble Learning: to stack different kinds of classifiers. Ozcift and Gulten (2011); Yerima, Sezer and Muttik (2015); Abouelnaga, Ali, Rady and Moustafa (2016)
The Integrated Clinical Decision-making Scheme (ICDS) Random Search or Cross-validation k-folds Cross Validation Hyperparameters 1 Hyperparameters 2 metric 21 … … Testing Data Feature Extraction & Data Preprocess metricm 2 … … x 1 x 2 … xp y metricm 1 … … Modelm Avg metric 2 k … … Database … metric 22 Hyperparametersm Avg metric 1 k … Model 2 … Select a Predicting Model … Training Data Feature Extraction & Data Preprocess metric 12 … metric 11 x 2 … xp y … … Model 1 … Choose a set of best hyper-parameters Avg metricm Hyperparameters* metricmk x Best Model y ŷ 1. Confusion Matrix 2. Variable Important 3. Tree or Rules
k-folds Cross Validation Random Search eta 1 max_depth 1 gamma 1 … Bal. Acc 11 PC 2 … PCl y XGBOOST Bal. Acc 12 eta 2 max_depth 2 gamma 2 … Bal. Acc 21 Avg Bal. Acc 2 … Bal. Accm 1 … … … Testing Data Feature Extraction & Principle Component Analysis … PC 1 PC 2 … PCl y Avg Bal. Acc 1 Bal. Acc 2 k … … Modelm … Bal. Acc 22 etam max_depthm gammam … Database Choose a set of best hyper-parameters Bal. Acc 1 k … Model 2 … … Training Data Feature Extraction & Principle Component Analysis … … Model 1 … … PCA Transformation is introduced Avg Bal. Accm eta* max_depth* gamma* … Bal. Accmk PC Best Model y ŷ 1. Confusion Matrix 2. Variable Important
eta 1 max_depth 1 gamma 1 … … … Model 1 … … Oversampling is introduced k-folds Cross Validation Random Search Choose a set of best hyper-parameters Avg Bal. Acc 1 x 2 … xp y Bal. Acc 11 XGBOOST eta 2 max_depth 2 gamma 2 … Bal. Acc 21 Feature Extraction … Testing Data … … Bal. Accm 2 … … … x 1 x 2 … xp y Avg Bal. Acc 2 k … … Bal. Accm 1 Modelm … Bal. Acc 22 etam max_depthm gammam … Database Bal. Acc 1 k … Model 2 … … Training Data Feature Extraction & Resampling Bal. Acc 12 Avg Bal. Accm eta* max_depth* gamma* … Bal. Accmk x Best Model y ŷ 1. Confusion Matrix 2. Variable Important
k-folds Cross Validation Random Search eta 1 max_depth 1 gamma 1 … Bal. Acc 11 x 2 … xp c 1 c 2 … y XGBOOST Bal. Acc 12 eta 2 max_depth 2 gamma 2 … Bal. Acc 21 Feature Extraction & Allocation … Testing Data … … Bal. Accm 2 … … … x 1 x 2 … xp c 1 c 2 … y Avg Bal. Acc 2 k … … Bal. Accm 1 Modelm … Bal. Acc 22 etam max_depthm gammam … Database Avg Bal. Acc 1 k … Model 2 … … Training Data Feature Extraction & Clustering … … Model 1 … … Clustering is introduced Choose a set of best hyper-parameters Avg Bal. Accm eta* max_depth* gamma* … Bal. Accmk x Best Model y ŷ 1. Confusion Matrix 2. Variable Important
eta 1 max_depth 1 gamma 1 … XGBOOST Bal. Acc 12 eta 2 max_depth 2 gamma 2 … Avg Bal. Acc 1 k … … Model 2 … … Training Data … … Bal. Acc 11 … Model 1 x 2 … xp y Feature Extraction & Data Preprocess … Using XGBOOST as the Base Learner Choose a set of best hyper-parameters k-folds Cross Validation Random Search Avg Bal. Acc 2 The base learner we considered is using Bal. Acc 21 Bal. Acc 22 Bal. Acc 2 k … … … e. Xtreme Gradient Boosting (XGBOOST). XGBOOST is regarded … as the master piece for Kaggle. In u etam max_depthm gammam … … m eta* max_depth* gamma* … x 1 x 2 … xp y Testing Data … Modelm Feature Extraction & Data Preprocess Avg 2015, 17 out of 29 Kaggle Champion teams used this Bal. Acc classifier to win their titles. Bal. Acc Many categorical or ordered variables in our dataset. x distribution assumption is needed. Best No data Model Tree-based methods often perform well on imbalanced datasets because their hierarchical structure allows them y ŷ to learn signals from classes. … Database m 1 u u u m 2 mk Package xgboost in Python; Package caret in R. 1. Confusion Matrix 2. Variable Important 3. Tree or Rules
k-folds Cross Validation Random Search eta 1 max_depth 1 gamma 1 … Bal. Acc 11 x 2 … xp y XGBOOST Bal. Acc 12 eta 2 max_depth 2 gamma 2 … Bal. Acc 21 … Testing Data Feature Extraction & Data Preprocess … … Bal. Accm 2 … … … x 1 x 2 … xp y Avg Bal. Acc 2 k … … Bal. Accm 1 Modelm … Bal. Acc 22 etam max_depthm gammam … Database Avg Bal. Acc 1 k … Model 2 … … Training Data Feature Extraction & Data Preprocess … … Model 1 … … Setting of XGBOOST Choose a set of best hyper-parameters Avg Bal. Accm eta* max_depth* gamma* … Bal. Accmk x Best Model y ŷ 1. Confusion Matrix 2. Variable Important 3. Tree or Rules
Random Search eta 1 max_depth 1 gamma 1 … XGBOOST Avg Bal. Acc 2 Avg Bal. Accm Avg Bal. Acc 2 Bal. Accmk … … … Bal. Accm 2 … … … Bal. Accm 1 subclass* Bal. Acc 2 k … … Mm … Bal. Acc 22 subclassm Avg Bal. Acc 1 k … Bal. Acc 21 GLM ŷ … Bal. Acc 12 … … M 2 Best Model 2 … … subclass 2 Testing Data size* l 2 reg* lambda* … Bal. Accmk … … … Bal. Acc 11 Feature Extraction & Data Preprocess Avg Bal. Acc 1 … … M 1 x 2 … xp y Avg Bal. Accm … … … Bal. Accm 2 subclass 1 MDA … … Bal. Accm 1 Database Best Model 1 Bal. Acc 2 k … … Mm … Bal. Acc 22 sizem l 2 regm lambdam … Avg Bal. Acc 2 Bal. Acc 1 k … Bal. Acc 21 … … M 2 … Bal. Acc 12 size 2 l 2 reg 2 lambda 2 … eta* max_depth* gamma* … Bal. Accmk … MLP … Bal. Acc 11 … … M 1 … Bal. Accm 2 size 1 l 2 reg 1 lambda 1 … … … Bal. Accm 1 Avg Bal. Acc 1 Bal. Acc 2 k … … … Feature Extraction & Data Preprocess Mm … Bal. Acc 22 eta m max_depthm gammam … Choose a set of best hyper-parameters Bal. Acc 1 k … … Training Data … Bal. Acc 21 x 2 … xp y Bal. Acc 12 eta 2 max_depth 2 gamma 2 … M 2 … … Bal. Acc 11 … M 1 … Stacking ensemble is introduced k-folds Cross Validation Avg Bal. Accm Best Modelq x y Confusion Matrix
k-folds Cross Validation Grid Search eta 1 max_depth 1 gamma 1 … Bal. Acc 11 x 2 … xp y Testing Data Feature Extraction & Data Preprocess … Bal. Accm 2 … … Bal. Accm 1 Avg Bal. Acc 2 k … … x 1 x 2 … xp y … etam max_depthm gammam … Modelm … Bal. Acc 22 … Database Bal. Acc 21 Avg Bal. Acc 1 k … … Evaluation metric: accuracy, AUC Model 2 … metric or not? eta 2 max_depth 2 gamma 2 … … To try to select a best model by a balanced Bal. Acc 12 … Tree-based Classifier … Training Data Feature Extraction & Data Preprocess … … Model 1 … … Balanced Metric is introduced Choose a set of best hyper-parameters Avg Bal. Accm eta* max_depth* gamma* … Bal. Accmk x Best Model y ŷ 1. Confusion Matrix 2. Variable Important 3. Tree or Rules
Choosing the Best Strategy Combination • Different strategies can be used to improve the accuracy • However, no specified strategy combination is proved to be the best, it depends on dataset you have • Too many experiments need to be carried out. • A systematic Taguchi design of experiments (DOE) Ensemble Learning v Balanced Metric Ensemble Learning Resampling v Ensemble Learning Balanced Metric Ensemble Learning Clustering Ensemble Learning Balanced Metric Ensemble Learning no Resampling Ensemble Learning v Balanced Metric Training Data Ensemble Learning Feature Extraction v Ensemble Learning Balanced Metric Ensemble Learning yes Resampling Ensemble Learning Balanced Metric Ensemble Learning v v Clustering Ensemble Learning Balanced Metric Ensemble Learning Resampling Ensemble Learning Balanced Metric Ensemble Learning v v
Stage The design matrix for 25 DOE A: Feature Extraction 0 0 0 0 1 1 1 1 D: B: C: Balanced Clustering Resampling Metric 0 0 0 0 1 0 0 1 0 0 1 1 1 0 0 1 0 1 1 0 1 1 1 1 1 1 E: Ensemble Learning 0 1 0 1 0 1 0 1 The Taguchi’s Orthogonal Arrays for L 8(25) DOE A: Feature Extraction 0 0 1 1 D: B: C: Balanced Clustering Resampling Metric 0 0 0 1 1 1 0 1 0 0 1 1 1 0 0 1 E: Ensemble Learning 0 1 1 0 32→ 8 0 means the strategy is not used; 1 means the strategy is used.
The Procedure of Taguchi DOE Prepare a Taguchi’s orthogonal arrays for L 8(25) DOE Build model and evaluate validation performance for each strategy combination Select strategy combination using ANOVA and main effects plot Evaluate testing performance and show variable importance
Empirical Study Taiwan’ dataset: The 599 records and pathologic status provided by Taiwan’s hospitals. The cases with endometrial cancer and then suffer from the SPC (54) is far less than that are not suffering (545). Thailand’s dataset: The 788 records and pathologic status provided by Thailand’s hospitals. The cases with endometrial cancer and then suffer from the SPC (43) is far less than that are not suffering (745). Serious class imbalance problem and class mixed problem. The dataset is randomly divided by 60% and 40% with respective to the training and testing dataset.
Taiwan’ dataset The Results before ICDS is Conducted Confusion Matrix and Statistics Reference no: without SPC Prediction no yes: with SPC no 217 21 yes 0 0 Accuracy= Accuracy: 0. 9118 (217+0)/(217+0+21+0 ) Sensitivity= Sensitivity: 1. 0000 (217)/(217+0) Specificity= Specificity: 0. 0000 (0)/(21+0)) Balanced Accuracy= (sensitivity+specificity) Balanced Accuracy: 0. 5 ● No ● Yes /2 We get an accuracy of confusion matrix and realize that majority class is 91. 18% of the total data and all cases are classified as majority class.
Taiwan’ dataset Step 1: Prepare a Taguchi’s orthogonal arrays for L 8(25) DOE The design matrix for L 8(25) DOE A: Feature Extraction 0 0 1 1 B: C: Clustering Resampling 0 0 1 1 0 0 D: Balanced Metric E: Ensemble Learning 0 1 0 1 0 1 1 0 0 means the strategy is not used; 1 means the strategy is used.
Taiwan’ dataset Step 2: Build model and evaluate validation performance for each strategy combination A: Feature Extraction B: C: Clustering Resampling D: Balanced Metric E: Ensemble Learning validation accuracy validation balanced accuracy 0 0 0. 900 0. 531 0 0 0 1 1 0. 910 0. 546 0 1 1 0 0 0. 716 0. 613 0 1 1 0. 820 0. 638 1 0 1 0. 820 0. 596 1 0 1 1 0 0. 508 0. 621 1 1 0 0 1 0. 919 0. 572 1 1 0 0. 912 0. 571
Taiwan’ dataset Step 3: Select strategy combination using ANOVA and main effects plot Estimated Model Coefficients fo Means Term Constant Feature Extraction Coef 0. 585806 -0. 003841 -0. 012452 Clustering -0. 031046 Resampling Balanced Metric -0. 007989 Ensemble Learning -0. 001855 R-sq = 98. 00% R-sq(adj) = 93. 00% SE Coef 0. 003500 T 167. 368 -1. 097 -3. 558 -8. 870 -2. 282 -0. 530 P 0. 000 0. 387 0. 071 0. 012 0. 150 0. 649 Main effects plot Clustering and Resampling strategy combination are suggested! 0 1 0 1
Taiwan’ dataset Step 4: Evaluate testing performance and show variable importance The proposed scheme auto-select the strategies of clustering and resampling to be our based learner in which classification accuracy is 68. 07%, sensitivity is 72. 81%, and specificity is 19. 04%. Our findings suggest that Tumor. size, cluster label, Age, Sequence of Local regional Therapy and Systemic Therapy, and Combined Stage are relatively more important risk factors related to the endometrial SPC. Variable Importance Tumor. size clusterlabel AGE Sequence of Locoregional Therapy and. . . Combined Stage BMI o. Dose to CTV_H Chemotherapy m. RT surgery Sequence of RT and Surgery Date of RT Started v. Betel Nut Histology Date of first surgical procedure Grade/Differentiation w. Drinking u. Smoking r. Num to CTV_L q. Dose to CTV_L p. Num to CTV_H Behavior Code 0 0. 05 0. 15 0. 2
Thailand’ dataset The Results before ICDS is Conducted Confusion Matrix and Statistics Reference Prediction no yes Sensitivity= (298)/(298+0) Balanced Accuracy= (sensitivity+specificity) /2 no: without SPC yes: with SPC 298 17 0 0 Accuracy: 0. 9450 Sensitivity: 1. 0000 Specificity: 0. 0000 Accuracy= (298+0)/(298+0+17+0 ) Specificity= (0)/(17+0)) Balanced Accuracy: 0. 5 All cases are also classified as majority class! ● No ● Yes
Thailand’ dataset Step 1: Prepare a Taguchi’s orthogonal arrays for L 8(25) DOE The design matrix for L 8(25) DOE A: Feature Extraction 0 0 1 1 B: C: Clustering Resampling 0 0 1 1 0 0 D: Balanced Metric E: Ensemble Learning 0 1 0 1 0 1 1 0 0 means the strategy is not used; 1 means the strategy is used.
Thailand’ dataset Step 2: Build model and evaluate validation performance for each strategy combination A: Feature Extraction 0 0 1 1 B: C: Clustering Resampling 0 0 1 1 0 0 D: Balanced Metric E: Ensemble Learning 0 1 0 1 0 1 1 0 validation accuracy 0. 9453 0. 9459 0. 9453 0. 9477 0. 7189 0. 7087 0. 7069 0. 7291 validation balanced accuracy 0. 497 0. 500 0. 584 0. 673 0. 519 0. 525 0. 500
Thailand’ dataset Step 3: Select strategy combination using ANOVA and main effects plot Estimated Model Coefficients fo Means Term Coef Constant 0. 53733 Feature Extraction 0. 02625 Clustering -0. 02700 Resampling -0. 03807 Balanced Metric -0. 01221 Ensemble Learning -0. 01068 R-sq = 98. 00% R-sq(adj) = 93. 00% SE Coef 0. 01073 T 50. 076 2. 447 -2. 516 -3. 548 -1. 138 -0. 995 P 0. 000 0. 134 0. 128 0. 071 0. 373 0. 425 Main effects plot Clustering and Resampling strategy combination is suggested! 0 1 0 1
Thailand’ dataset Step 4: Evaluate testing performance and show variable importance The proposed scheme auto-select the strategies of clustering and resampling to be our based learner in which classification accuracy is 84. 76%, sensitivity is 87. 58%, and specificity is 35. 29%. Our findings suggest that AGE, Menopuasal. status, adj. chemo, Histology, Grade_Differentiation, and BMI are relatively more important risk factors related to the endometrial SPC. Variable Importance AGE Menopuasal. status adj. chemo Histology Grade_Differentiation BMI Dyslipidemia Tumor. size site. recur Distant. metastatic radiation. Therapy Hypertension response. of. prim. Px Diabetes Smoking Date. of. Surgical. . Staging Surgical. Margins clusterlabel Hx. Familial. cancers Site. of. residual 0 0. 05 0. 15 0. 2
Conclusion The prediction of SPCs are still a tough clinical challenge, the levels of specificity are still low for both datasets. More features, more cases and more strategies may help to improve the prediction performance. Power Computing Server
Conclusion The prediction of SPCs are still a tough clinical challenge, the levels of specificity are still low for both datasets. More features, more cases and more strategies may help to improve the prediction performance. Power Computing Server
• Core ecosystem: Individuals and technologies assemble the data that is required, analyze the data to generate insights, and determine actions based on these insights to achieve business outcomes. • Extended ecosystem: Individuals, groups, and systems direct the analytics projects, collaborate with the core team, provide raw data, consume the outputs, and act on the insights. • External ecosystem: Customers, business partners, vendors, data providers, and consumers interact with the organization to help deliver the full potential of big data goals. Figure The Cancer Clinical Data ecosystem https: //www. ibmbigdatahub. com/blog/going-beyond-data-science-toward-analytics-ecosystem-part-2
Cancer Registry Core Analytics Ecosystem Data steward The data steward is responsible for ensuring the quality, integrity, and governance of data. Data stewards confirm that policies and procedures concerning the acquisition, access, dissemination, and disposition of data are in place. Analytics architect A key responsibility for this role is to operationalize analytics beyond discovery and experimentation. Operationalizing analytics means insights that are discovered—perhaps in a snapshot data extract—can be implemented using a live data feed from operational data sources. Conversely, an analytics architect helps ensure insights are acted upon by feeding these insights back to enhance the business processes Figure Second-generation tools supporting collaborative efforts
Conclusion The treatments of SPCs are still a tough clinical challenge. Recent years have seen greater emphasis on an evidence-based approach, which the available evidence comes from different sources methods are required that can synthesis all of the evidence. In recent years more and more attention is paid to interdisciplinary research (IDR) and its possible impact to development of sciences. The best interest of the patient is only to be
Analytics is the science of using data to build model help decision
Analytics is the science of using data to build model help decision and add value
CFP: Special Issues 1. International Journal of Medical Sciences (IF 2. 284) 2. Journal of Universal Computer Science (IF 1. 066) Prof. Chi-Chang Chung-Shan Medical University, Taiwan changintw@gmail. com mdecisionlab
CFP: Conferences
Thank You