Qing David Karger The Question How can regular


 – Each has properties * Title * Source magazine *")
 Map Timeline Bar")


")


- Slides: 82
Qing David Karger
The Question How can regular users better manage information?
The Context • Documents – Total flexibility to create and view – But no structured data processing • Applications – Structure data – Powerful interfaces optimized to specific tasks – But only for fixed, developer-chosen schemas and tasks • Spreadsheets – Arbitrary data structuring – But terrible UI for specific tasks • Goal: end user tools with the data flexibility of spreadsheets, the interface/processing power of applications, and the easy visual flexibility of documents
The Microsoft Angle • Start with Bing’s structured data repositories • Let end users to create their own interfaces to that data – Tuned to a specific task – Surfacing entities and properties they care about – But reflecting personal taste • For personal applications – Build my own vacation planner – Present my favorite art from museums world wide • And business – Make my own storefront catalog • Feed users’ data work back into Bing
SOME WEB HISTORY
Steve Balmer good old days. . . early 1990 s
Wiki Blog Forum
1990
search filter sort template today
today
Bifurcation • Professional web sites have evolved – rich visualizations – powerful interactive exploration and navigation • Plain user web sites haven’t changed
Why? • Professional sites implement a rich data model – Information stored in databases – Extracted using complex queries – Fed into templating web servers to create human readable content • Rich structure supports rich interaction – Rich, informative visualizations – Filtering and Sorting – Result: fancy, lively “web 2. 0” sites • Plain authors left behind – – – Can’t install/operate/define a database Can’t write the queries to extract the data Limited to unstructured text pages (even in blogs and wikis) Less power to communicate effectively Less interest in publishing data
search filter “Plain” authors left behind sort
Content Carriers • Sites designed to hold content of a specific type – – – Photos on Flickr Videos on Youtube Recipes on Epicurious Book reviews on Amazon Friend lists and interests on Facebook • Data models and interfaces specialized to that type of data – Developers define schemas, templates, workflows, etc. • Plain users can – Contribute data to these content carrier repositories – Benefit from structure when exploring/consuming that data
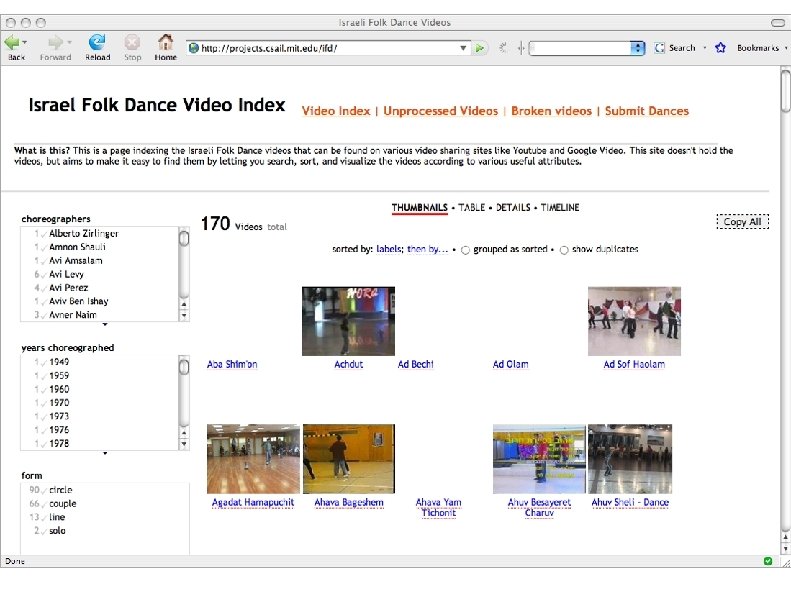
Content Carriers Constrain Creativity • I have to publish “their way” – What if I don’t like their schema/theme/layout/organization? – How can my wife show her books sorted chronologically by birthdate of the author? – How can I let people filter my folk dance video collection by choreographer, tempo, and year choreographed? – How does a biologist display his paradigm-changing gene taxonomy? • And there’s no carrier for the really unusual stuff – Where to put UFO sightings, sock collections, sea glass, roman coin mints, early 20 th Century Canadian Taverns. . . ?
Even Worse Between Sites • Content carriers are vertical data “silos” – – I get rich interaction with data on one site But what if I am interested in its connections to data on another site? Neither web site understands the other’s data Neither can offer good interaction with the combined data • Response: Mashups – – Someone finds multiple web sites with info they want writes programs to “scrape” (extract) data from each site writes programs to merge data from multiple sites programs new (database backed) web site to display merged data • Requires programming and managing a web site • Result: another vertical web site
The Ideal • Democratize creation of rich data interaction • Anyone should be able to – – – Create interesting data Or, find data on multiple web sites and combine it Create compelling, useful presentations of that data With rich visualization and interaction Share it easily with everyone else on the web • All without knowing – How to program – How to install a database – What a schema is
HOW?
Most of the Web is CRUD • Most of what happens is direct manipulation of information – – Create information according to some model Read/explore/visualize/navigate using rich interfaces Update using editing interfaces Delete • True even on professional web sites – Flickr, Youtube, Epicurious, Amazon, Facebook • Sites are dumb storage – Computation is left to the human users • Large payoff to democratizing just this much power
Approach • Publishing data is easy – Just put a spreadsheet online • Identify key elements of interactive data visualizations • Add them to the HTML document vocabulary – So they can be inserted like images or videos today • Configure them by binding them to underlying data – Like charts in a spreadsheet
search filter sort template
Image
Data
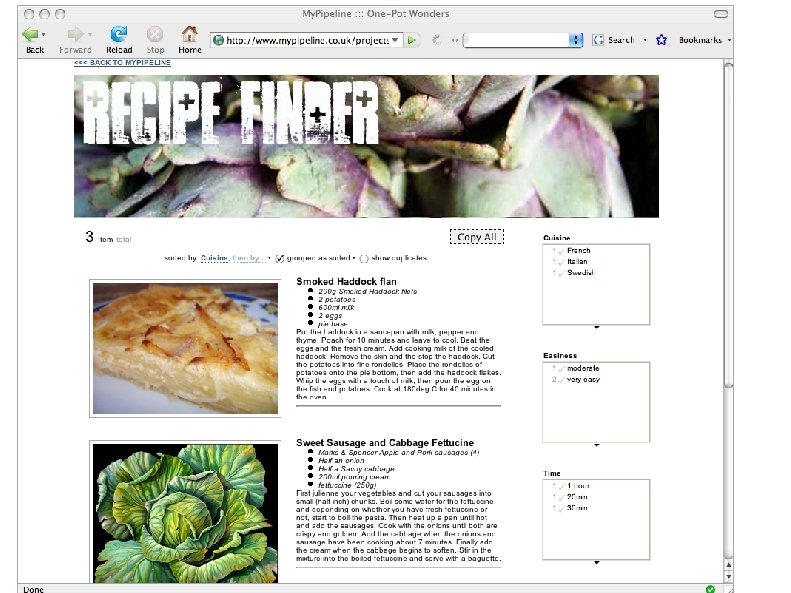
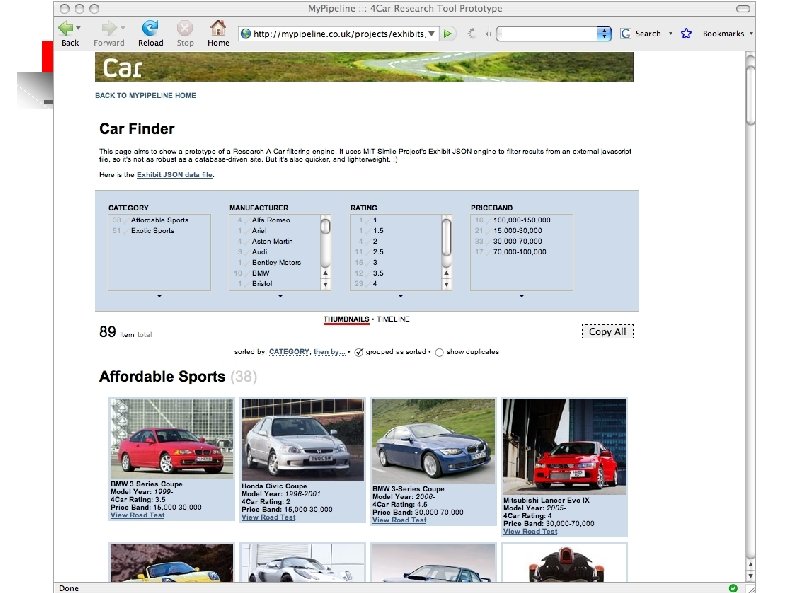
Data • Items (Recipes) – Each has properties * Title * Source magazine * Publication date * Rating * Ingredients – Publish a spreadsheet * One item per row * Columns for properties • Template – Format per item
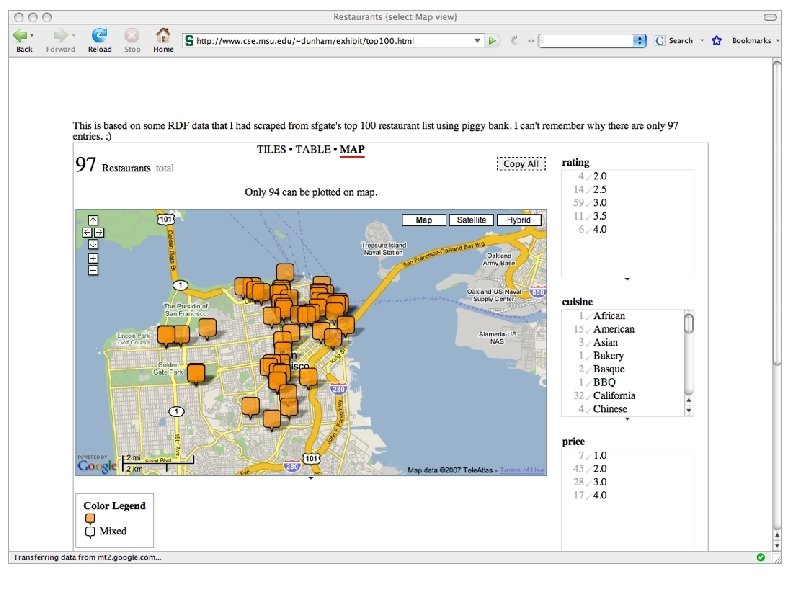
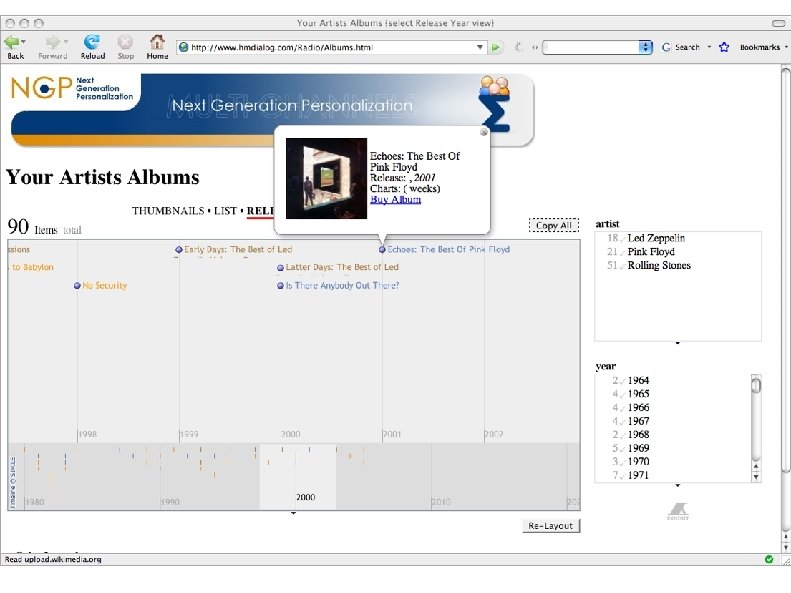
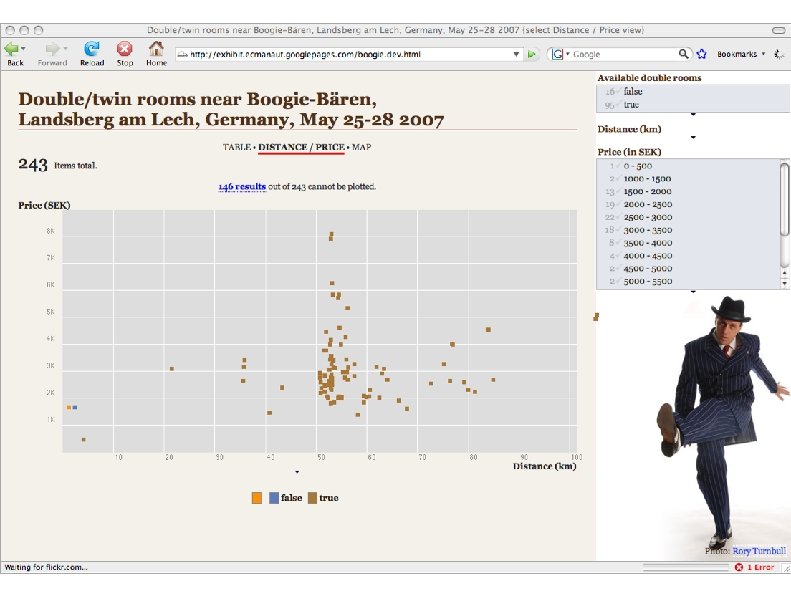
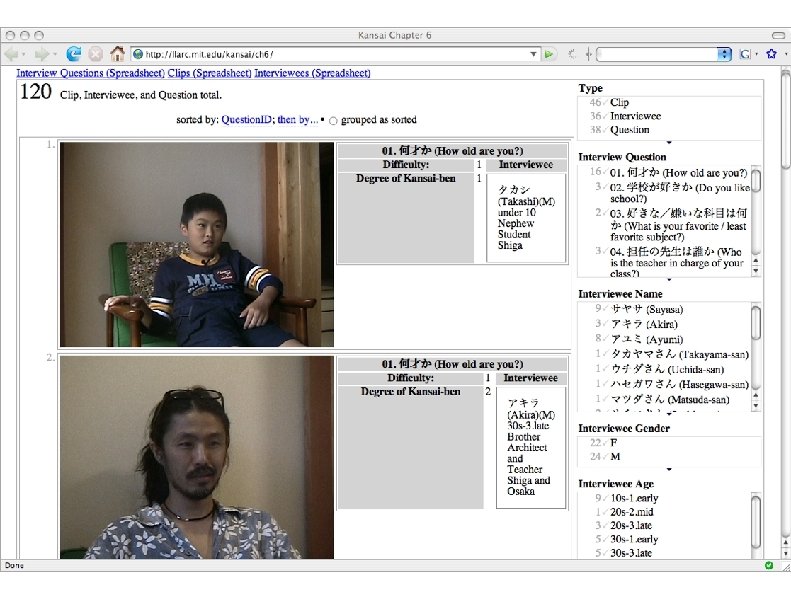
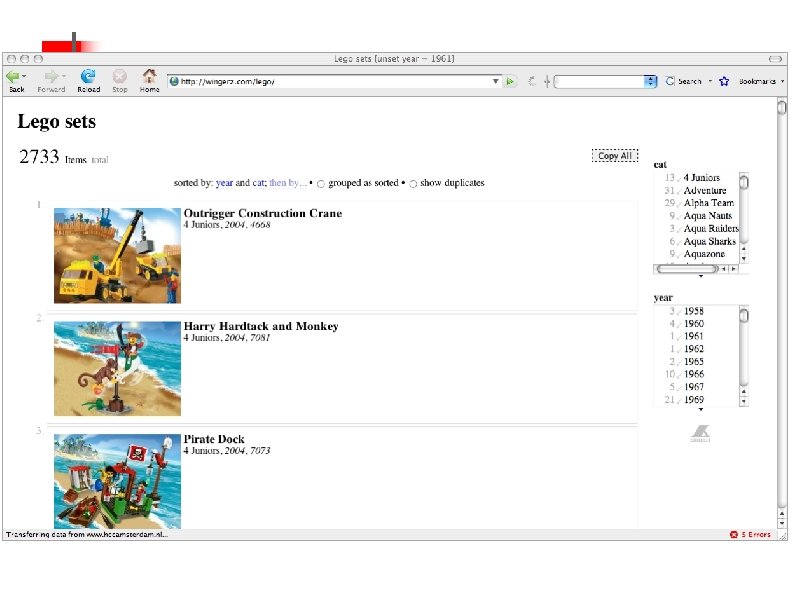
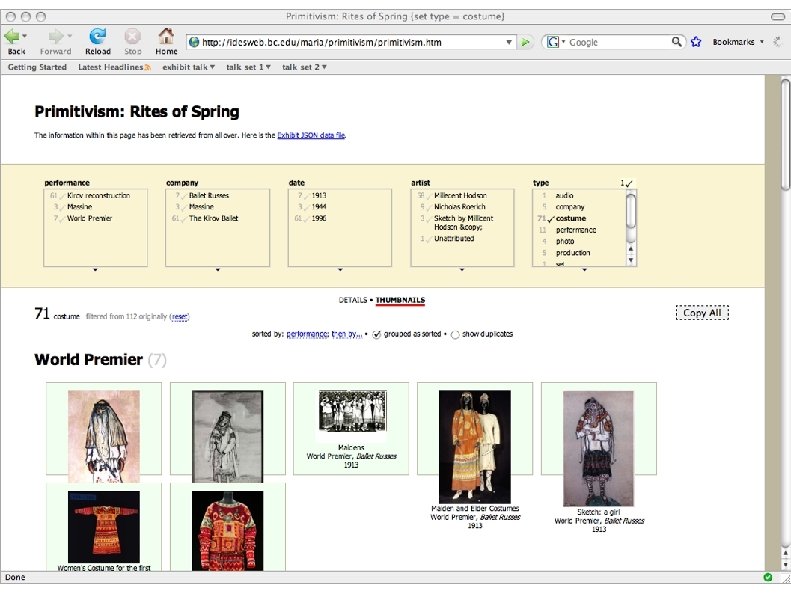
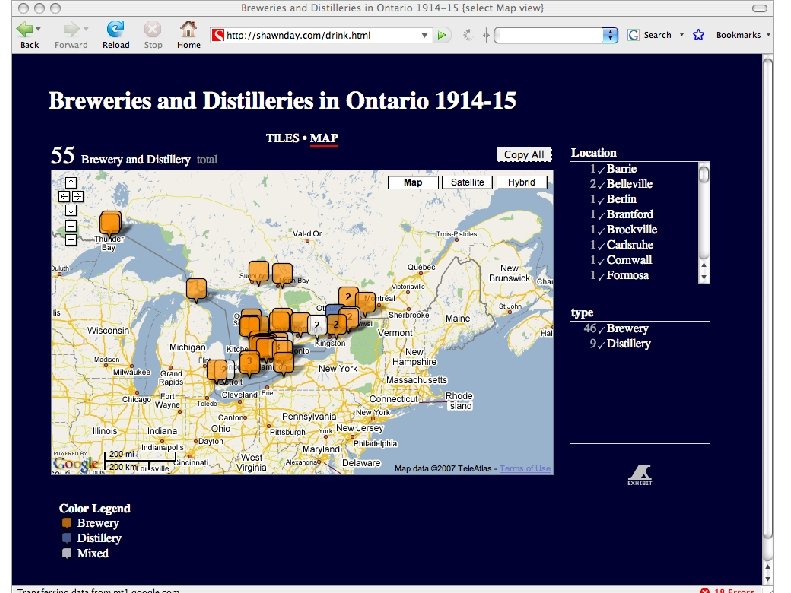
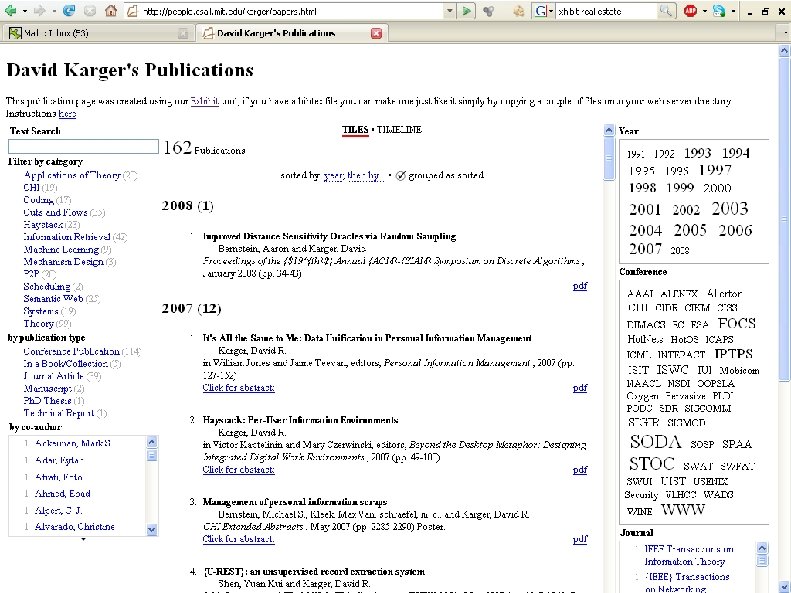
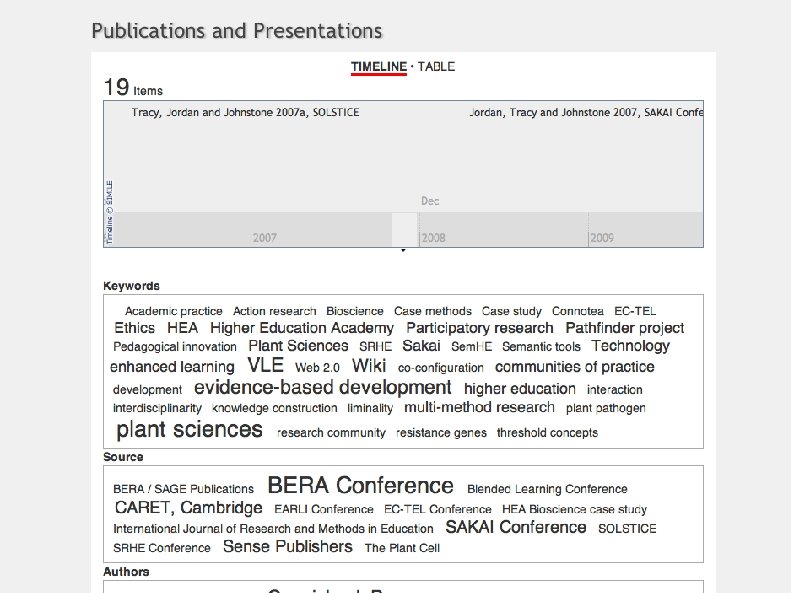
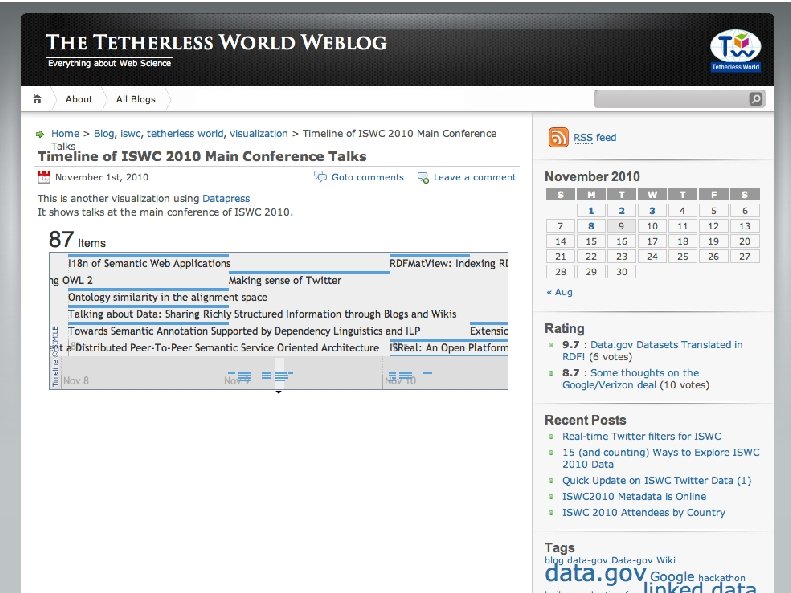
Views • Aggregate a collection – – – Sortable list (here) Map Timeline Bar chart Thumbnail set • Bound to properties – Which property to sort by? – Which property to plot by?
Facets • Way to filter a collection – – Specify some property E. g. ingredient User clicks to pick some Collection restricted to items that match • Also text search
Key Primitives of a Data Page • Data – A spreadsheet • Templates – Explain how to display a single item – By describing what properties should be shown, and how • Views – Ways of looking at collections of items – Lists, Thumbnails, Maps, Scatterplots – Specify which properties determine layout • Facets – Elements for filtering or sorting information based on its structure
Migration to the Web Text search Sorting by Properties Faceted Browsing Templated Items
Migration to the Web Text search Faceted Browsing Sorting by Properties Templated Items
Text search Faceted Browsing Sorting by Properties Templated Items
Text search Faceted Browsing Sorting by Properties Templated Items
Text search Sorting by Properties Faceted Browsing Templated Items
Sorting by Properties Text search Faceted Browsing Templated Items
Text search Faceted Browsing Sorting by Properties Templated Items
Sorting by Properties Text search Faceted Browsing Templated Items
Can people author these? • Data? – Spreadsheets • Views? – Spreadsheet charts – Specify which columns play which roles in view • Facets? – Like views – Specify which column to filter on – Available in Excel • Templates? – Document templates in MSWord • They just aren’t doing it on the web yet
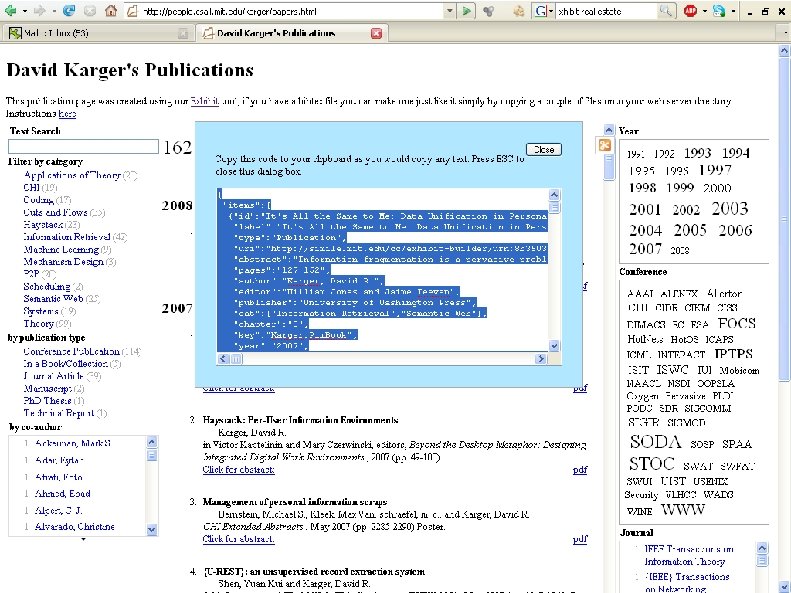
Proof-of-concept implementation EXHIBIT
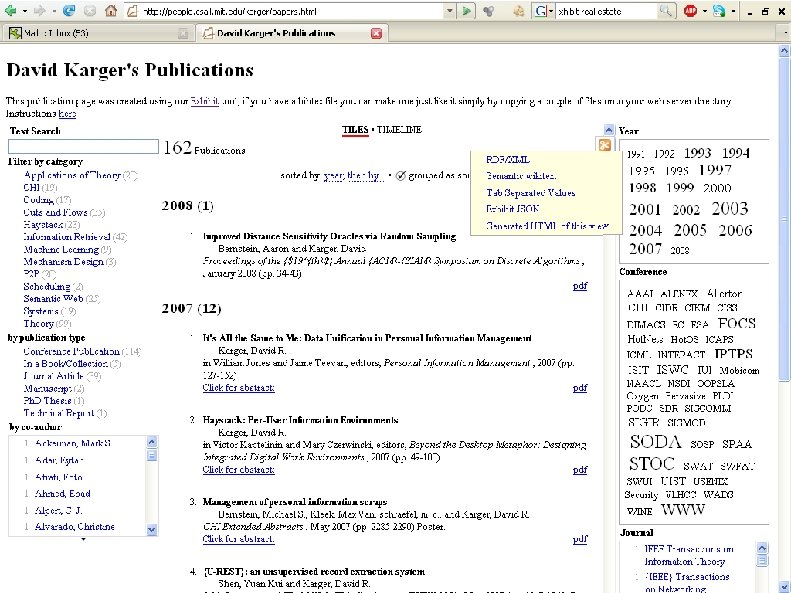
Exhibit • An interactive web site from static files – One file for data --- spreadsheet or CSV, RDF, XML, JSON, – One for presentation --- HTML • Extend HTML vocabulary – Lens tags for showing data items – View tags for laying them out – Facet tags for searching, filtering, sorting • Link to a Javascript library that makes it all work – Nothing to install or configure – All runs in visitor’s browser
DEMO
Scalability • Javascript is slow, not designed for implementing DBs • Recommended for < 500 items • One person used 2733 items • Not a limitation per se • Plenty of small data sets • If became part of browser, scale much larger – Typical web page today may be 2 Mb – 50, 000 data items easy
Incentivizing Data • A data-centric web page is better – More effective communication – Easier to maintain (like CSS) – Creates enthusiasm for working with data • Data is exposed as a side effect – Enabling reuse – Alternative visualizations – Critiques • Selfish incentives lead to global benefit
Authoring by Copying • HTML describes visualization • Copy it, change the data • (Maybe change the presentation too) oops!
Exhibit and IPE
The Virtuous Cycle • Personal Sphere: Structured Data on Websites • Crawl/Post/Pull Structured Data • Structured Data Utilization & Authoring Tools • Global Sphere: Knowledge Repository
EXHIBIT AUTHORING INTERFACES
Wibit: Exhibit in a Wiki • Start with Semantic Mediawiki – – Mediawiki (Wikipedia platform) extension for structured data Infobox contents go into a database Wikitext syntax for querying the database Results are embedded as a table in the page containing the query • Enrich with Exhibit – – SMW already had “results printer” for various table formats Shove in Exhibit as other “formats” User specifies views, facets in wikitext Reuse preexisting infobox template system for lenses • Play here: – http: //projects. csail. mit. edu/wibit/
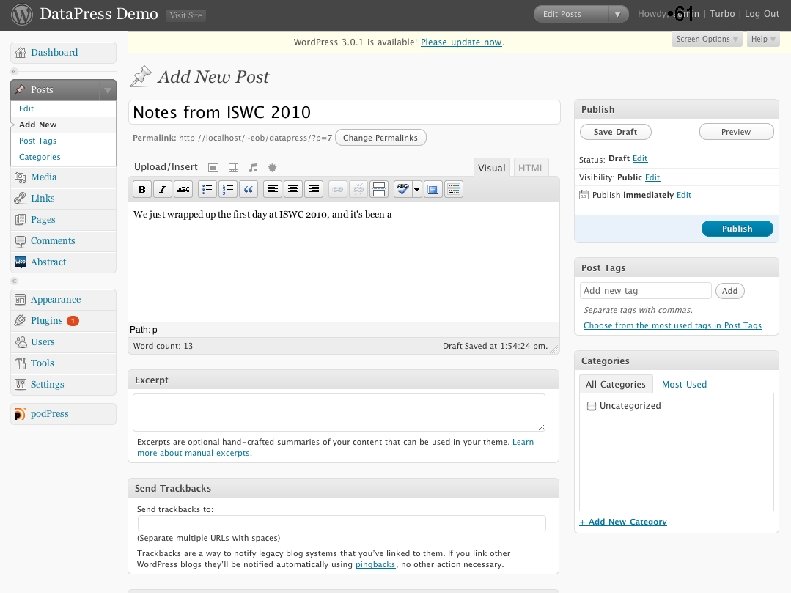
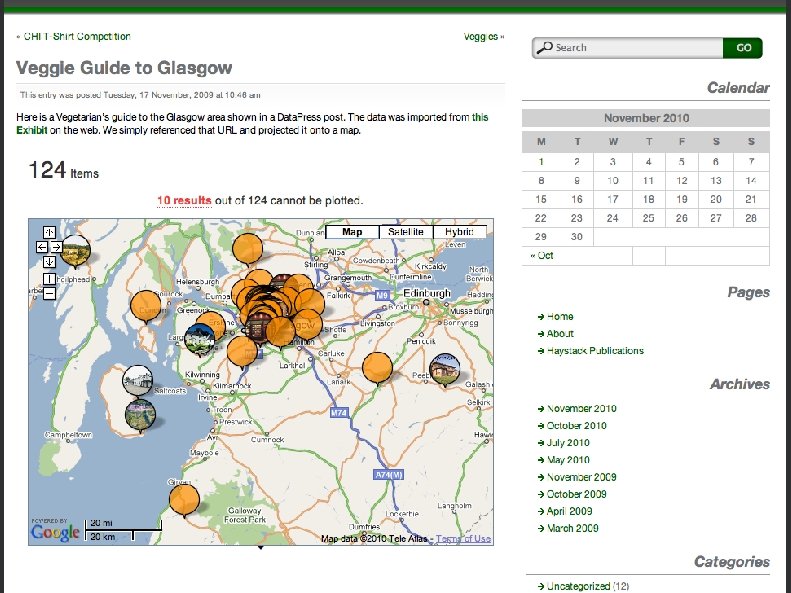
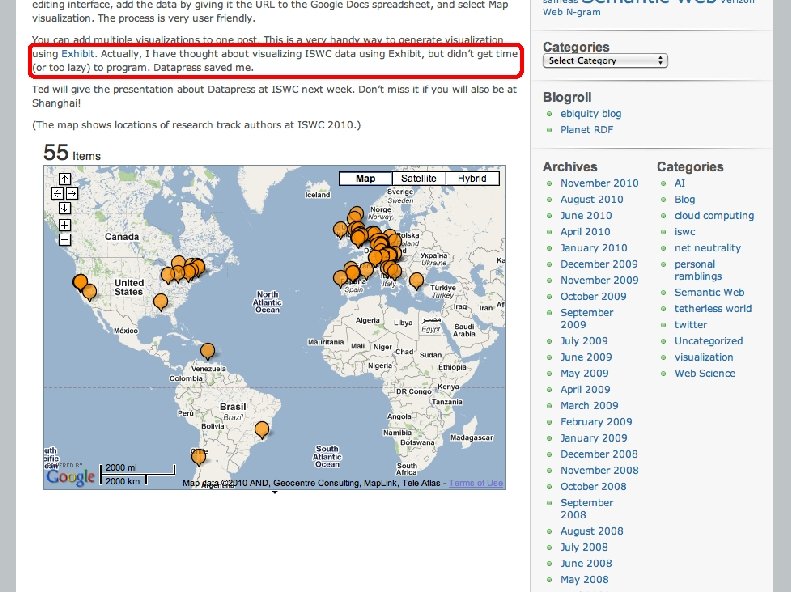
Datapress • Wordpress plugin • Upload or link to data – Spreadsheet, JSON…. • Then WYSYWIG your visualization – Using usual Wordpress blog post editor
Word. Press
Word. Press + datapress
• 68 cvx
DIDO --- Data Integrated Active Document • Rich view of content • Edit it in the document – Data AND visualization – Both stored in document • WYSIWYG • Save the result – Email to a friend – Check into SVN repository – Put on your web site • http: //projects. csail. mit. edu/exhibit/Dido
But Wait! There’s More! Other research my group does
Summary • Atomate: – Automate information tasks using structured data “RSS feeds” • Listit: – Dealing with information scraps that don’t fit anywhere • Feedme: – Getting your friends to filter your information for you • Nb: – Collaborative lecture note annotation/discussion
Atomate
physical locations desktop activity messages • sleep travels friends/enemies music listened to running events documents
Wouldn’t it be great if computers could use all this information to do stuff for us?
Examples • remind me to take out the trash when I get home on Tuesdays. . . • bug my friend who hasn’t replied to me in 2 days. . . • send me my grocery shopping list when I arrive at the grocery store • remind friends about an event I am going to attend • text me important emails when I am traveling
What we Need • 1. a way for users to express: • what they want to happen, • and when, • in terms of predicates relating • the states and properties of • people, places + things • in their world. • actions • conditions • predicates • properties • entities • Controlled Natural Language Interface (CNLI) for Rules • 2. a way to retrieve and interpret data from our many heterogeneous web sources as descriptions of these familiar people, places and things. • ATOM/RSS/REST APIs, End-user mashups + RDF
New Opportunity • Idea of agent-based automation is old • RSS + Social networks are new • Key idea: a standard for dissemination of structured data – Datapress already hinted at structured data feeds – Many other sources of (potentially) structured data • Entities with properties and values is tractable for regular user rule-authoring • This becomes key infrastructure for creating those automated agents
Atomate (our Auron)
Conclusion • Separate data from presentation – Data files – HTML “styling” vocabulary for interactive visualization • Doing so would offer substantial benefits – – – Anyone can create interesting data and visualizations Motivates authoring of data Which is directly useful for readers And seeds data for other users Who can access and repurpose it to their own needs • Put people in the drivers seat – Not about sophisticated information tools – About simple flexible tools to let people do the sophisticated work
Thanks • • • Dennis Quan Vineet Sinha Karun Bakshi David Huynh *** Margaret Leibovic Gabriel Durazo Nina Guo Adam Marcus Ted Benson Fabian Howahl
More Info • • • http: //haystack. csail. mit. edu/ http: //simile-widgets. org/exhibit/ http: //projects. csail. mit. edu/datapress/ http: //projects. csail. mit. edu/exhibit/Dido/ karger@mit. edu