Measurement for Improvement Help you construct a compelling




- Slides: 94
Measurement for Improvement ü Help you construct a compelling narrative for change which engages and motivates a broad coalition of stakeholders ü Through understanding the evidence about commitment, energy and narrative
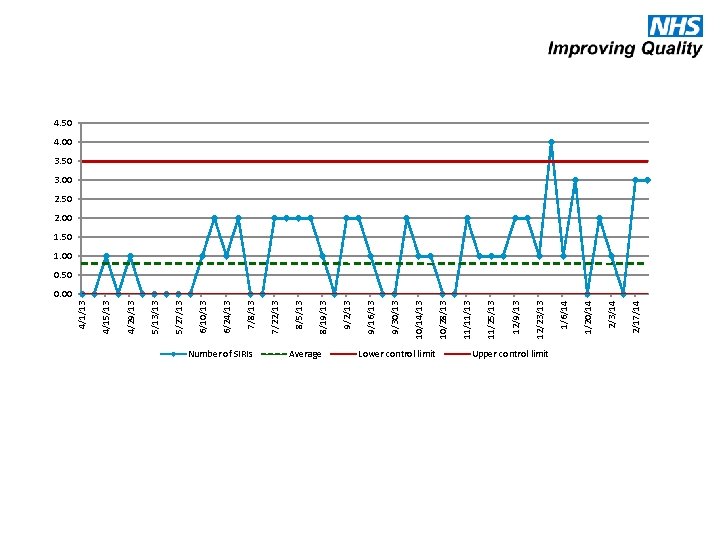
Number of SIRIs Average Lower control limit Upper control limit 2/17/14 2/3/14 1/20/14 1/6/14 12/23/13 12/9/13 11/25/13 11/11/13 10/28/13 10/14/13 9/30/13 9/16/13 9/2/13 8/19/13 8/5/13 7/22/13 7/8/13 6/24/13 6/10/13 5/27/13 5/13/13 4/29/13 4/15/13 4/1/13 4. 50 4. 00 3. 50 3. 00 2. 50 2. 00 1. 50 1. 00 0. 50 0. 00
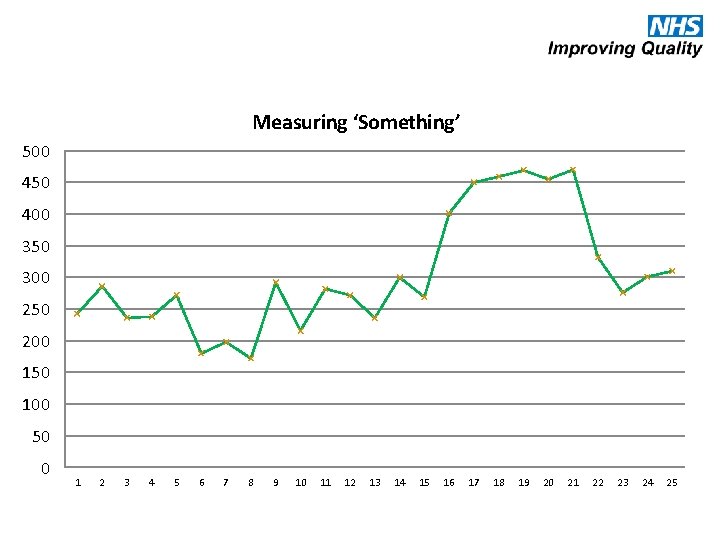
Measuring ‘Something’ 500 450 400 350 300 250 200 150 100 50 0 1 2 3 4 5 6 7 8 9 10 11 12 13 14 15 16 17 18 19 20 21 22 23 24 25
I use run charts & statistical process control (SPC) I know about run charts & statistical process control (SPC) I don’t know about run charts & statistical process control (SPC)
70% of change fails
Aims ü To understand how to best choose and use metrics to support your large-scale change programme ü Help you make better decisions through better strategic approaches to measurement, choice of metrics & analytic techniques ü Help you lead change faster & more successfully through better strategic approaches, alignment & transparency
For your improvement project § How well does data serve you now? § How could it be better?
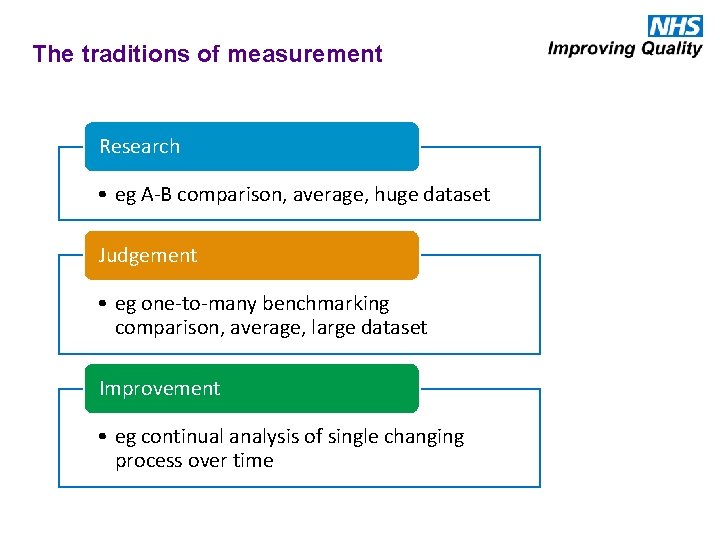
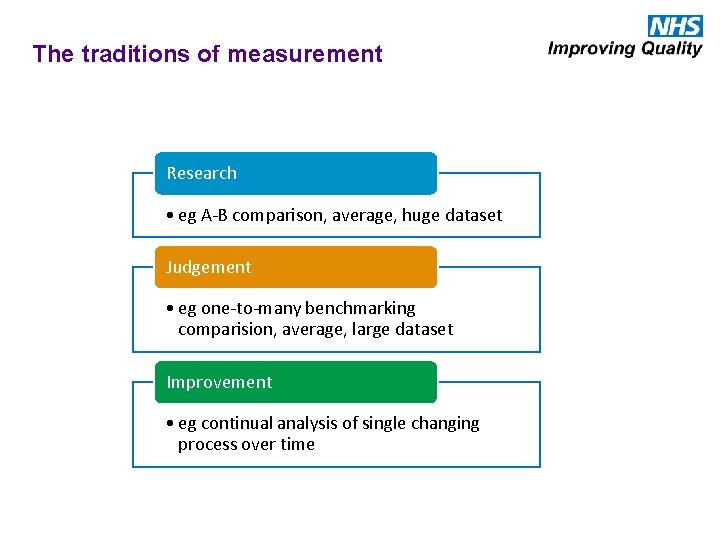
The traditions of measurement Research • eg A-B comparison, average, huge dataset Judgement • eg one-to-many benchmarking comparison, average, large dataset Improvement • eg continual analysis of single changing process over time
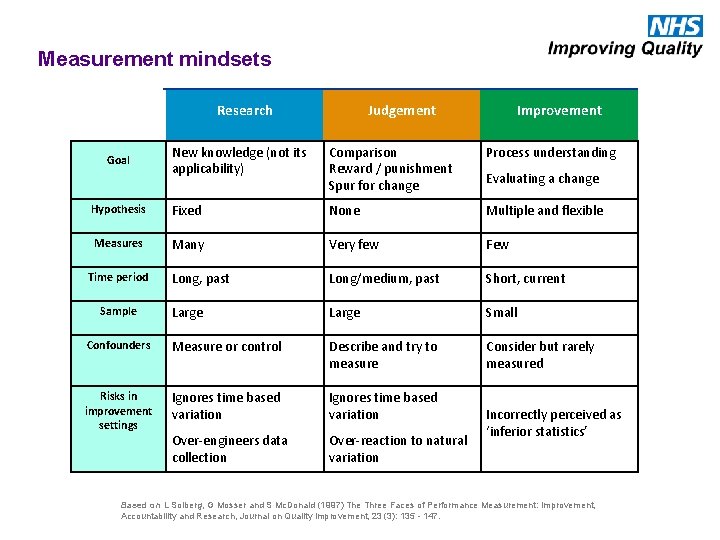
Measurement mindsets Research Judgement Improvement New knowledge (not its applicability) Comparison Reward / punishment Spur for change Process understanding Hypothesis Fixed None Multiple and flexible Measures Many Very few Few Long, past Long/medium, past Short, current Large Small Confounders Measure or control Describe and try to measure Consider but rarely measured Risks in improvement settings Ignores time based variation Over-engineers data collection Over-reaction to natural variation Goal Time period Sample Evaluating a change Incorrectly perceived as ‘inferior statistics’ Based on L Solberg, G Mosser and S Mc. Donald (1997) The Three Faces of Performance Measurement: Improvement, Accountability and Research, Journal on Quality Improvement, 23 (3): 135 - 147.
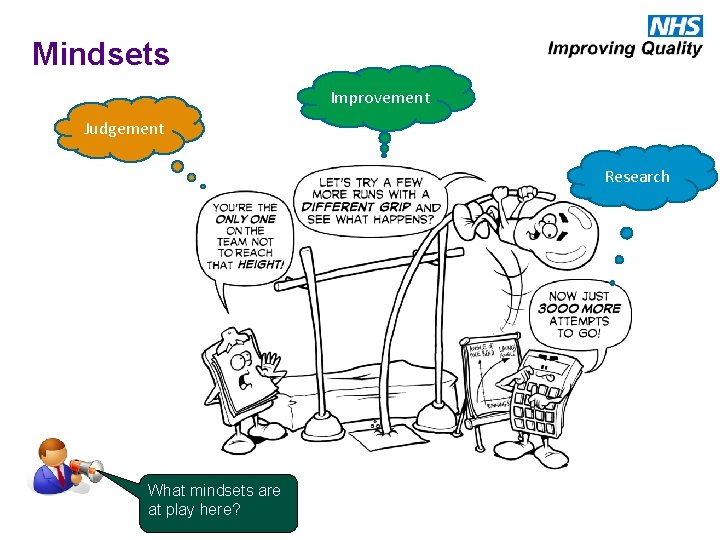
Mindsets Improvement Judgement Research What mindsets are at play here?
The traditions of measurement Research • eg A-B comparison, average, huge dataset Judgement • eg one-to-many benchmarking comparision, average, large dataset Improvement • eg continual analysis of single changing process over time
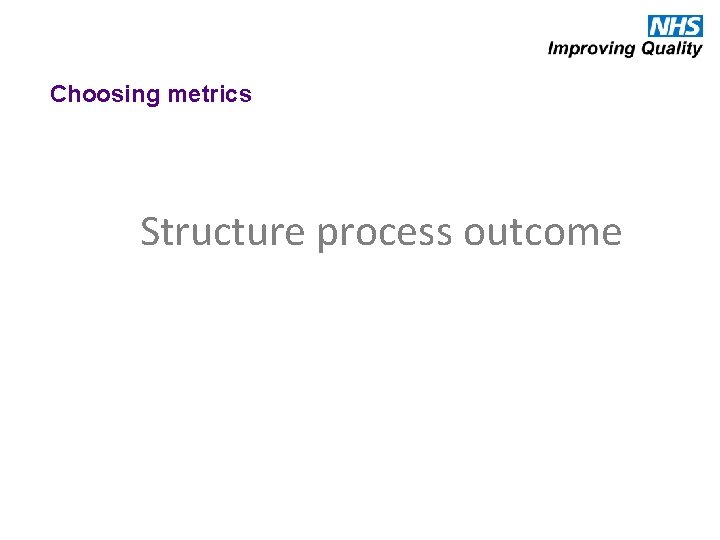
Choosing metrics Structure process outcome
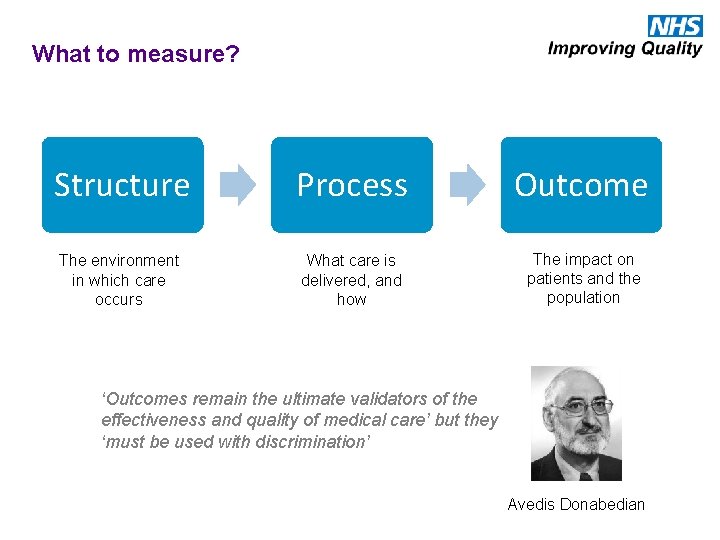
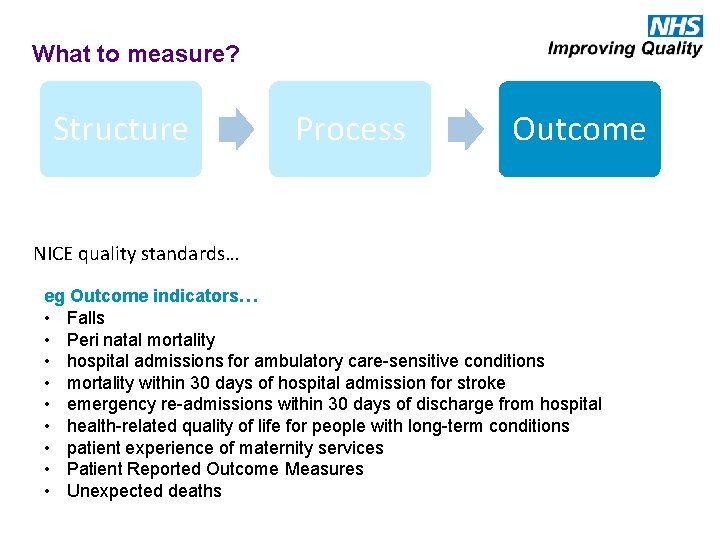
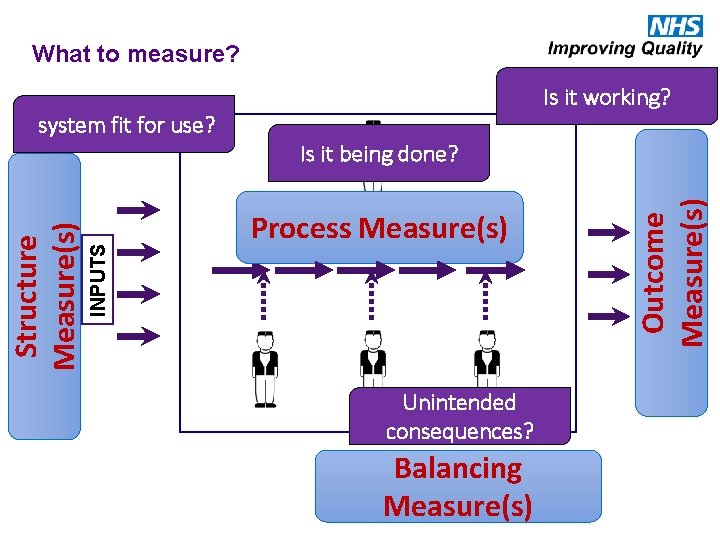
What to measure? Structure Process Outcome The environment in which care occurs What care is delivered, and how The impact on patients and the population ‘Outcomes remain the ultimate validators of the effectiveness and quality of medical care’ but they ‘must be used with discrimination’ Avedis Donabedian
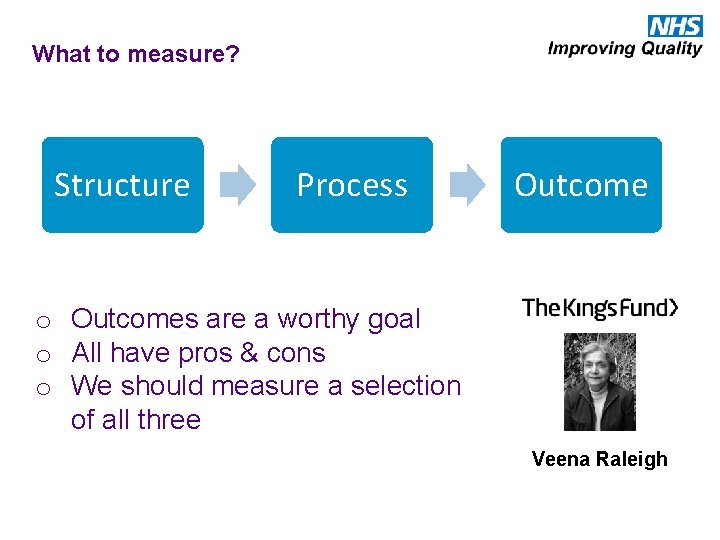
What to measure? Structure Process Outcome o Outcomes are a worthy goal o All have pros & cons o We should measure a selection of all three Veena Raleigh
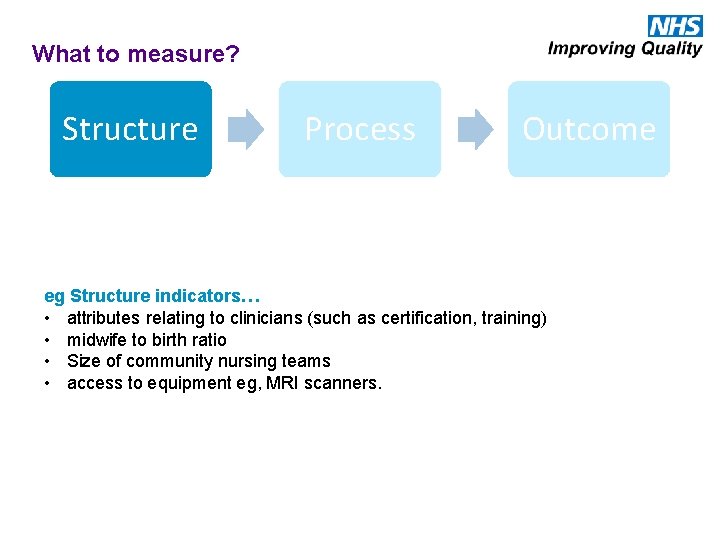
What to measure? Structure Process Outcome eg Structure indicators… • attributes relating to clinicians (such as certification, training) • midwife to birth ratio • Size of community nursing teams • access to equipment eg, MRI scanners.
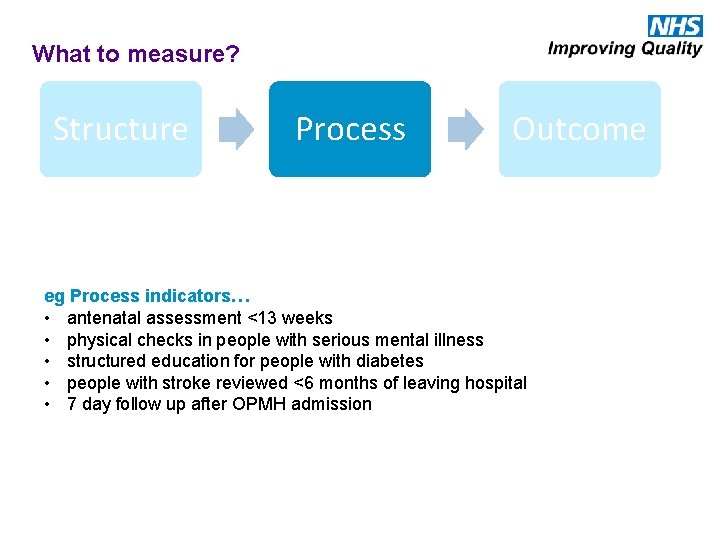
What to measure? Structure Process Outcome eg Process indicators… • antenatal assessment <13 weeks • physical checks in people with serious mental illness • structured education for people with diabetes • people with stroke reviewed <6 months of leaving hospital • 7 day follow up after OPMH admission
What to measure? Structure Process Outcome NICE quality standards… eg Outcome indicators… • Falls • Peri natal mortality • hospital admissions for ambulatory care-sensitive conditions • mortality within 30 days of hospital admission for stroke • emergency re-admissions within 30 days of discharge from hospital • health-related quality of life for people with long-term conditions • patient experience of maternity services • Patient Reported Outcome Measures • Unexpected deaths
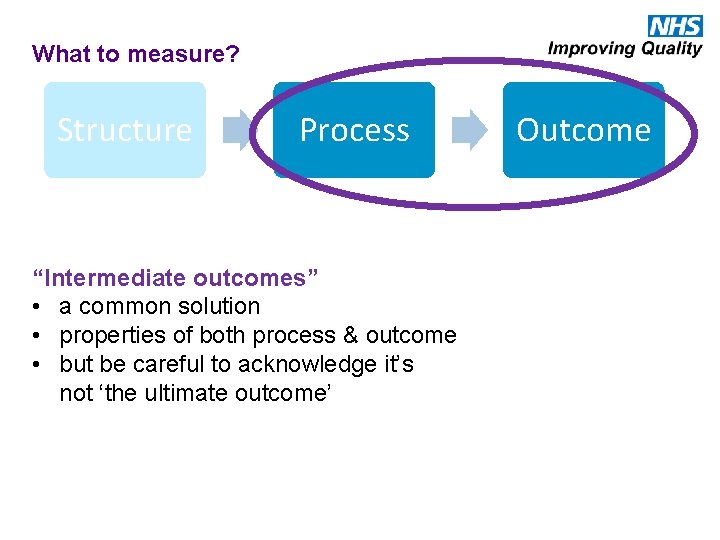
What to measure? Structure Process “Intermediate outcomes” • a common solution • properties of both process & outcome • but be careful to acknowledge it’s not ‘the ultimate outcome’ Outcome
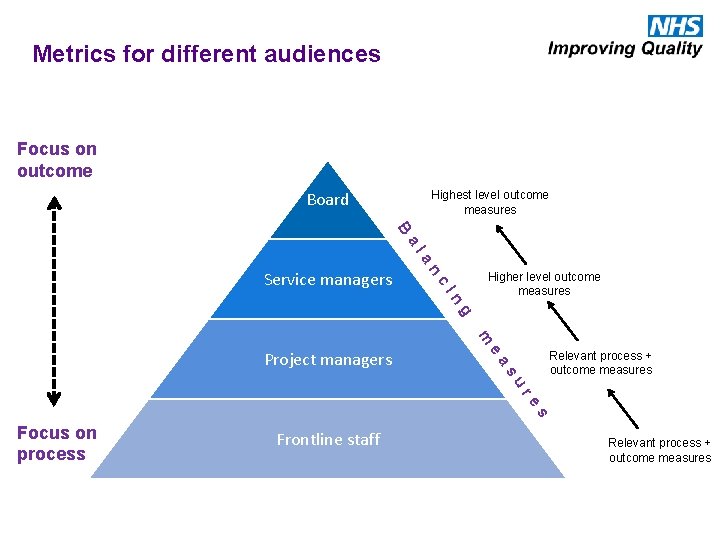
Metrics for different audiences Focus on outcome Board Highest level outcome measures B al an c. I Service managers Higher level outcome measures n g m Relevant process + outcome measures ea Project managers su re s Focus on process Frontline staff Relevant process + outcome measures
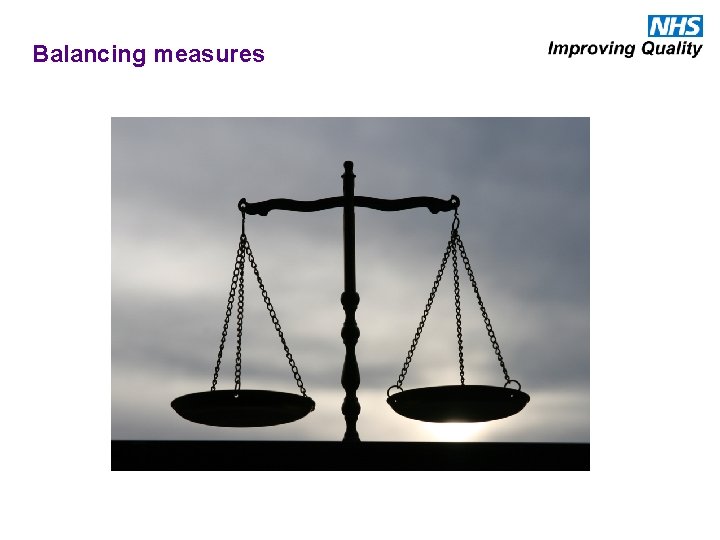
Balancing measures
What to measure? Is it being done? HUMAN FACTORS INPUTS Structure Measure(s) FACTORS Process Measure(s) INTERNAL PROCESSES & PROCECEDURES HUMAN FACTORS Unintended consequences? Balancing Measure(s) OUTPUTS Outcome Measure(s) EXTERNAL fit for use? system Is it working?
What to measure? Implications for you ?
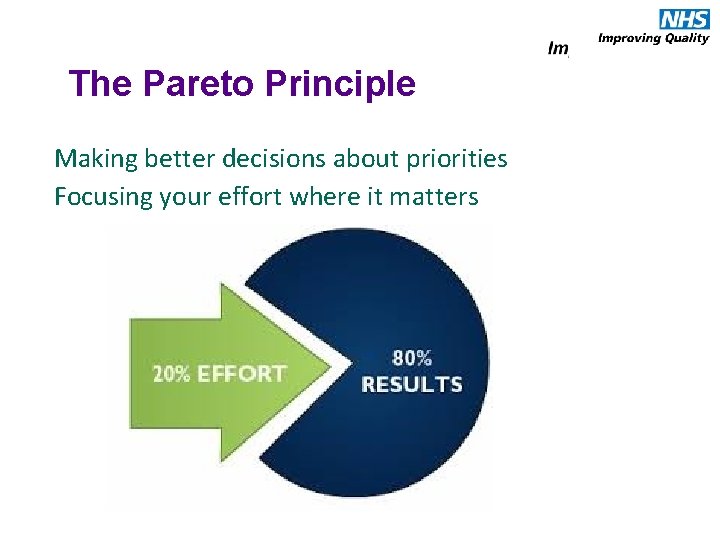
The Pareto Principle Making better decisions about priorities Focusing your effort where it matters
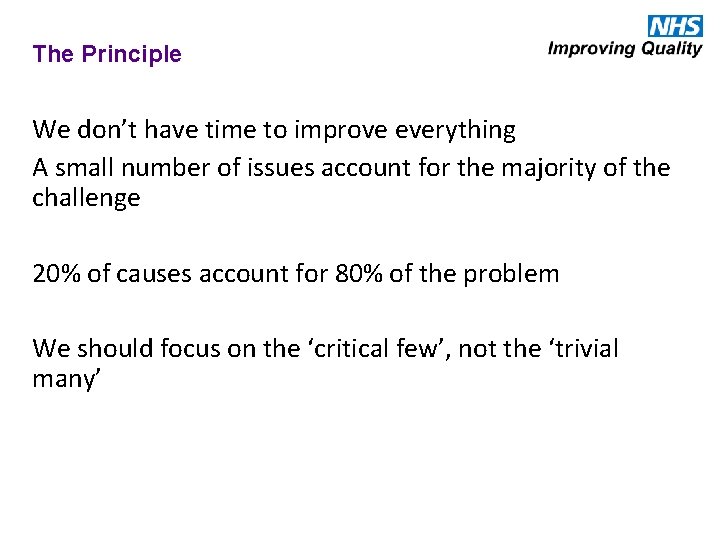
The Principle We don’t have time to improve everything A small number of issues account for the majority of the challenge 20% of causes account for 80% of the problem We should focus on the ‘critical few’, not the ‘trivial many’
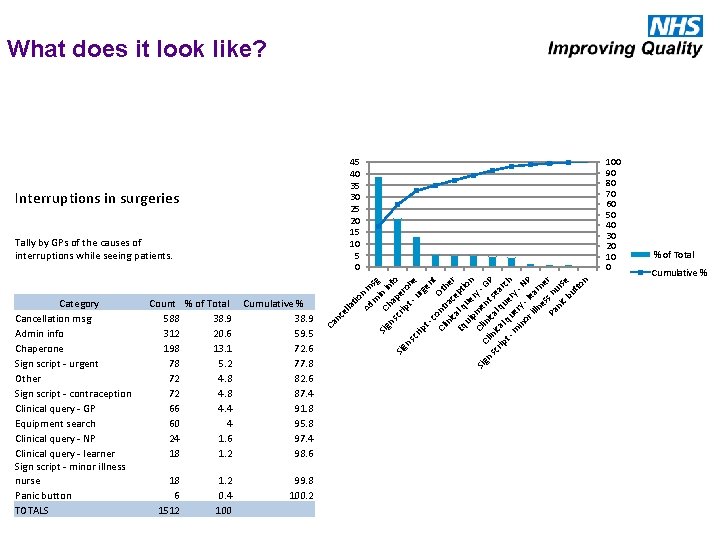
What does it look like? Interruptions in surgeries 18 6 1512 1. 2 0. 4 100 99. 8 100. 2 el Cumulative % 38. 9 59. 5 72. 6 77. 8 82. 6 87. 4 91. 8 95. 8 97. 4 98. 6 nc Count % of Total 588 38. 9 312 20. 6 198 13. 1 78 5. 2 72 4. 8 66 4. 4 60 4 24 1. 6 18 1. 2 Ca Category Cancellation msg Admin info Chaperone Sign script - urgent Other Sign script - contraception Clinical query - GP Equipment search Clinical query - NP Clinical query - learner Sign script - minor illness nurse Panic button TOTALS la Tally by GPs of the causes of interruptions while seeing patients. tio Ad n m m sg Sig C in i n ha nfo sc pe Sig rip ro n t - ne sc u rip rg t en co t O Cl nt in ra the ic c r Eq al q epti ui ue on p Cl me ry - Sig i C n n lin ic nt s GP sc a rip ical l q ear t - qu uer ch m e y in ry - N or - l ill ea P ne rn s e Pa s n r ni urs c b e ut to n 45 40 35 30 25 20 15 10 5 0 100 90 80 70 60 50 40 30 20 10 0 % of Total Cumulative %
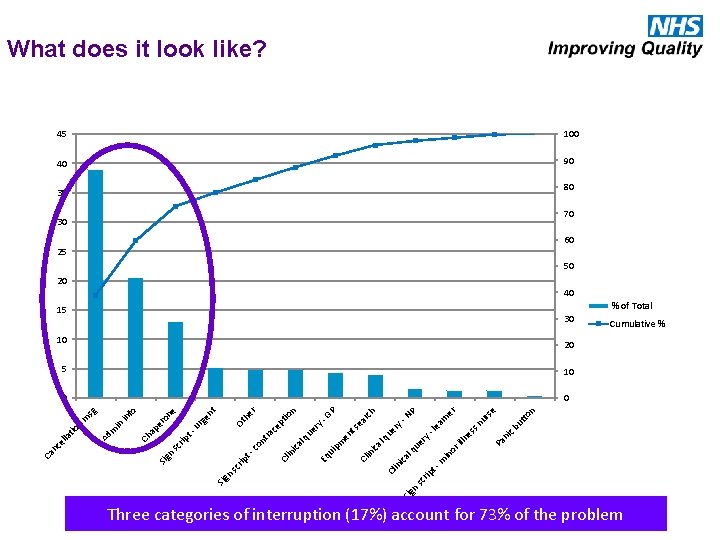
n to se ne r ur ut c b ni Pa ar NP - ss n ne ill or ry ue y le ue r l q in m t - sc rip Sig n in ica Cl h rc ea GP - ry t s en l q ica in Cl m ui p Eq n io pt r he Ot ce l q ue ca in i Cl nt ra t co rip n sc Sig en t rg e on er ap rip t u n sc Sig Ch fo in in m Ad sg m n tio la el nc Ca What does it look like? 45 100 40 90 35 80 30 70 25 60 20 50 40 15 30 % of Total 10 5 10 0 0 Cumulative % 20 Three categories of interruption (17%) account for 73% of the problem
Techniques for analysing data Static or Continual?
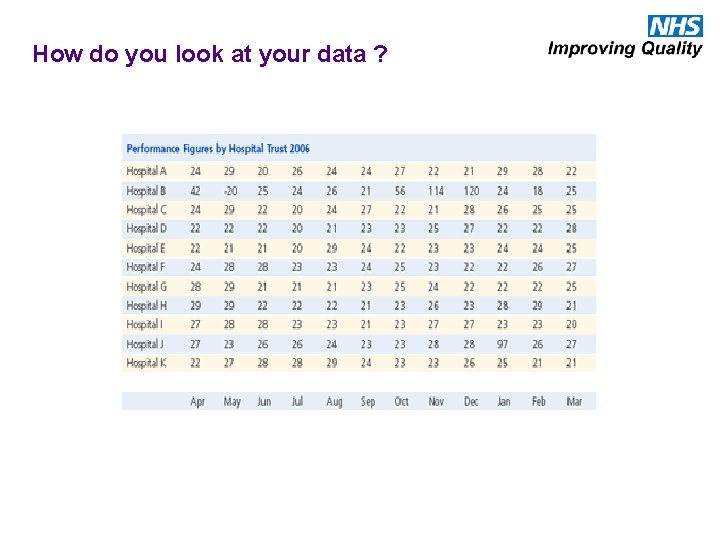
How do you look at your data ?
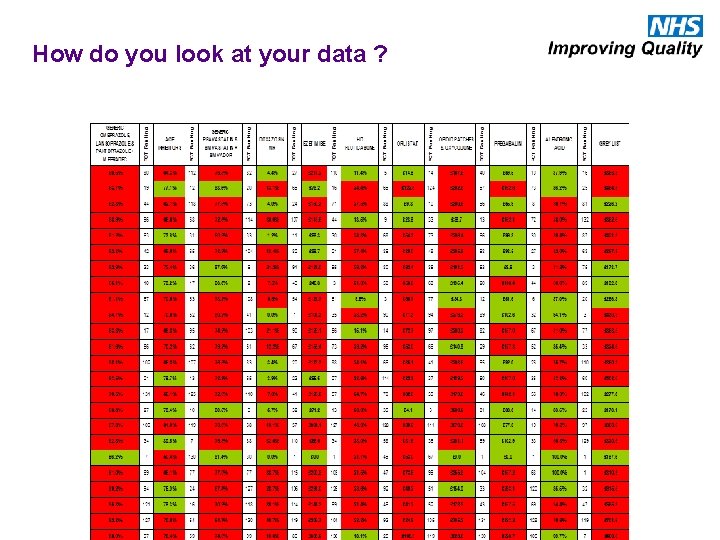
How do you look at your data ?
Lessons It’s easy to react in the wrong way Natural variation is really quite large It’s the system not the individual
Control charts Statistical process control (SPC)
Which facilitates better learning? v A-B comparison of averages v Continual fine-grained analysis
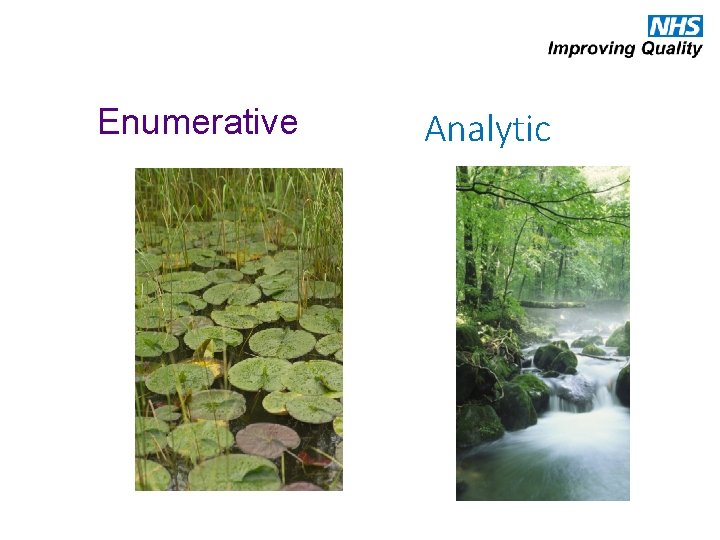
Enumerative Analytic
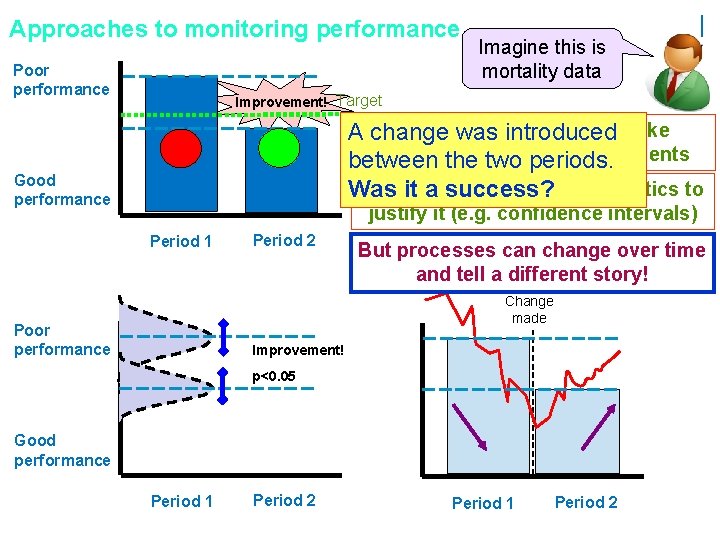
Approaches to monitoring performance Poor performance Imagine this is mortality data Improvement! Target With summary data we make A change was introduced judgements about improvements between the two periods. We may summative statistics to Was it a use success? Good performance justify it (e. g. confidence intervals) Period 1 Period 2 But processes can change over time and tell a different story! Change made Poor performance Improvement! p<0. 05 Good performance Period 1 Period 2
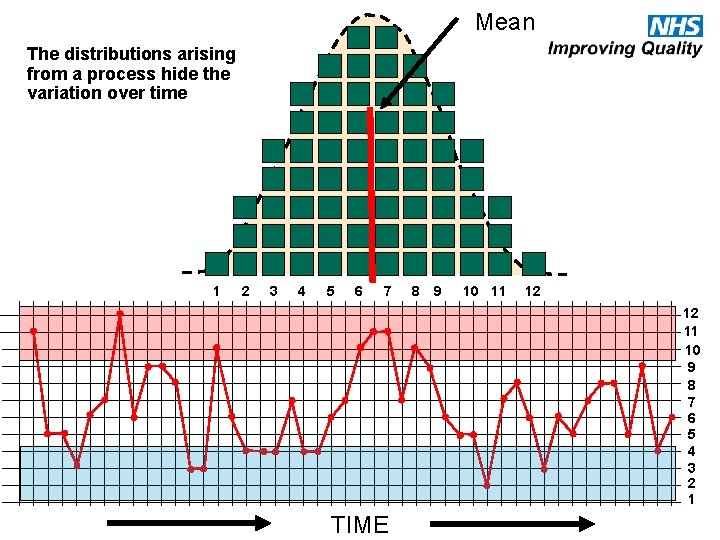
Mean The distributions arising from a process hide the variation over time 1 2 3 4 5 6 7 8 9 10 11 12 12 11 10 9 8 7 6 5 4 3 2 1 TIME
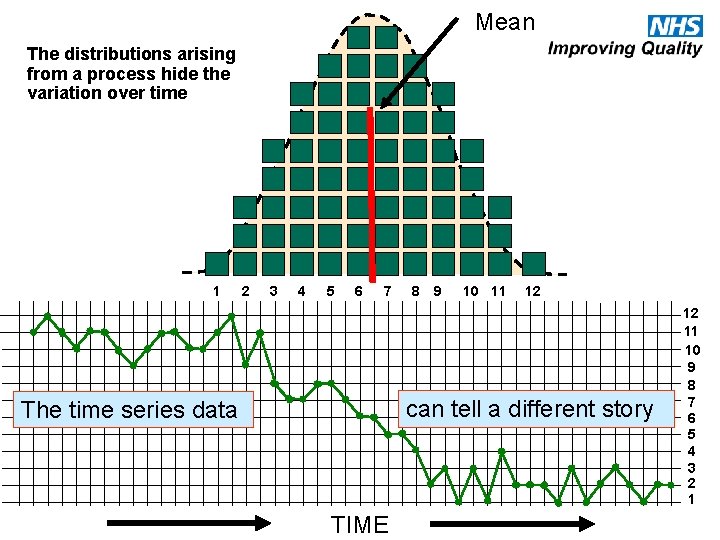
Mean The distributions arising from a process hide the variation over time 1 2 3 4 5 6 7 8 9 10 11 12 can tell a different story The time series data TIME 12 11 10 9 8 7 6 5 4 3 2 1
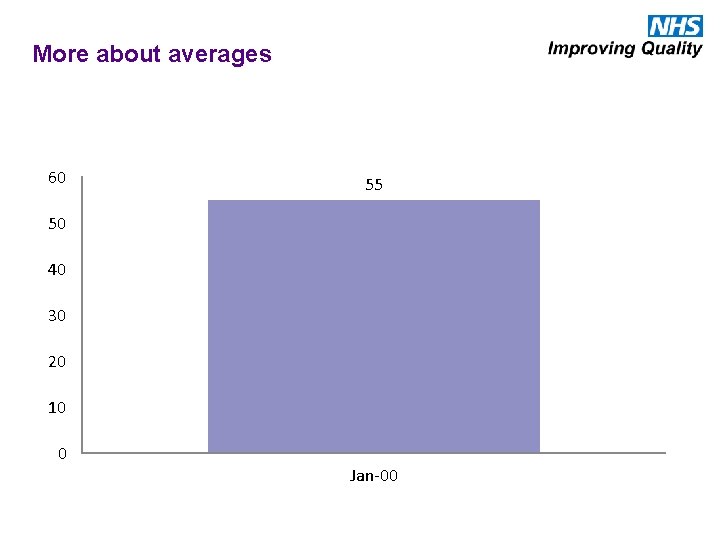
More about averages 60 55 50 40 30 20 10 0 Jan-00
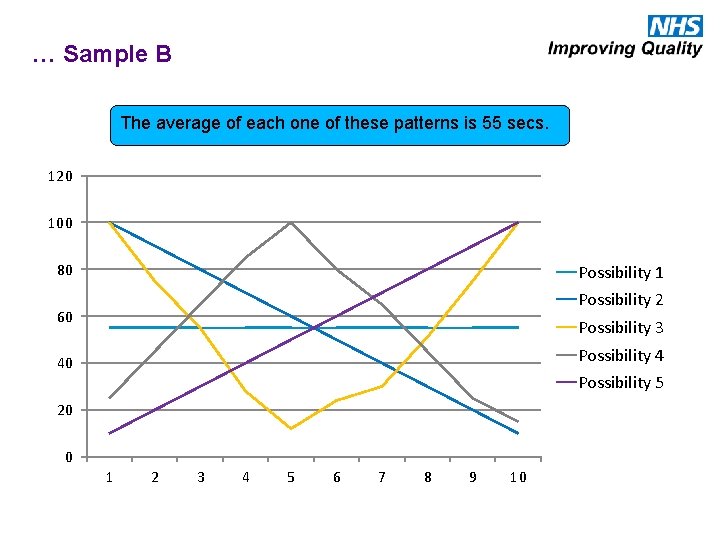
… Sample B The average of each one of these patterns is 55 secs. 120 100 80 Possibility 1 Possibility 2 60 Possibility 3 Possibility 4 40 Possibility 5 20 0 1 2 3 4 5 6 7 8 9 10
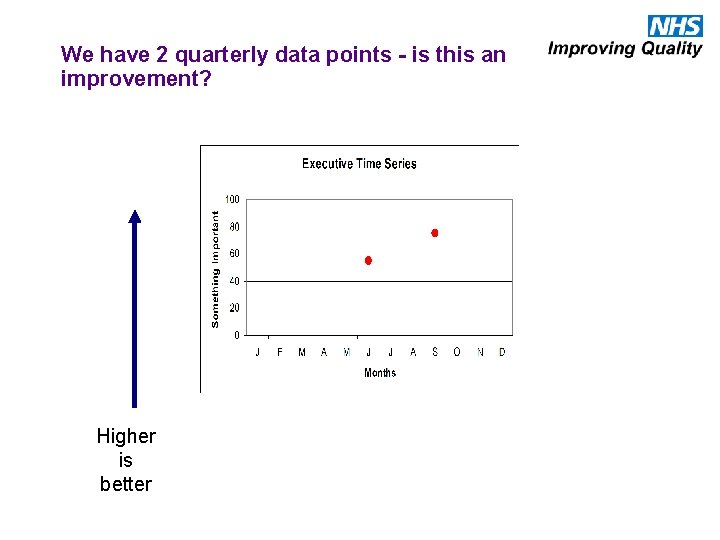
We have 2 quarterly data points - is this an improvement? Higher is better
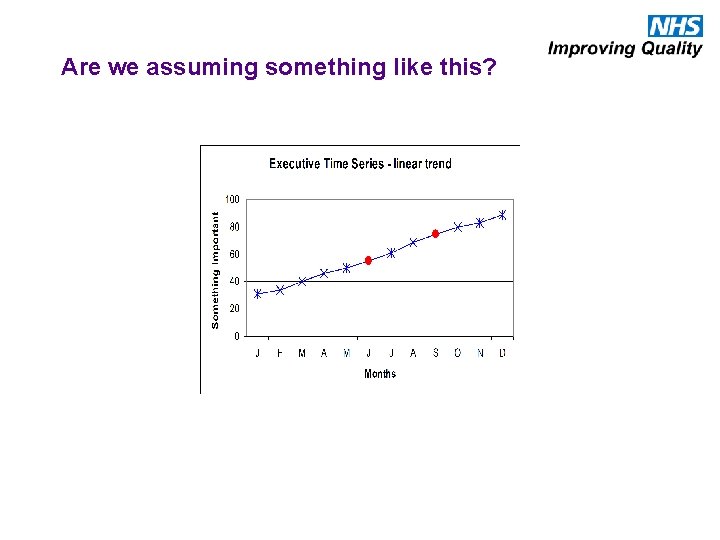
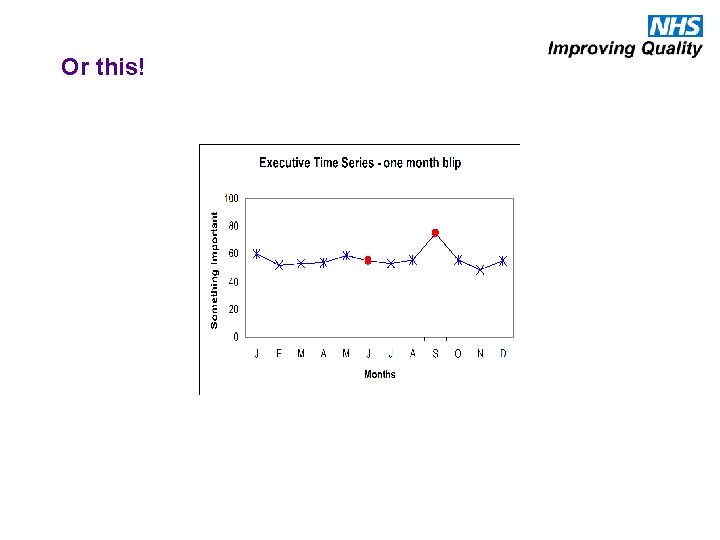
Are we assuming something like this?
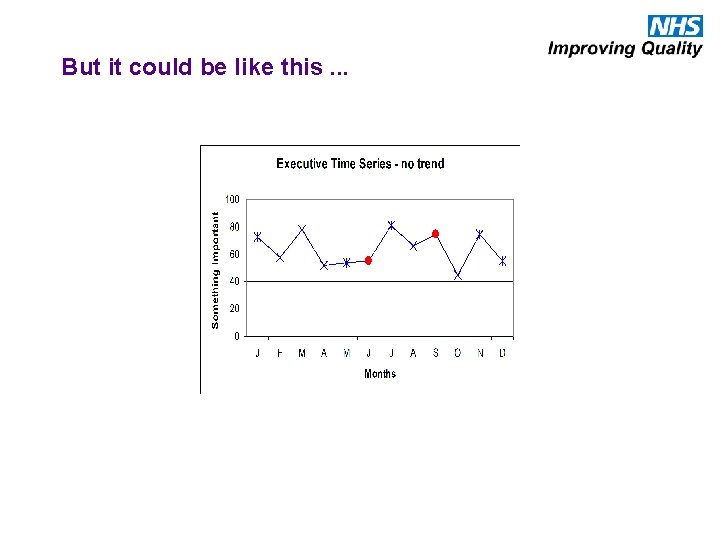
But it could be like this. . .
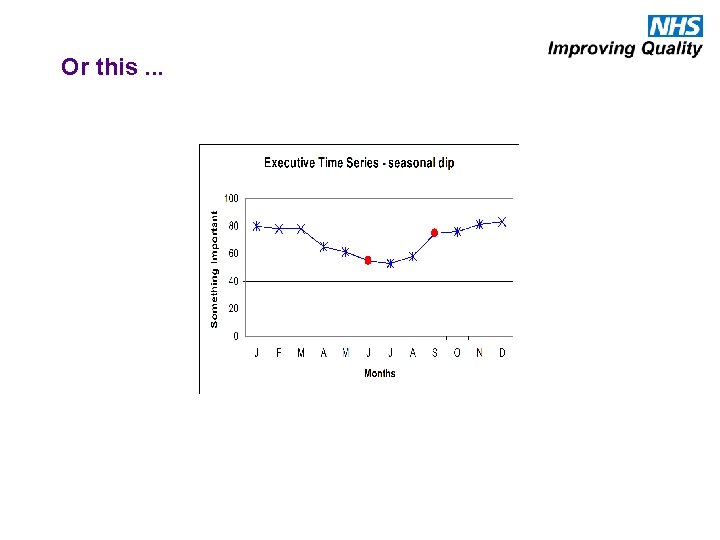
Or this. . .
Or this!
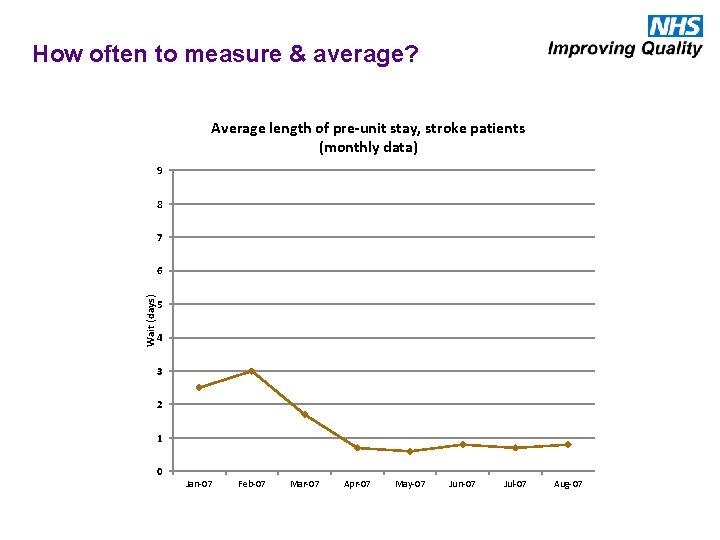
How often to measure & average? Average length of pre-unit stay, stroke patients (monthly data) 9 8 7 Wait (days) 6 5 4 3 2 1 0 Jan-07 Feb-07 Mar-07 Apr-07 May-07 Jun-07 Jul-07 Aug-07
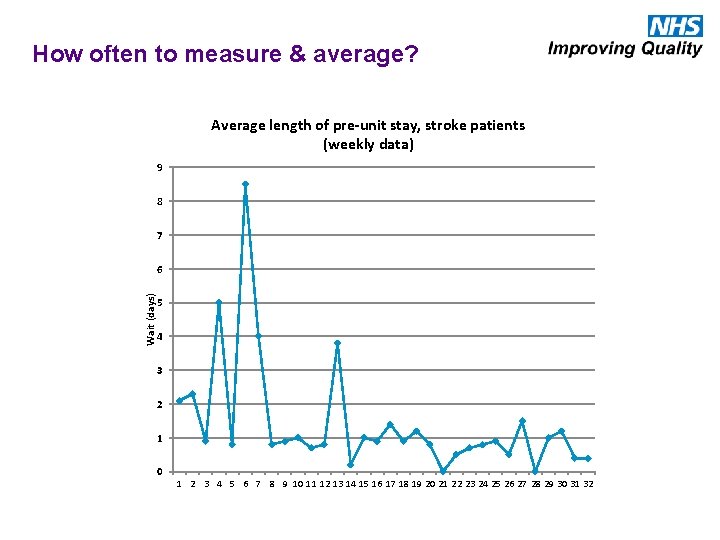
How often to measure & average? Average length of pre-unit stay, stroke patients (weekly data) 9 8 7 Wait (days) 6 5 4 3 2 1 0 1 2 3 4 5 6 7 8 9 10 11 12 13 14 15 16 17 18 19 20 21 22 23 24 25 26 27 28 29 30 31 32
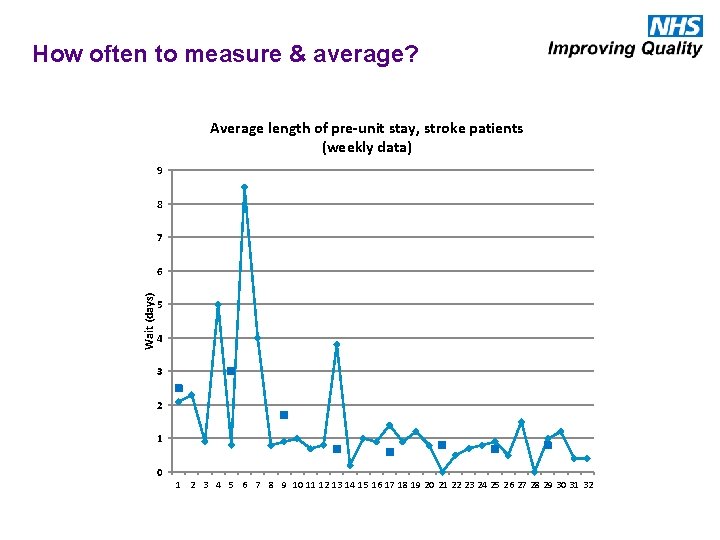
How often to measure & average? Average length of pre-unit stay, stroke patients (weekly data) 9 8 7 Wait (days) 6 5 4 3 2 1 0 1 2 3 4 5 6 7 8 9 10 11 12 13 14 15 16 17 18 19 20 21 22 23 24 25 26 27 28 29 30 31 32
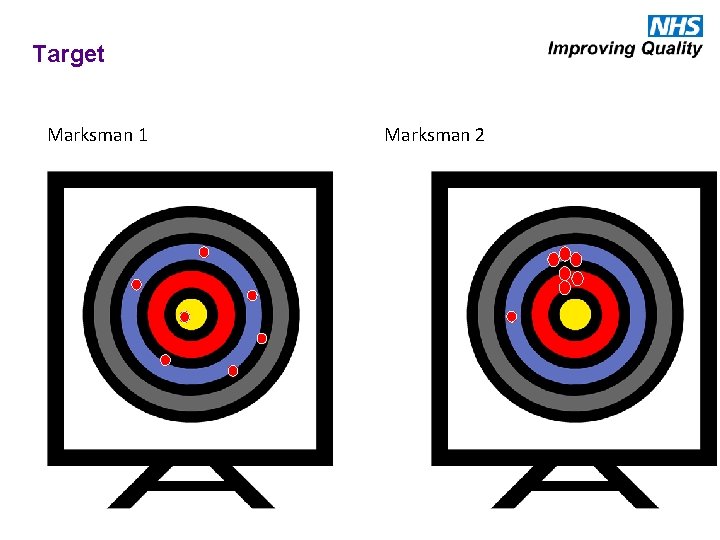
Target Marksman 1 Marksman 2
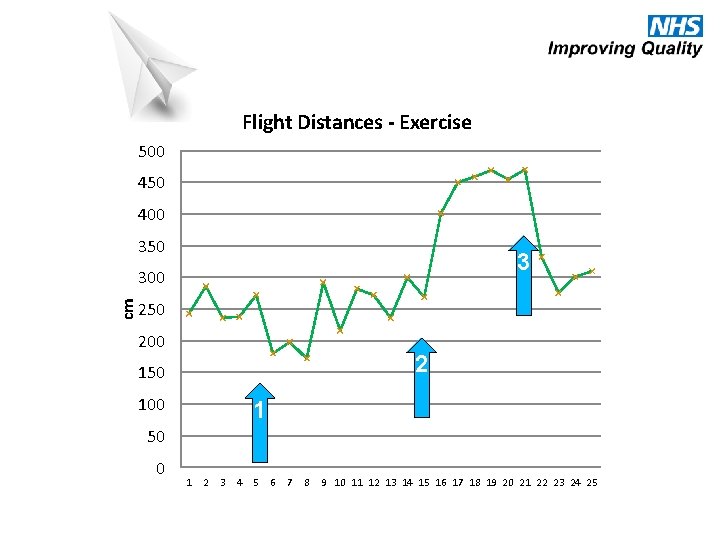
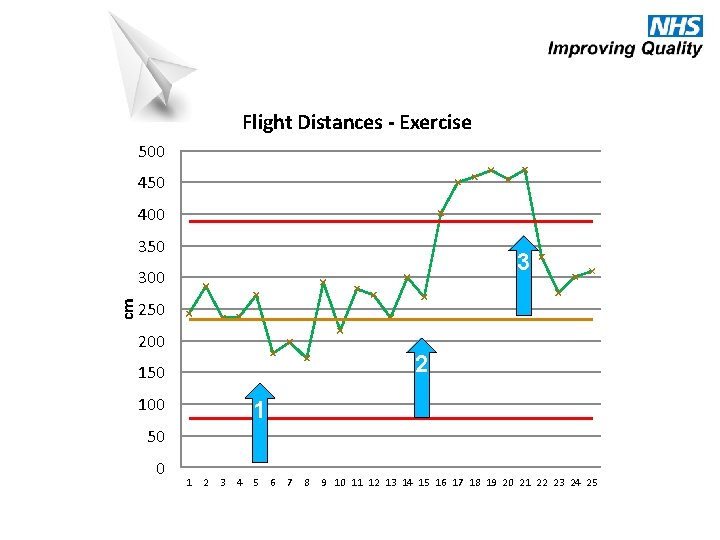
Flight Distances - Exercise 500 450 400 350 3 cm 300 250 200 2 150 100 1 50 0 1 2 3 4 5 6 7 8 9 10 11 12 13 14 15 16 17 18 19 20 21 22 23 24 25
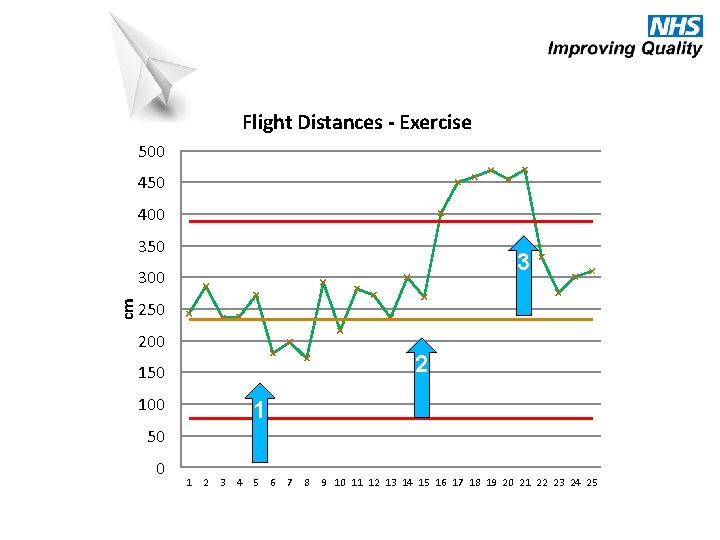
Flight Distances - Exercise 500 450 400 350 3 cm 300 250 200 2 150 100 1 50 0 1 2 3 4 5 6 7 8 9 10 11 12 13 14 15 16 17 18 19 20 21 22 23 24 25
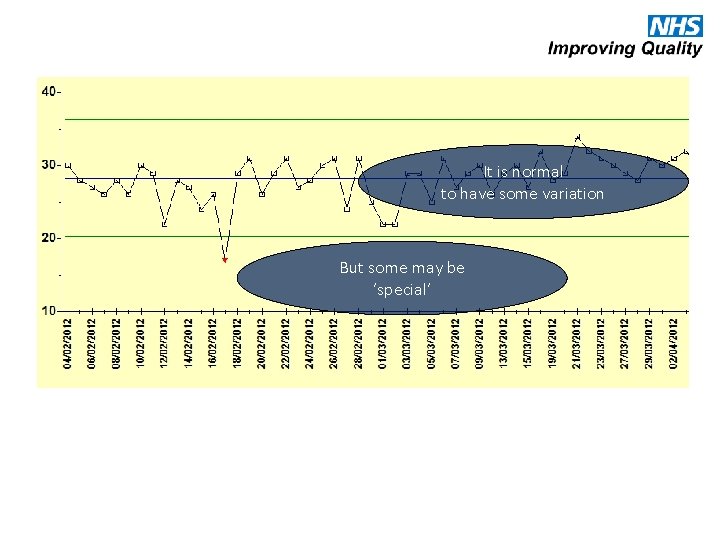
It is normal to have some variation But some may be ‘special’
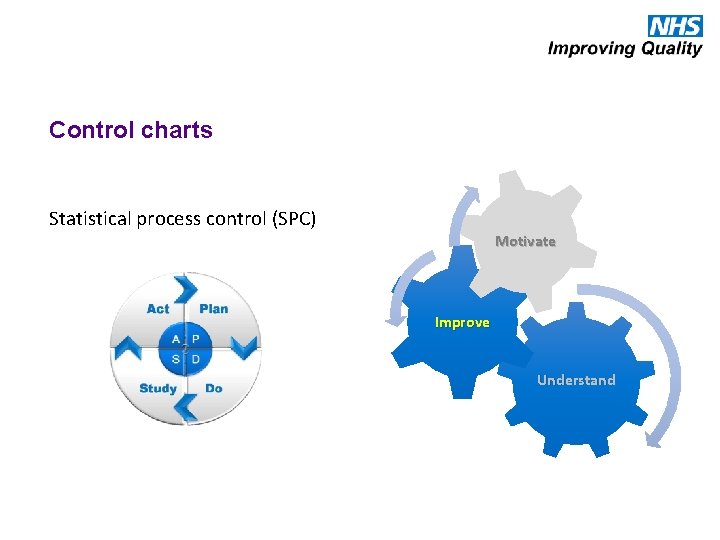
Control charts Statistical process control (SPC) Motivate Improve Understand
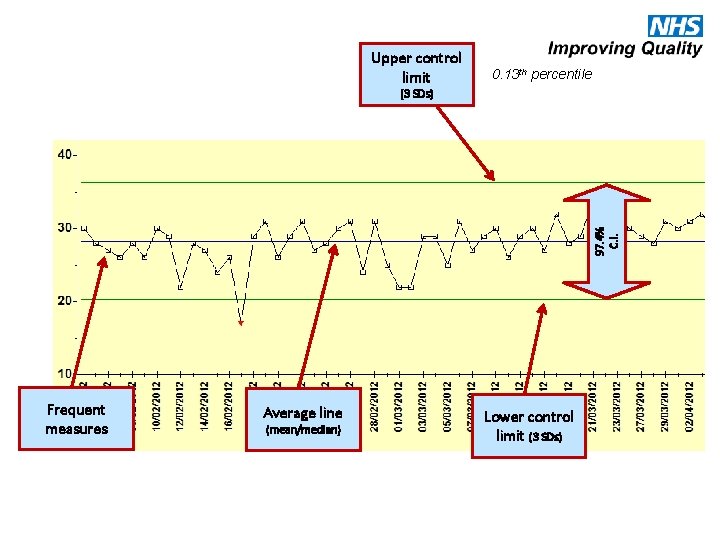
Upper control limit 0. 13 th percentile 97. 4% C. I. (3 SDs) Frequent measures Average line (mean/median) Lower control limit (3 SDs)
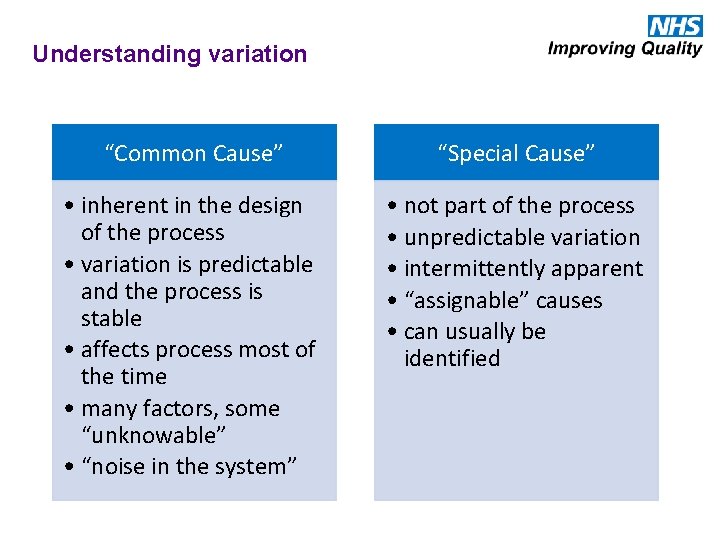
Understanding variation “Common Cause” “Special Cause” • inherent in the design of the process • variation is predictable and the process is stable • affects process most of the time • many factors, some “unknowable” • “noise in the system” • not part of the process • unpredictable variation • intermittently apparent • “assignable” causes • can usually be identified
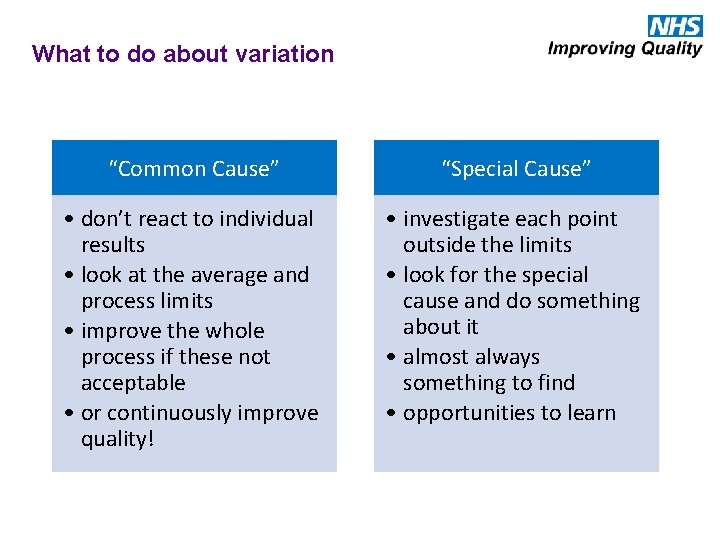
What to do about variation “Common Cause” “Special Cause” • don’t react to individual results • look at the average and process limits • improve the whole process if these not acceptable • or continuously improve quality! • investigate each point outside the limits • look for the special cause and do something about it • almost always something to find • opportunities to learn
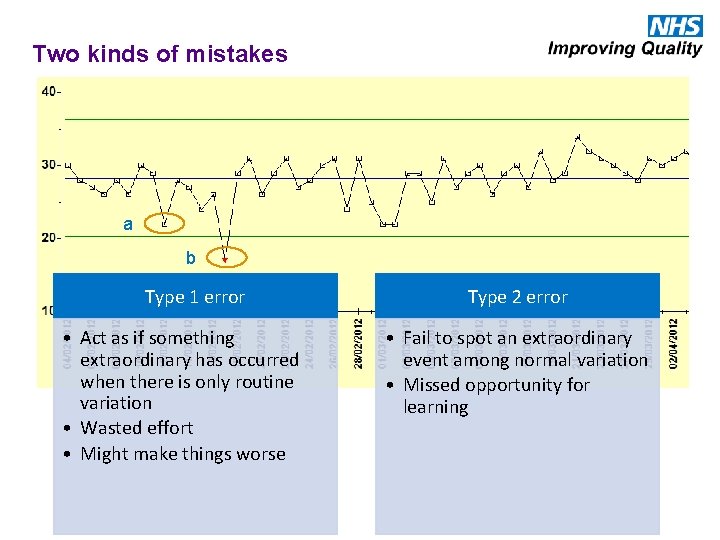
Two kinds of mistakes a b Type 1 error • Act as if something extraordinary has occurred when there is only routine variation • Wasted effort • Might make things worse Type 2 error • Fail to spot an extraordinary event among normal variation • Missed opportunity for learning
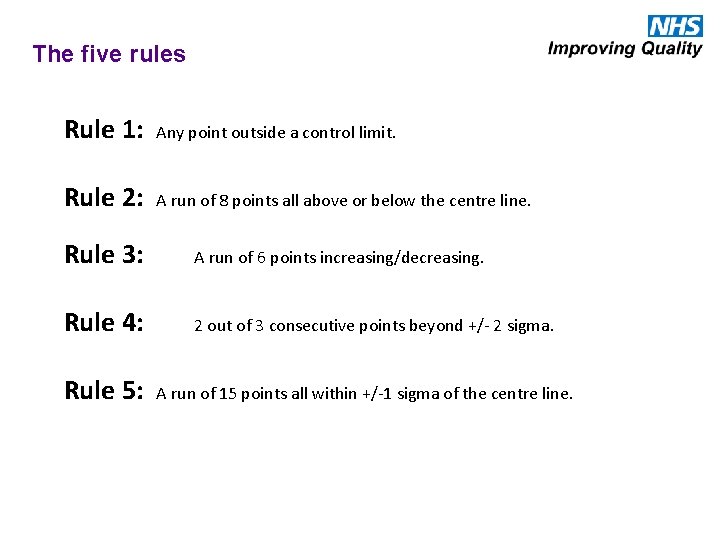
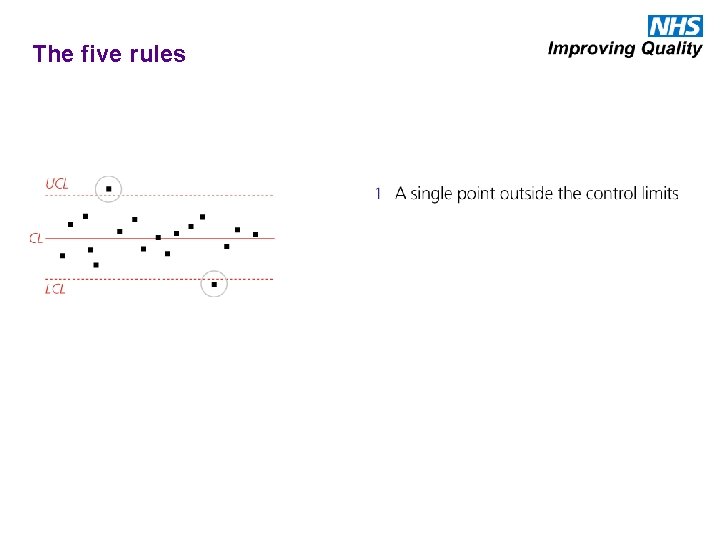
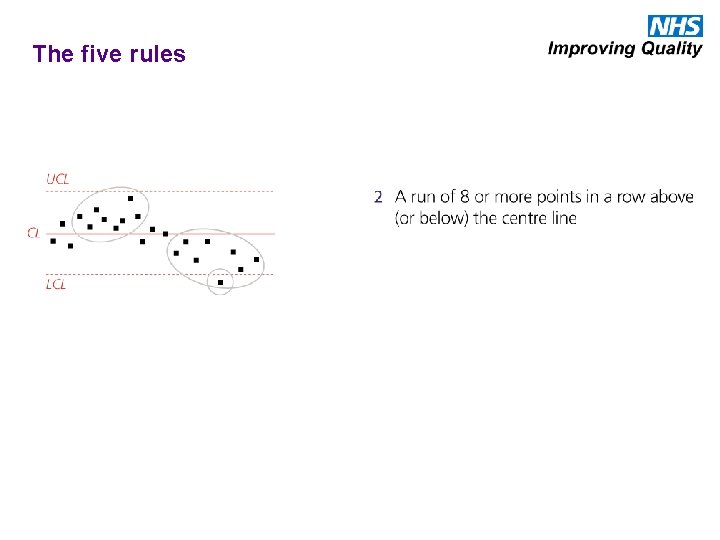
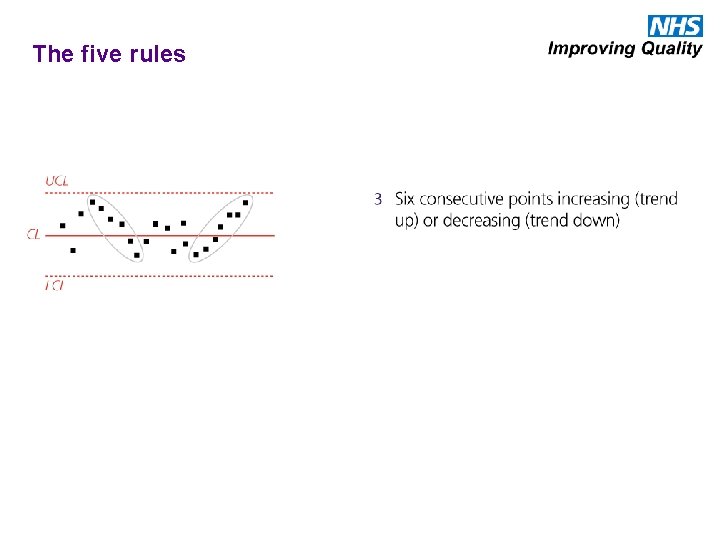
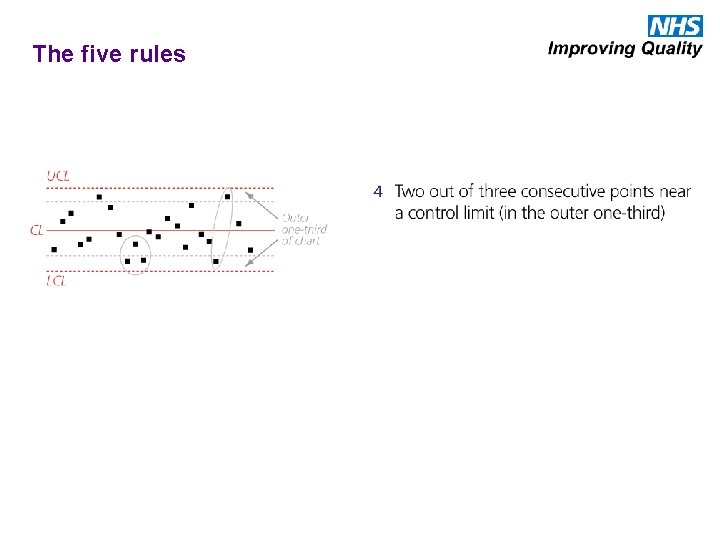
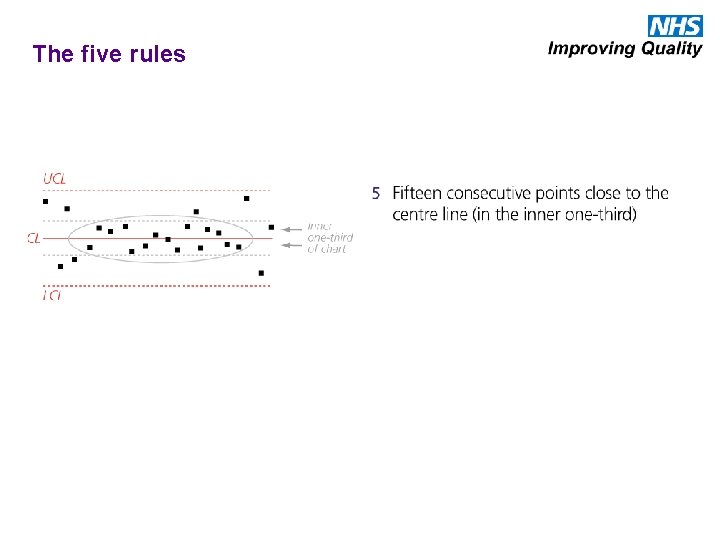
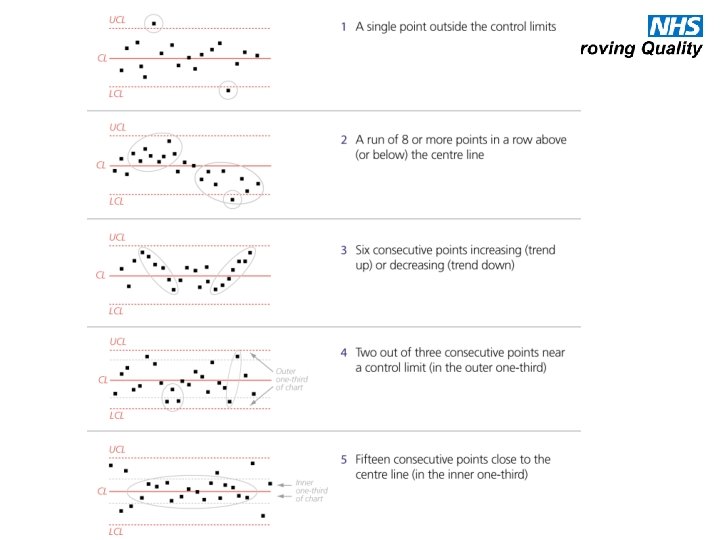
The five rules Rule 1: Any point outside a control limit. Rule 2: A run of 8 points all above or below the centre line. Rule 3: A run of 6 points increasing/decreasing. Rule 4: 2 out of 3 consecutive points beyond +/- 2 sigma. Rule 5: A run of 15 points all within +/-1 sigma of the centre line.
The five rules
The five rules
The five rules
The five rules
The five rules
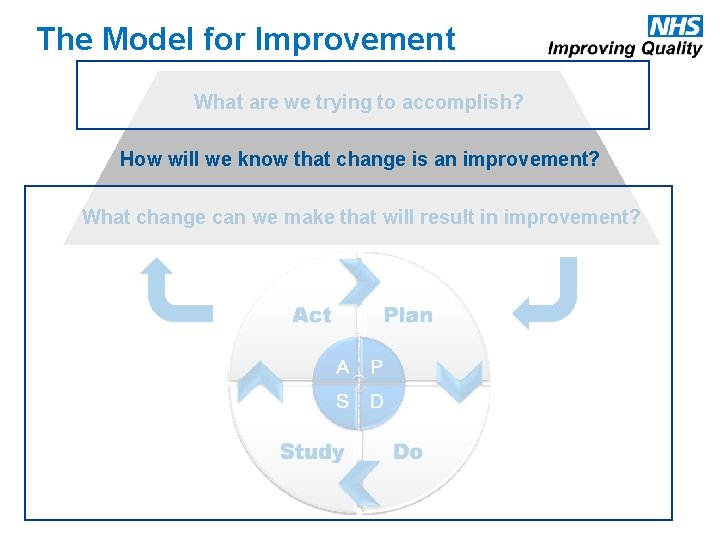
The Model for Improvement What are we trying to accomplish? How will we know that change is an improvement? What change can we make that will result in improvement?
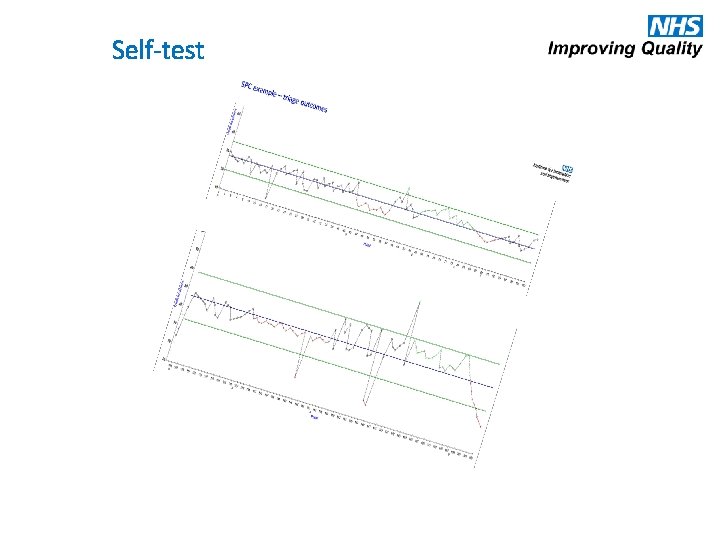
Self-test
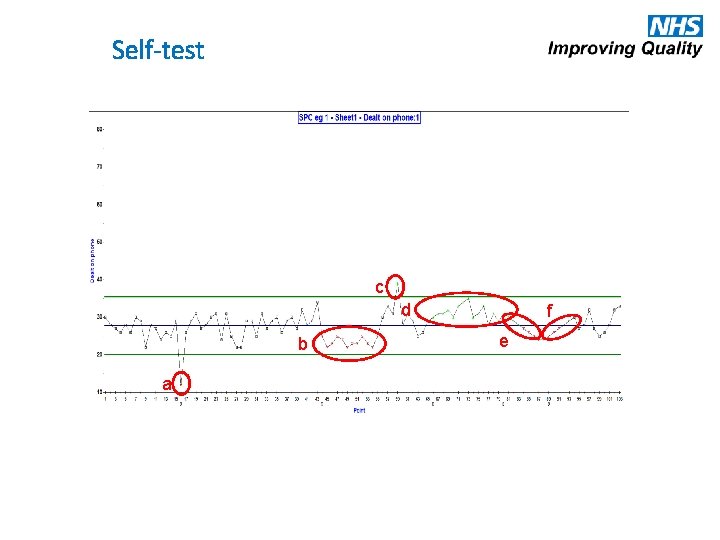
Self-test c d b a f e
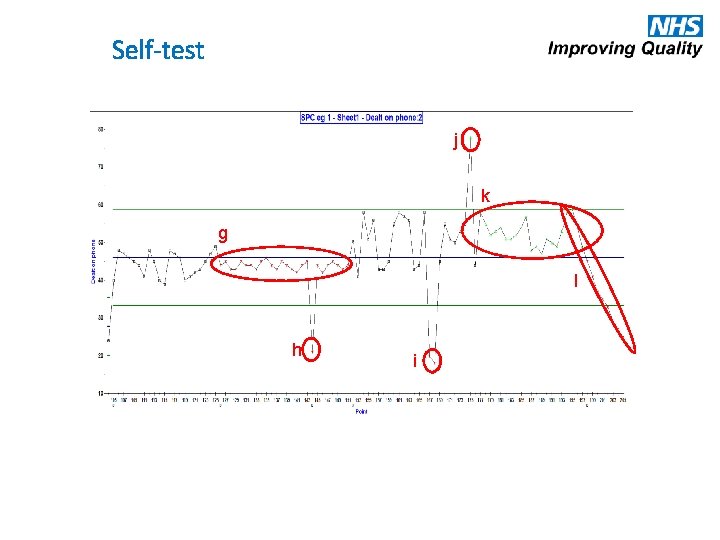
Self-test j k g l h i
Flight Distances - Exercise 500 450 400 350 3 cm 300 250 200 2 150 100 1 50 0 1 2 3 4 5 6 7 8 9 10 11 12 13 14 15 16 17 18 19 20 21 22 23 24 25
Software suggestions There is a huge number of software packages which perform analysis for statistical process control. Among them, some of the most accessible are: • Very cheap. • • Cheap. • • Baseline www. valuesystemdesign. com/Baseline_01. htm Winchart prismeurope. co. uk/software/ More comprehensive. • • Minitab. www. minitab. com Chart Runner. www. pqsystems. co. uk
Measurement for improvement recap 1. Remember variation exists 2. Define what you are collecting clearly 3. Only interpret data using statistically significant measures 4. Use time series data/run charts/ SPC for all stages of your project 8 3
Engaging Clinicians in Safety and Quality
Primary professional and business focus • The quality of care they personally deliver as clinicians • The economics of their own practice 2007 Reinertsen “Engaging Physicians in Quality and Safety”
GP authority in the practice almost all actions in the practice are derivative of GP decisions and recommendations.
Personal responsibility & autonomy • Lack of a systems view • Tendency to blame individuals
Next Steps
In Summary Harm is common The best and most caring people harm patients Human error is normal Culture is key Systems protect patients Get a full picture of what is harming patients
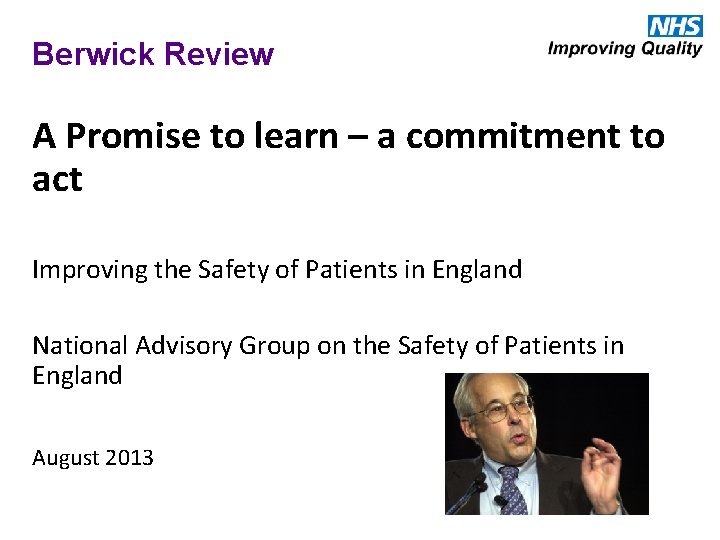
Berwick Review A Promise to learn – a commitment to act Improving the Safety of Patients in England National Advisory Group on the Safety of Patients in England August 2013
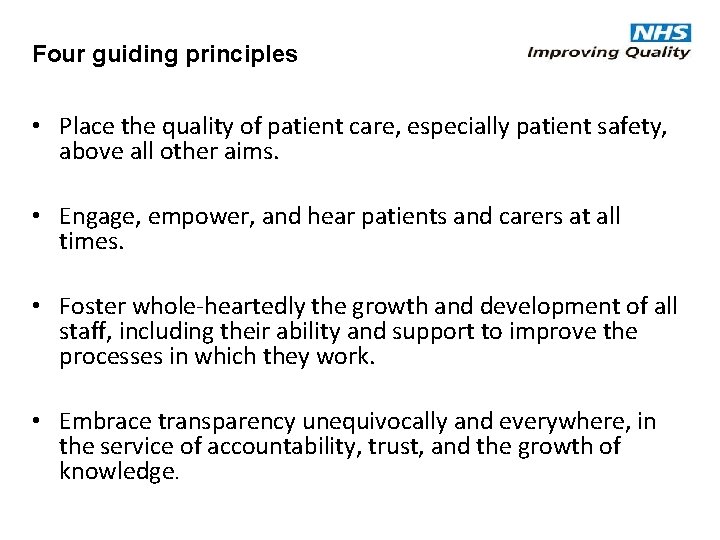
Four guiding principles • Place the quality of patient care, especially patient safety, above all other aims. • Engage, empower, and hear patients and carers at all times. • Foster whole-heartedly the growth and development of all staff, including their ability and support to improve the processes in which they work. • Embrace transparency unequivocally and everywhere, in the service of accountability, trust, and the growth of knowledge.
Where to start ? Communication Prescribing
A story…. . “The NHS belongs to the people. ”