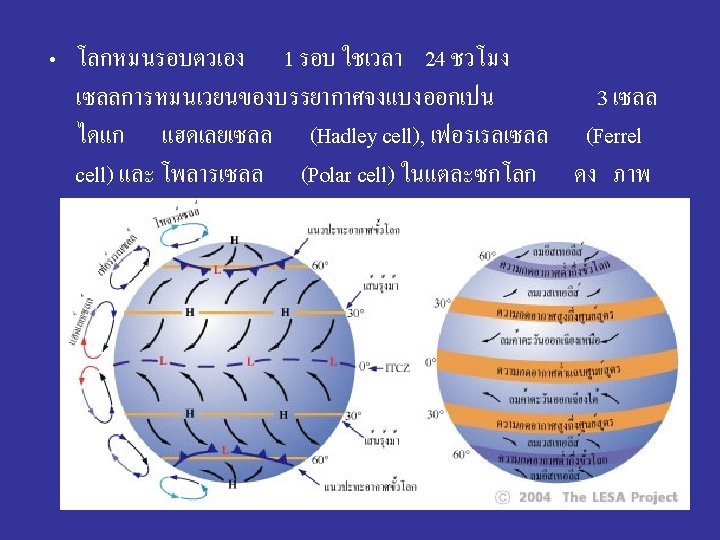
NITROGEN 78 084 OXYGEN 20 946 ARGON 0
 • NITROGEN 78. 084 • OXYGEN 20. 946 • ARGON 0. 934")


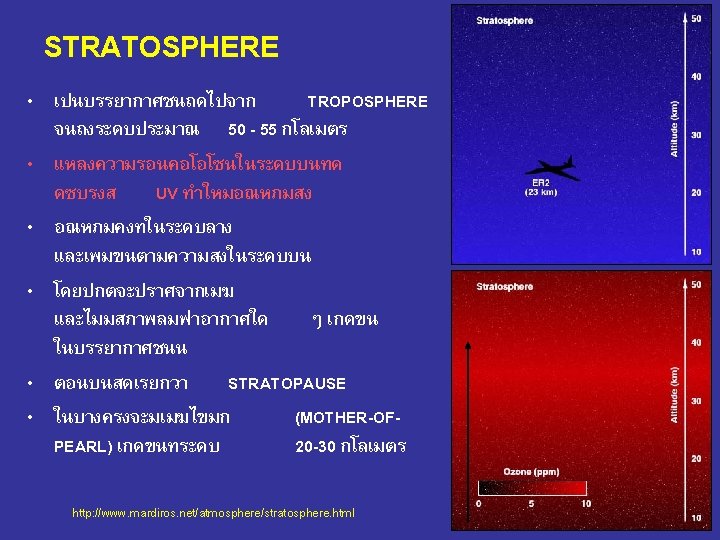

 • Nacreous Cloud 16")


")


: -0. 2°C / 100 m Dry")
: -0. 5°C / 100")
 CIRROCUMULUS (Cc) CIROSTRATUS (Cs) Ø ชนตำ")


 51 http:")
 52 http: //www.")


 with rain, snow, or hail showers 55 http:")


 – 30 degrees (horse latitudes) • บรเวณทอยระหวาง cold")


 • PRESSURE GRADIENT FORCE")

 Vg Geostrophic wind blows parallel to isobars or height contours Vg")


 http:")


 • Trade winds promote cold water upwelling in eastern")


- Slides: 141
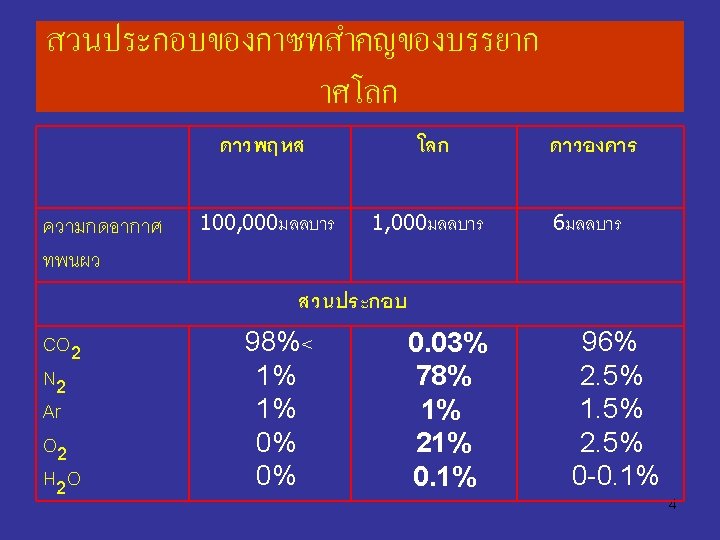
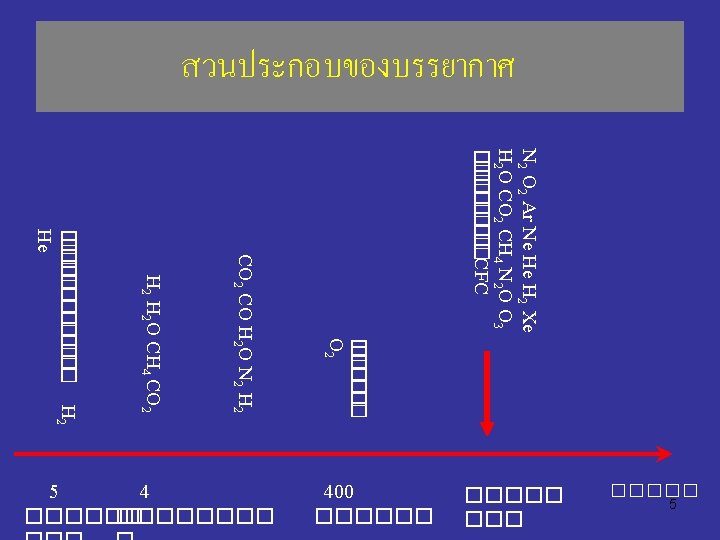
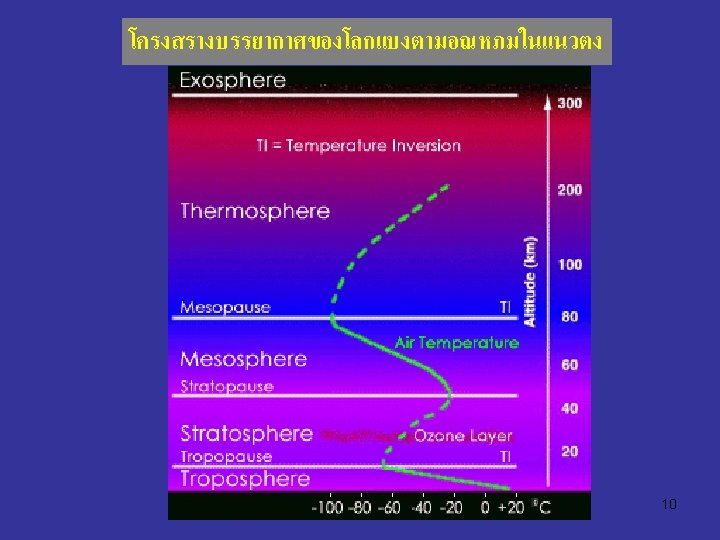
����������� (%) • NITROGEN 78. 084 • OXYGEN 20. 946 • ARGON 0. 934 • CARBON DIOXIDE 0. 033 • NEON 0. 00182 • HELIUM 0. 00052 • ���� 0. 00066 (KRYTON, HYDROGEN, XENON, OZONE, RADON, ETC. ) 6
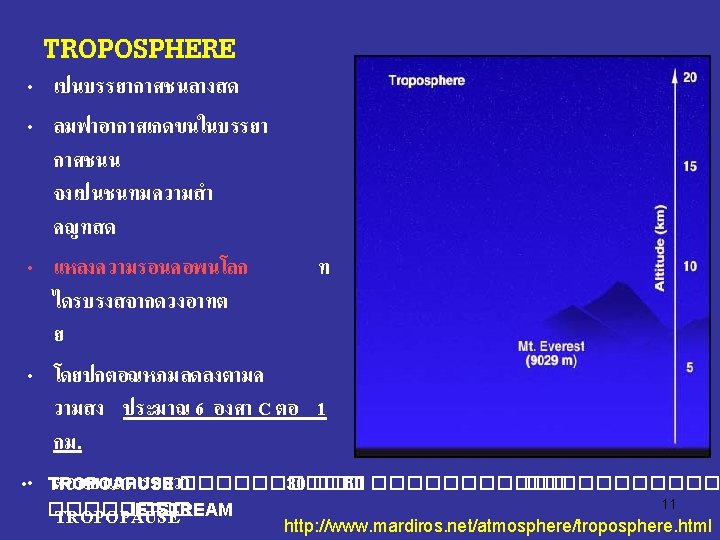
12 http: //www. mardiros. net/atmosphere/troposphere. html
JETSTREAM 13
15
เมฆไขมก (MOTHER-OF-PEARL CLOUD) • Nacreous Cloud 16
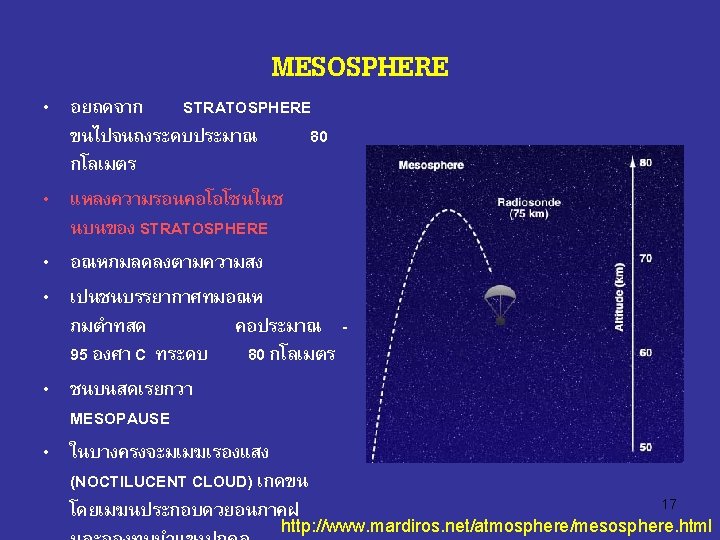
NOCTILUCENT CLOUD 18
22
25
นำกบบรรยากาศ Earth Surface 70% Ocean and Lakes Much of Land covered in Ice Clouds - liquid droplets and Ice Water Strong influence on Temperature (Convection + Hydrologic Cycle) 26
Water Vapor and Liquid Water Gas** Highly Compressible within Limits. Limit Changes Its Phase. Water Vapor Changes Phase at Ordinary Temperatures Found on Earth. Saturation** Air Contains as Much Water as Possible. 27
Evaporation and Condensation Evaporation Water Molecules Break Surface and Escape Condensation Water Vapor Collides with Surface Bonds with Adjacent Molecules Saturation Evaporation Rate = Condensation Rate 28
Sublimation and Deposition Sublimation Changes Phase Directly from Solid to Gas Ice to Water Vapor Deposition Changes Phase Directly from Gas to Solid Water Vapor to Ice 29
Homogeneous Nucleation Highly Curved Droplets Require Supersaturation to Keep From Evaporating away Droplets 0. 1 m - require RH* = 300% (Supersaturation of 200%) 1. 0 m - require RH* = 110% (Supersaturation of 10%) Supersaturation Droplets Require High Humidity to Balance Evaporation and Condensation Pure Water Can Be Achieved only By Chance Collisions and Bonding Seldom Occurs RH* = Relative Humidity 30
Heterogeneous Nucleation Aerosols Hygroscopic - Water Attracting Particles Heterogeneous Nucleation Formation of Water Droplets on Hygroscopic Aerosols Condensation Nuclei Condensation is the Dissolving of Condensation Nuclei into the Water Forms a Solution 31
Condensation Nuclei Natural Continental Dust Sea Salt Volcanic Eruptions Natural Fires Marine Plankton Human (More Northern Hemisphere) Anthropogenic Burning Transportation Power Plants Chemical Plants 32
Cooling The Air to the Dew Point Most Important Mechanism For Cloud Formation Lowering the Temperature to the Dew Point or Frost Point Air Temperature Changes 1. Removal or Input of Heat Diabatic Process 2. No Removal or Input of Heat Adiabatic Process 33
Adiabatic Processes • No Heat is Added or Removed - not diabatic Changes in Temperature Without Changes in Energy Common in Atmosphere • Most Important Way to Form Clouds 34
Dry Adiabatic Lapse Rate Unsaturated Air Rises Surrounding Air Lower Pressure And Cooler therefore it expands and Cools DALR = 1. 0°C per 100 meters (Constant for Dry Air) 35
Condensation and Dry Adiabatic Lapse Rate Unsaturated Air Rises Cools to Dew Point (Frost) and Condensation (Disposition) Occurs Lifting Condensation Level (LCL) 36
Saturated Adiabatic Lapse Rate SALR Average Value is 0. 5 °C per 100 meters It is not Constant Varies with Temperature Higher Temperatures Produces a Lower Rate Cooling Gives Lower Water Content More Condensation and Release of Latent Heat At Lower Temperatures Less to Release Half of DALR Release of Latent Heat Offsets Cooling By Expansion 37
Environmental Lapse Rate Vertical Change in Temperature in Still Air Troposphere Decreasing Temperature Highly Variable Day to Day Place to Place One Altitude To Another Can Be Steep - Changes Rapidly ELR = 0. 5°C DALR = 1. 0°C 38
General Forms of Condensation 1. Dew 2. Frost 3. Frozen Dew 4. Fog Radiation Fog Advection Fog Upslope Fog Precipitation Fog Steam Fog 5. Clouds 39
Clouds Condensation Form: Clouds Predominant Process: Usually by lifting of air and adiabatic cooling. Characteristics: Concentration of suspended droplets and/or ice crystals in air well above the surface. 40
Formation of Clouds Dew Point Lapse Rate (DPLR): -0. 2°C / 100 m Dry Adiabatic Lapse Rate (DALR): -1. 0°C / 100 m At Surface Dew point is 10°C and Air Temperature is 18°C Temperatures Will be the Same at 1000 m Lifting Condensation Level (LCL) is 1000 m where Cloud Droplets Form. In Another 50 m All the Condensation Nuclei are Used Up and Any Additional Lifting will Only Increase Droplet 41 Size.
Dissipation of Clouds Warms by Saturated Adiabatic Lapse Rate (SALR): -0. 5°C / 100 m Reaches LCL and Warms by Dry Adiabatic Lapse Rate (DALR): 1. 0°C / 100 m As All the droplets have evaporated. Condensation and Dissipation are Reversible Except When Some of the Moisture is Lost by Precipitation. 42
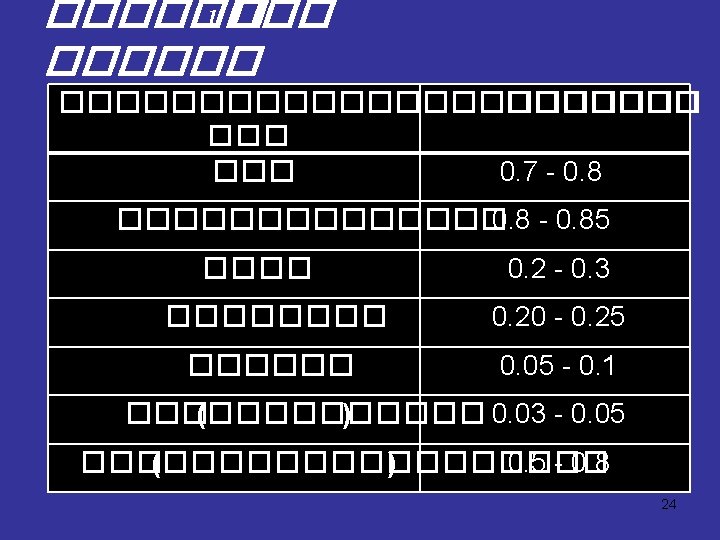
����� Ø ชนสง (6 -18 กม(. CIRRUS (Ci) CIRROCUMULUS (Cc) CIROSTRATUS (Cs) Ø ชนตำ (ผวพน – 2 กม(. NIMBOSTRATUS (Ns) STRATOCUMULUS (Sc) STRATUS (St) Ø ชนกลาง (2 -8 กม. ) ALTOCUMULUS (Ac) ALTOSTRATUS (As) Ø เมฆกอตวในแนวตง (ผวพน – 18 กม(. CUMULUS (Cu) CUMULONIMBUS (Cb) 44
45
Cirrus Composition: ice crystals Appearance: fibrous 46 http: //www. ucompass. com/met 1010/lectures/013098/cloud. htm
Cirrostratus Thin, sheet-like veil Halo around sun or moon 47 http: //www. ucompass. com/met 1010/lectures/013098/cloud. htm
Cirrocumulus Tightly packed cumuliform elements “Mackerel sky” 48 http: //www. ucompass. com/met 1010/lectures/013098/cloud. htm
Altostratus Gray veil “Watery” sun 49 http: //www. ucompass. com/met 1010/lectures/013098/cloud. htm
Altocumulus Composition: supercooled water and ice crystals Appearance: thick puff 50 http: //www. ucompass. com/met 1010/lectures/013098/cloud. htm
Stratus Composition: water droplets or ice Appearance: thick gray, featureless layaer (overcast) 51 http: //www. ucompass. com/met 1010/lectures/013098/cloud. htm
Stratocumulus Layer-like, but showing some cumuliform shape (flat blobs or rolls) 52 http: //www. ucompass. com/met 1010/lectures/013098/cloud. htm
Nimbostratus Thick, dark gray overcast with rain or snow 53 http: //www. ucompass. com/met 1010/lectures/013098/cloud. htm
Cumulus Generally puffy clouds 54 http: //www. ucompass. com/met 1010/lectures/013098/cloud. htm at low altitude
Cumulonimbus Very tall cumuliform cloud (“towering”) with rain, snow, or hail showers 55 http: //www. ucompass. com/met 1010/lectures/013098/cloud. htm
56
57
58
59
60
Radiation Budget at the top of the Earth’s Atmosphere Source: 63 http: //apollo. lsc. vsc. edu/classes/met 130/notes/chapter 3/graphics/energybal 4. free. gif
72
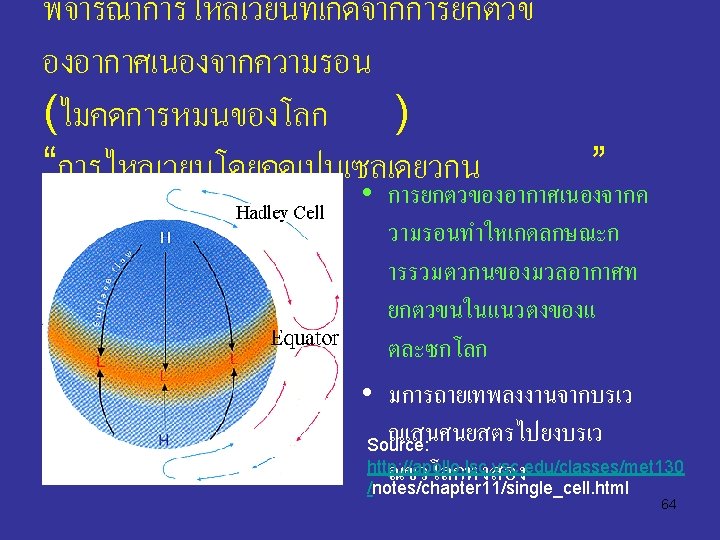
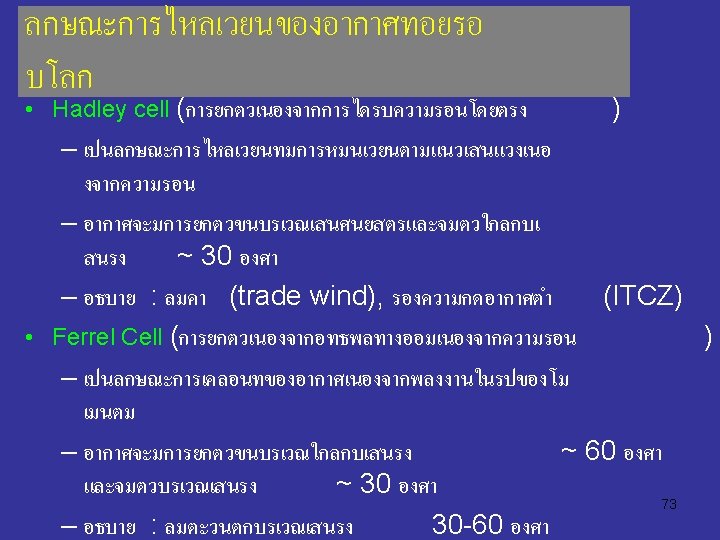
• ลมออนใกลกบเสนศนยสตร – Equator (doldrums) – 30 degrees (horse latitudes) • บรเวณทอยระหวาง cold polar air and mid-latitude warmer air เรยกวา polar front 74
75
76
84
86
88
Air Mass Properties • Air masses take on the properties of the underlying surface • Air masses are classified according to their location of origin • Geographical Characteristics – Tropical, Polar, Arctic • Surface Properties – Maritime, continental • Source region characteristics most prevalent if air mass remain over source region for a long period 90
Air Mass Classifications • c. P - continental Polar – Cold, dry, stable • m. P - miritime Polar – Cool, moist, unstable • m. T - maritime Tropical – Warm, moist, usually unstable • c. T - continental Tropical – Hot, dry – Stable air aloft, unstable surface air 91
Air Mass Source Regions Source: 92 http: //www. uwsp. edu/geo/faculty/ritter/geog 101/textbook/weather_systems/air_masses_t
The Pineapple Express brings heavy rain • Warm, moist m. T air moves into California on Jan. 1, 1997 • Heavy flooding caused 100, 000 people to flee their homes • Yesemite NP experienced nearly $200 million in damages and was closed for two months 93
Air mass characteristics can differ tremendously 94
Fronts A Front - is the boundary between air massed; normally refers to where this interface intersects the ground (in all cases except stationary fronts, the symbols are placed pointing to the direction of movement of the interface (front)) 95
Characteristics of Fronts • A cross the front - look for one more of the following: – Change of Temperature – Change of Moisture characteristic • RH, Td – Change of Wind Direction – Change in direction of Pressure Gradient – Characteristic Precipitation Patterns 96
How do we decide what kind of front it is? • From the vantage point of the ground, if warm air replaces colder air, the front is a warm front • If cold air replaces warmer air, the front is a cold front • If the front does not move, it is a stationary front • Occluded fronts do not intersect the ground; the interface between the air masses is aloft 97
Typical Cold Front Structure • Cold air replaces warm; leading edge is steep in fast-moving front shown below due to friction at the ground – Strong vertical motion an unstable air forms cumuliform clouds – Upper level winds blow ice crystals downwind creating cirrus and cirrostratus • Slower moving fronts have less steep boundaries and less vertically developed clouds may form if warm air is stable 98
Typical Warm Front Structure • In an advancing warm front, warm air rides up over colder air at the surface; slope is not usually very steep • Lifting of the warm air produces clouds and precipitation well in advance of boundary • At different point along the warm/cold air interface, the precipitation will experience different temperature histories as it falls to the ground 99
COLD FRONT WARM FRONT 100
Mid-latitude Cyclone Frontal Structure 101
Mature Wave Cyclone 102
Partially occluded wave cyclone • Cold-occluded front • Approach brings weather sequence like a warm front • Frontal passage brings weather more like a cold front • Warm-occluded fronts also possible 103
104
Scale of Motion • Microscale : meters – Turbulent eddies • Formed by mechanical disturbance or convection • Lifetimes of minutes • Mesoscale : km’s to 100’s of km’s – Local winds and circulaitons • Land/sea breeze, mountain/valley winds, thunderstorm, tornadoes • Lifetimes of minutesto hours • Synoptic scale : 100’s to 1000’s of km’s – Circulations around high and low pressure systems • Lifetimes of days to weeks 105 • Global scale : systems ranging over entire globe
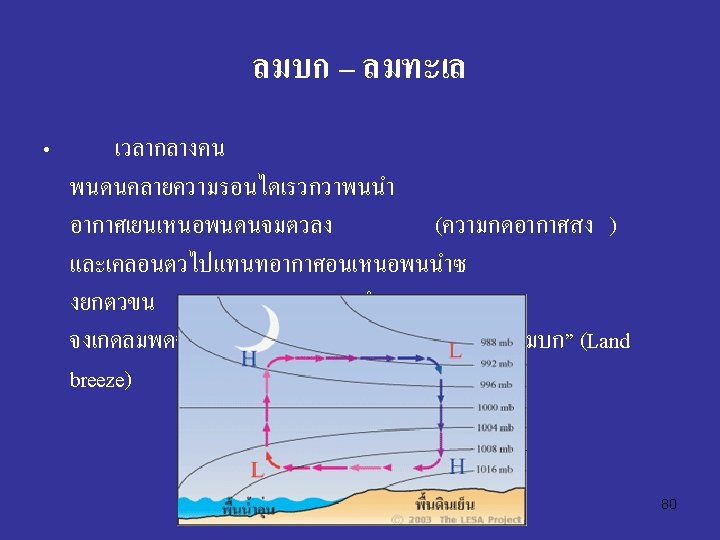
Sea and Land Breezes • Sea and land breeze – Mesoscale coastal winds – Thermal circulations driven by differential heating/cooling of adjacent land water surfaces – Most prevalent when/where solar heating is strong • Sea breeze development – Solar heating raises land temperature more than • Sea breezes water • Cool coastal comunities – Air in contact with land warms and rises • Bring more humid air – Cooler (denser) sea air move in to replace rising air • Haze over land • Fog – Air sinking over the water in response to surface air • Often produce summer thunderstorms movement, producing return circulation (land-to-sea inland from the coast 106 breeze) aloft
Sea / Land breezes • Covering gulf of Mexico and Atlantic sea breezes produce uplift and thunderstorm development in Florida – Disruption of sea breezes reduces rainfall and can lead to a bad fire season • Land breeze form at night due to stronger radiative cooling of the land surface leading to sinking and offshore flow of this cooler air mass with return flow aloft 107
The monsoon • Monsoon winds are – Seasonal – Common in eastern and southern Asia – Similar to huge land/sea breeze systems • During winter strong cooling produces a shallow high pressure area over Siberia – Subsidence, clockwise circulation and flow out from the high provide fair weather for southern and eastern Asia • During summer, air over the continent heats and rises, drawing moist air in from the oceans – Convergence and topography produce lifting and heavy rain formation 108
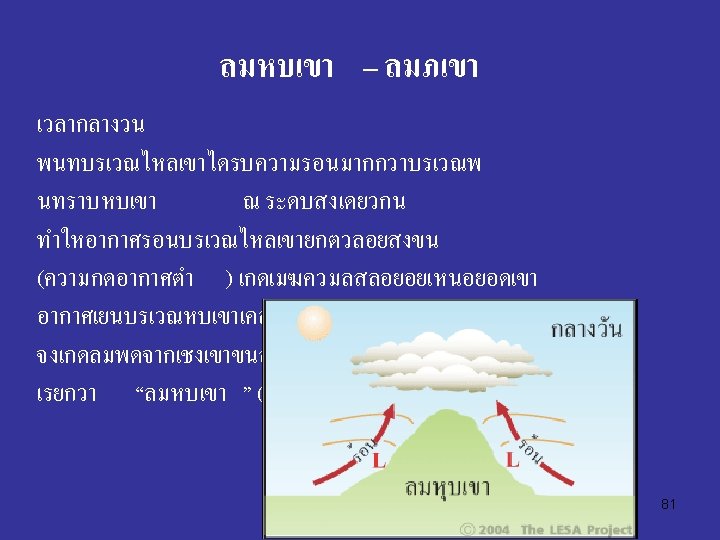
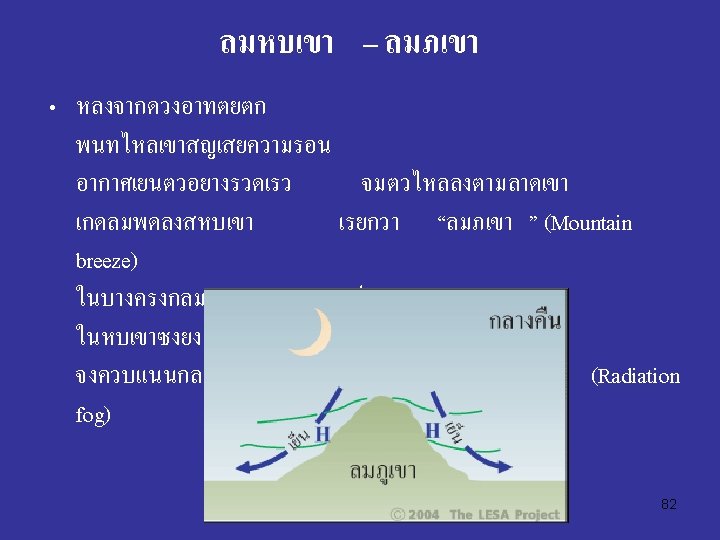
Mountain/Valley winds • Sunlight heats mountain slopes during the day and they cool by radiation at night • Air in contact with surface is heated/cooled in response • A difference in air density is produced between air next to the mountainside and air at the same altitude away from the mountain • Density difference produces upslope (day) or downslope (night) flow • Daily upslope/downslope wind cycle is strongest in clear summer weather when prevailing winds are light 109
Dynamic process of the atmosphere 110
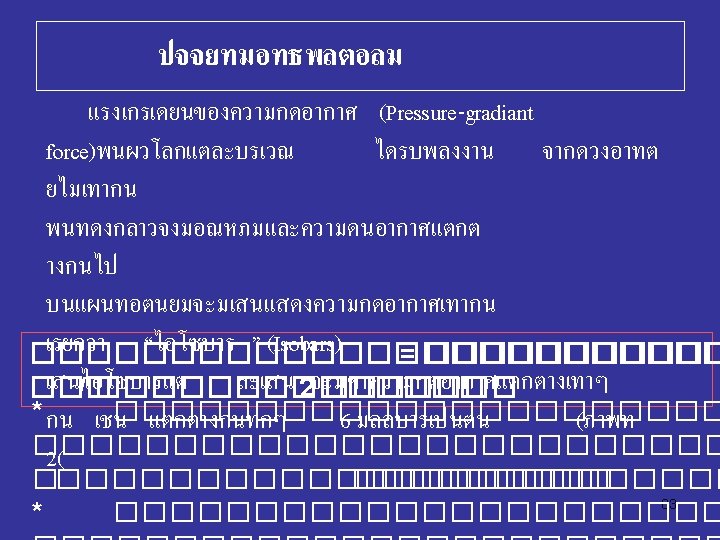
แรงตาง ๆ ทมอทธพลตอการเคลอนท • CORIOLIS FORCE (เปนฟงกชนของคาละตจด , ความเรวของวตถ ) • PRESSURE GRADIENT FORCE (PGF) Pressure Gradient = (P 2 – P 1) / (X 2 – x 1) PGF: Pressure=Force/area => Force=area x pressure = volume x pressure gradient (pressure gradient is change in pressure per unit distance) => Force = (mass/density) x pressure gradient • GRAVITY • CENTIPITAL FORCE 111
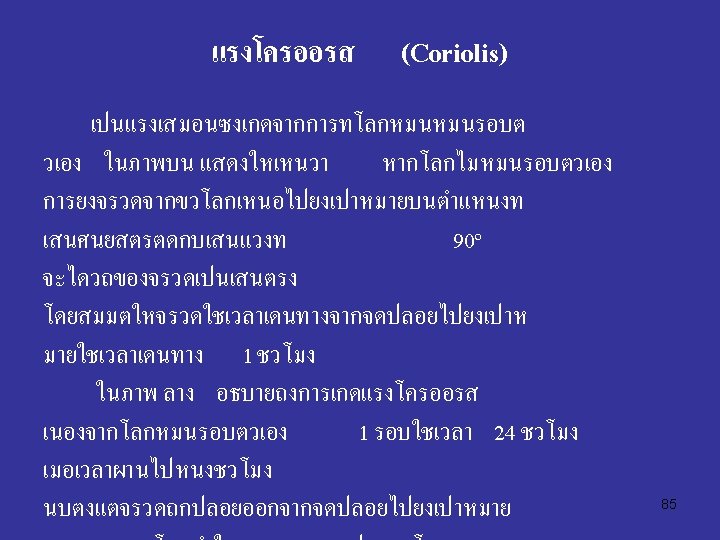
Coriolis Force • Objects, or parcels of air or water, moving relative to the Earth’s rotation (i. e. that we, as observers on the rotating Earth, see as moving) experience an additional centrifugal force. It is this force that is called the Coriolis Force. While the Coriolis force has the same mathematical form for northward and eastward motion the physical explanation is best presented differently: 112
Geostrophic wind (NH) Vg Geostrophic wind blows parallel to isobars or height contours Vg : steady-state wind blowing such that PGF is exactly balanced by Fcor 113 Source: http: //ww 2010. atmos. uiuc. edu/(Gh)/guides/mtr/fw/geos. rxml
Geostrophic balance 114
Thermal Wind Thermal Circulations • As discussed earlier, winds blow because of differences in atmospheric pressure. Pressure gradients may develop on a local to a global scale because of differences in the heating and cooling of the Earth's surface. Heating and cooling cycles that develop daily or annually can create several common local or regional thermal wind systems. The basic circulation system that develops is described in the generic illustrations below. 115
Thermal wind Cross-section of the atmosphere with uniform horizontal atmospheric pressure. http: //www. physicalgeography. net/fundamentals/7 o. html 116
Thermal Circulation Atmospheric circulation caused by the heating and cooling of air. Thermal High : Area of low pressure in the atmosphere caused by surface temperatures. Development of air flow in the upper atmosphere because of surface heating. Thermal Low : Area of high pressure in the atmosphere caused by surface temperatures. Development of a closed atmospheric circulation cell because of surface heating. http: //www. physicalgeography. net/fundamentals/7 o. html 117
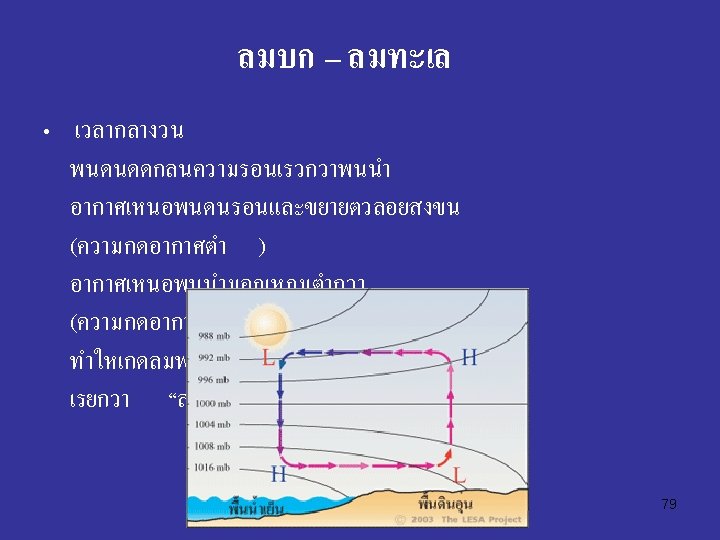
Daytime development of sea breeze Nighttime development of land breeze http: //www. physicalgeography. net/fundamentals/7 o. html 118
Daytime development of valley breeze Nightime development of mountain breeze http: //www. physicalgeography. net/fundamentals/7 o. html 119
Winter and Summer monsoon wind patterns for southeast Asia (large scale thermal wind) http: //www. physicalgeography. net/fundamentals/7 o. html 120
The Gradient Wind · When isobars are curved the geostrophic wind follows a curved path - the air/water is subject to a centrifugal force as well! · The gradient wind for anticyclonic flow is stronger than the geostrophic wind but for cyclonic flow is weaker 121
Gradient Winds 122
126
Left picture from the wonders of the weather by Bob Crowder 127
128
129
Tropical Cyclone 130
131
The Southern Oscillation Before 1950, Scientists noted that an inverse relationship existed in the surface atmospheric pressure observations at Darwin, Australia and Tahiti. - As air pressure increased at Darwin, it decreased at Tahiti and vice versa. - The Southern Oscillation Index tracks these pressure changes. - SOI = PDarwin - PTahiti It was noted that during large positive values, Floods were common in Australia while Droughts occurred during large negative events. - Of main concern were the droughts which devastated crop production in Australia. 132
SOI and El Nino It was not until the 1960’s that the link between the SOI and El Nino was discovered. - It was theorized that Sea Surface Temperatures (SSTs) in the Equatorial Pacific waters increased beyond normal conditions during negative SOI periods. - These warmer SST values result in a disruption of normal surface pressure values as well as cloud and precipitation patterns. This Phenomena was also noted by Peruvian fisherman, and since it seemed to occur near the time of Christmas, they called it El Nino. - El Nino events led to reduced catches for the fisherman 133
The Impacts of El Nino Even though El Nino is a warming of water in the Pacific. Ocean at the equator, the effects are GLOBAL. - Thus, a strong Perturbation in the ocean waters, leads to a local change in atmospheric pressure. - However, if the atmosphere is affected in one location, that sets off a “chain reaction” or “domino affect” which impacts weather patterns far removed from the originally affected area. - This phenomena is called Teleconnections. - This was graphically shown in the strong El Nino of 1982 - 1983. 134
La Nina During the 1990’s scientists began to recognize that the unusually Cold Water events that also occurred also greatly affect global weather patterns. - Called La Nina in reference to El Nino, also called El Viejo (the cold). - These colder SST values also result in a disruption of normal surface pressure values as well as cloud and precipitation patterns. The impacts near and around the equator tend to be opposite of El Nino. 135
El Nino Southern Oscillation (ENSO) • Trade winds promote cold water upwelling in eastern tropical Pacific – Cool, deep water is nutrient rich and supports rich ecosystem (plankton, fish, birds, …) • Weaker trades lead to weaker upwelling. Warm nutrient-poor tropical water replaces the cold, nutrient-rich water. • Every few years this El Nino (surface warming) persists and is widespread – Huge ecosystem and economic losses – Alters weather pattern over a large region 136
http: //www. cdc. noaa. gov/people/klaus. wolter/MEI/ 137
Strong Trade Winds Surface water flow towards west Convection over western Pacific Warm Pool over western Pacific Cool SST’s over Northern South America and Southern US Coasts Weak Trade Winds Surface water flow toward east Convection shifts to central Pacific Warm Pool shifts to central Pacific Warm SST’s over Northern Southern America and Southern US Coasts Source: http: //www. pmel. noaa. gov/tao/elnino/nino_normal. html 138
Sea Surface Temperature Anomalies 139
Why do we care about ENSO? • Global impacts on weather. • Long timescale (months) yields improved seasonal predicition. 140
Impacts of El Nino • Droughts – Fires – Agricultural productivity – Water supply • Extreme Precipitation – Floods – Erosions – Disease • Impacts through marine food chain – Natural ecological responses – Economics 141