Ecology Brainstorm Ecology is the study of the

Ecology Brainstorm

Ecology is the study of the relationships between living and non-living things. Biotic vs Abiotic

Biotic vs Abiotic

Ecology is the study of the relationships between living and non-living things. What is all that area that contains life called?

Ecology is the study of the relationships between living and non-living things. What is all that area that contains life called? The Biosphere- Anywhere life exists. Examples = land, water, & air

Biome -similar climate & species Ex = tundra, temperate forest

Where life exists –land, water, & air Biome /similar climate & species Ecosystem Interacting biotic and abiotic factors. Different populations in an area

Ecosystem Interacting biotic and abiotic factors. Community Different populations in an area

Population. Group of same species in area. Community Different populations in an area

Individual –one Member of a species Population. Group of same species in area. stop

Populations of species that interact can have a variety of relationships. Parasitism…

Parasites drain energy from other living organisms

Populations of species that interact can have a variety of relationships. • parasitism • predator – prey (predator eats prey)

Populations of species that interact can have a variety of relationships. • parasitism • predator - prey

Populations of species that interact can have a variety of relationships. • parasitism • predator – prey • mutualistic symbiosis (2 organisms live closely together both benefit.

Populations of species that interact can have a variety of relationships. • parasitism • predator – prey • mutualistic symbiosis (2 organisms live closely together both benefit.

Populations of species that interact can have a variety of relationships. • parasitism • predator – prey • mutualistic symbiosis (2 organisms live closely together both benefit. ) • commensalism (2 organisms live closely together 1 benefits the other is neither helped or harmed. )

• parasitism • predator – prey • mutualistic symbiosis (2 organisms live closely together both benefit. ) • commensalism (2 organisms live closely together 1 benefits the other is neither helped or harmed. ) monarch = poisonous viceroy = nonpoisonous

How did the viceroy evolve to use this type of camouflage? monarch = poisonous viceroy = nonpoisonous

Compare/Contrast Table of ways. Ecology is studied in a variety Section 3 -1 Ecological Methods Observation Experimental plots, field sites, laboratory Tapes, compass, Measuring Tools Tapes, compass, Global Positioning System, thermometer, sensors Magnifying Tools Binoculars, microscope, telescope Sites Written Record Go to Section: Field site Model Building Many sites for data collecting Aerial views, Global Positioning System, weather balloons Satellite images Notes, automated data Automated data storage Chemical Testing Test kits Computer/ Calculators Mathematical analysis and graphics, statistics, simulations Mathematical analysis and graphics, statistics Large database, multiple sensors

What is the ultimate source of energy for most life on Earth?

What is this ? Decomposers bacteria & fungus

Food Chains show energy moves through the ecosystem. What are the trophic levels in a food chain. and what are some terms that describe them.

Decomposers bacteria & fungus heterotroph autotroph omnivore carnivore herbivore decomposer

Food Chains show energy moves through the ecosystem. Producer Primary heat Make 100%of Consumer food heat 10% 100 lbs. Secondary Consumer heat 10% 1% Decomposer heat . 1% 10 lbs. . 1 lbs. green plant herbivore carnivore decomposer Autotroph Heterotroph Eats something else

Compare & contrast food chain & food web.

Ecological Pyramids What can be shown with pyramids? Section 3 -2 Energy Pyramid Shows the relative amount of energy available at each trophic level. Organisms use about 10 percent of this energy for life processes. The rest is lost as heat. Biomass Pyramid Represents the amount of living organic matter at each trophic level. Typically, the greatest biomass is at the base of the pyramid. Go to Section: Pyramid of Numbers Shows the relative number of individual organisms at each trophic level.

Matter is not created or destroyed it is cycled through living and non-living parts of the environment. List 5 examples of Matter that cycles. (Hint- think elements. )
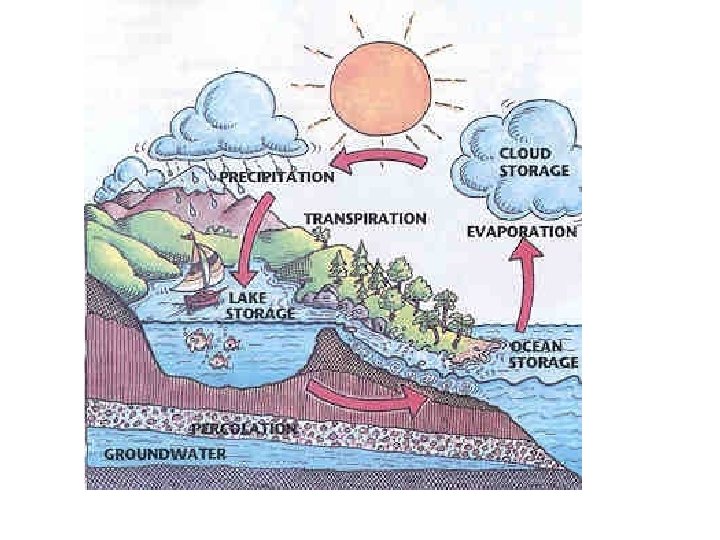

Water Cycle
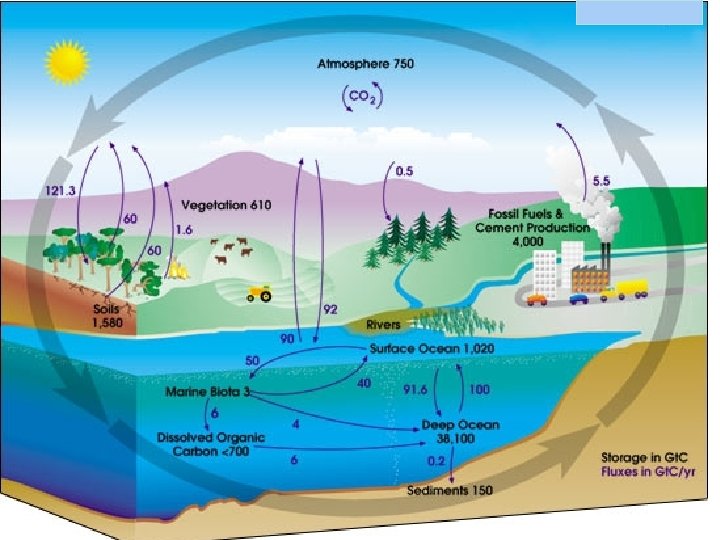

Carbon Cycle
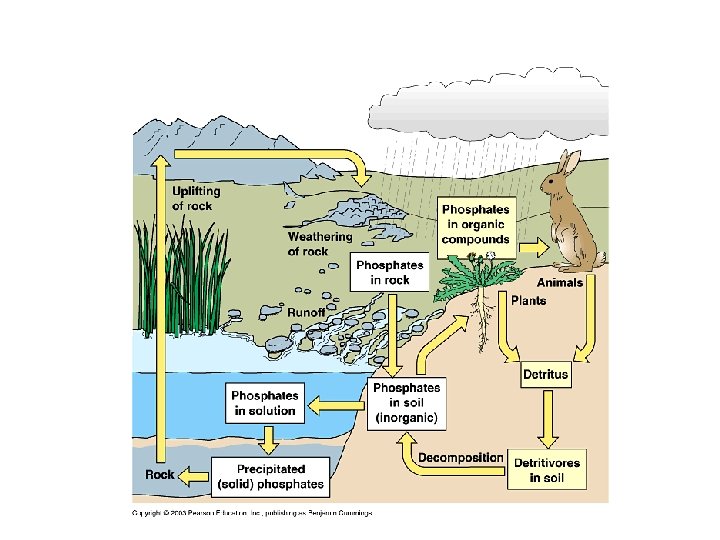

Phosphate Cycle
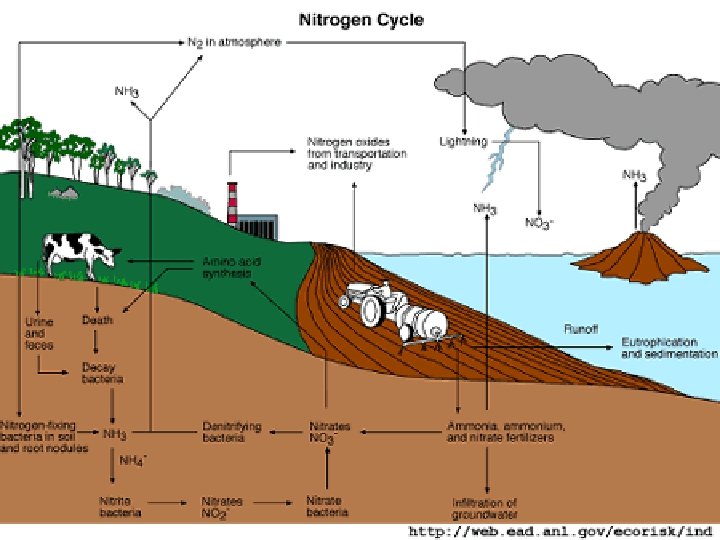

carbon + water + nitrogen + phosphate =

carbon C + water + nitrogen + phosphate = HO N CHONP and sometimes S P

carbon + water + nitrogen + phosphate = C HO N P CHO - carbohydrates and lipids CHON - proteins CHONP – nucleic acids CHONPS- some of protein’s amino acids require sulfur

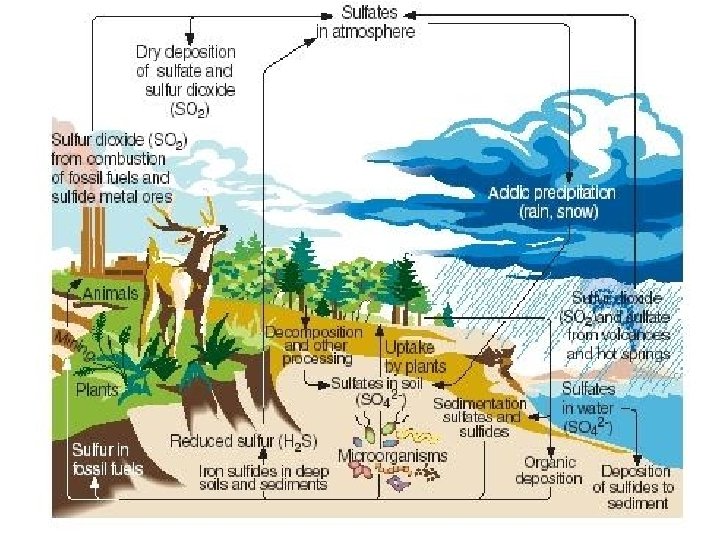
Sulfur Cycle Some amino acids also require sulfur

Limiting factors can prevent or limit growth. Why was your bean not growing when you first got it? (what was the limiting factor)

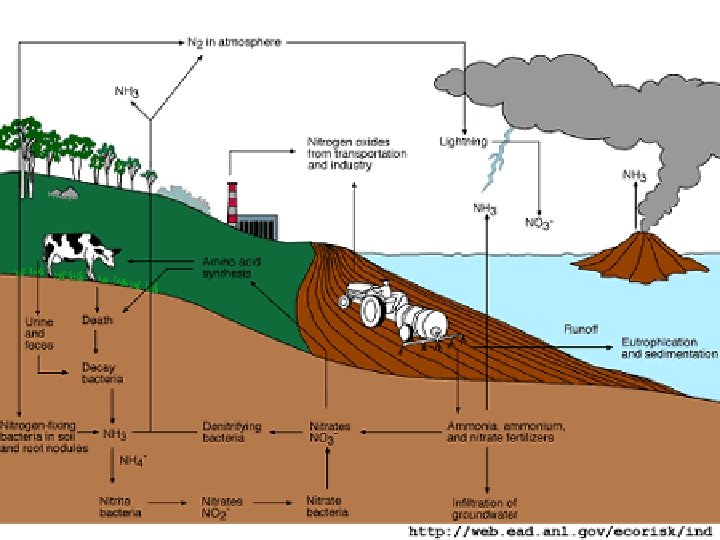
normal growth nitrogen deficiency Why does limiting nitrogen cause so many problems?

Nutrients provide material for growth and living. Anytime there is not enough of a required nutrient growth and life is limited.

The more productive the ecosystem the more standing biomass. What is the most productive ecosystems?

Pollution can be chemicals, nutrients, conditions, or structures that are harmful. Its amazing just how large a problem this can be!

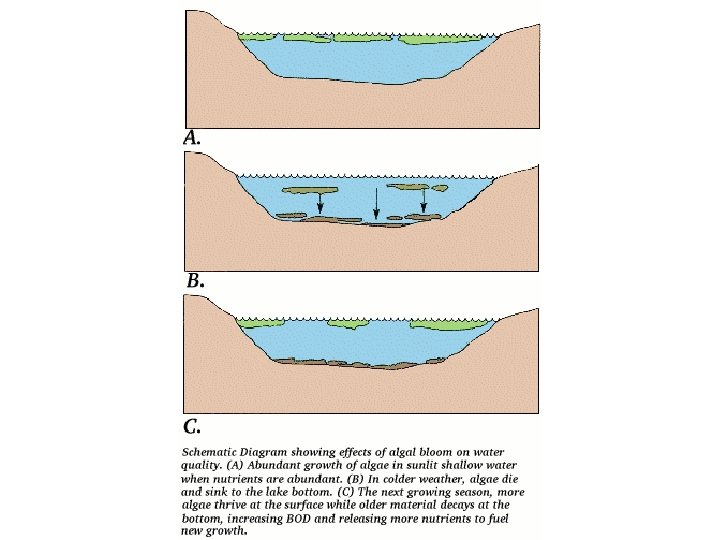
Eutrophication is the gradual filling in of bodies of water through the build up of sediment. How would an algae bloom affect this?

How can eutrophication be sped up by human activities?

If there are lots of plants why would other organisms die?

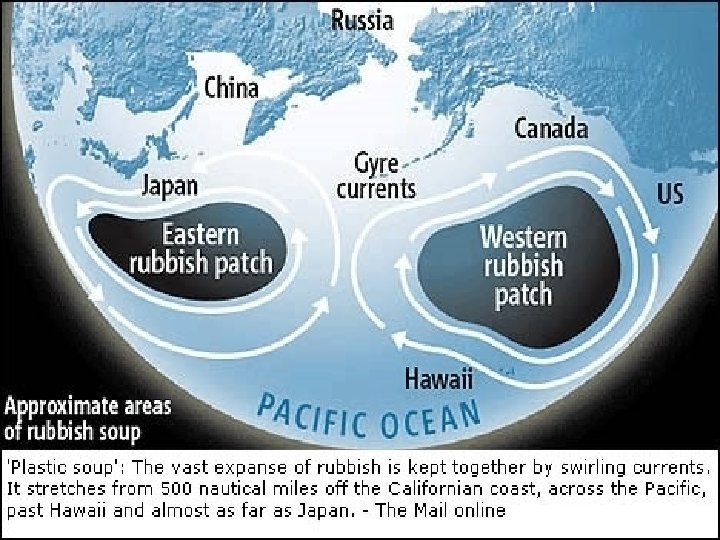

How can you help.

Reduce, Reuse, Recycle Use Less Heat and Air Conditioning Change a Light Bulb Buy Energy-Efficient Products Plant a Tree Use the "Off" Switch Get a Report Card from Your Utility Company Use Less Hot Water Drive Less and Drive Smart Use less harmful substances. Encourage Others to Conserve

Some things like mercury are bioaccumulative. It becomes more concentrated as you go up the food chain. How can you reduce this problem?
- Slides: 55