Surface nitrogen dioxide concentrations inferred from Ozone Monitoring


- Slides: 15
Surface nitrogen dioxide concentrations inferred from Ozone Monitoring Instrument (OMI) Lok Lamsal and Randall Martin James Gleason Department of Physics and Atmospheric Goddard Space Flight Center Science, Dalhousie University NASA 12. 04. 2007 3 rd GEOS-Chem USERS` MEETING, Harvard University 1
Motivation u Surface NO 2 is a toxic pollutant that affects human health u Association between surface NO 2 and non-accidental mortality (Burnett et al. , 2004; Brook et al. , 2007) u Association stronger than for PM 2. 5 u Limited number of sites u Global map of surface NO 2 not possible without satellite measurements Surface measurement sites in US and Canada 2
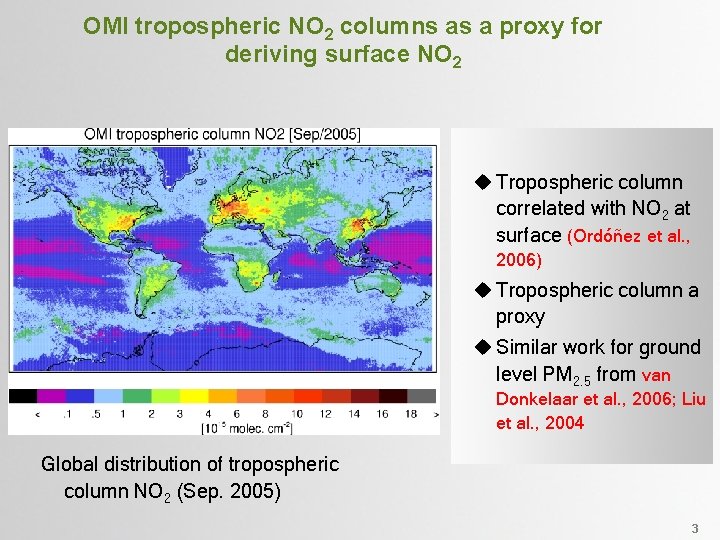
OMI tropospheric NO 2 columns as a proxy for deriving surface NO 2 u Tropospheric column correlated with NO 2 at surface (Ordóñez et al. , 2006) u Tropospheric column a proxy u Similar work for ground level PM 2. 5 from van Donkelaar et al. , 2006; Liu et al. , 2004 Global distribution of tropospheric column NO 2 (Sep. 2005) 3
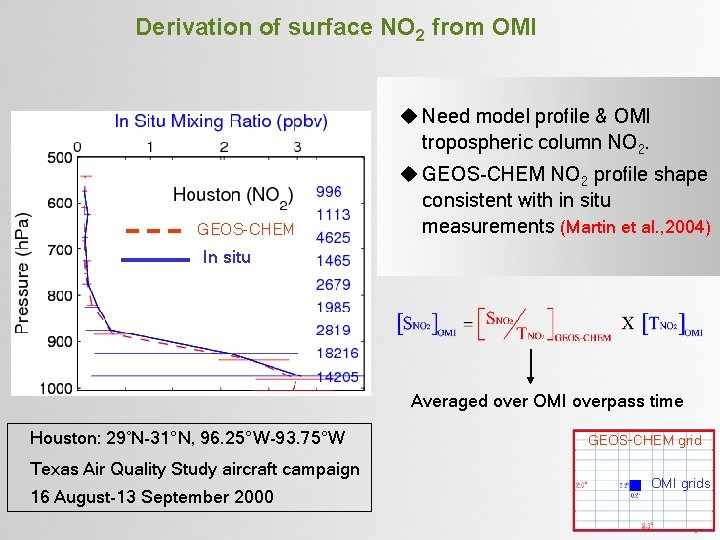
Derivation of surface NO 2 from OMI u Need model profile & OMI tropospheric column NO 2. GEOS-CHEM u GEOS-CHEM NO 2 profile shape consistent with in situ measurements (Martin et al. , 2004) In situ Averaged over OMI overpass time Houston: 29°N-31°N, 96. 25°W-93. 75°W Texas Air Quality Study aircraft campaign 16 August-13 September 2000 GEOS-CHEM grid OMI grids 4
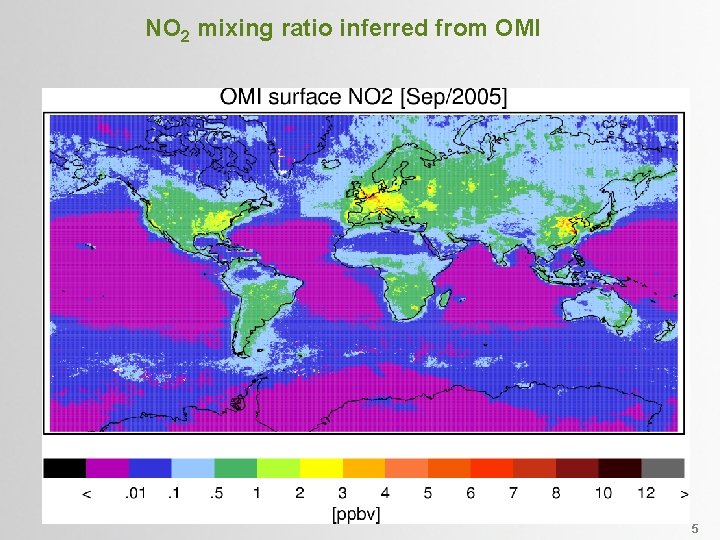
NO 2 mixing ratio inferred from OMI 5
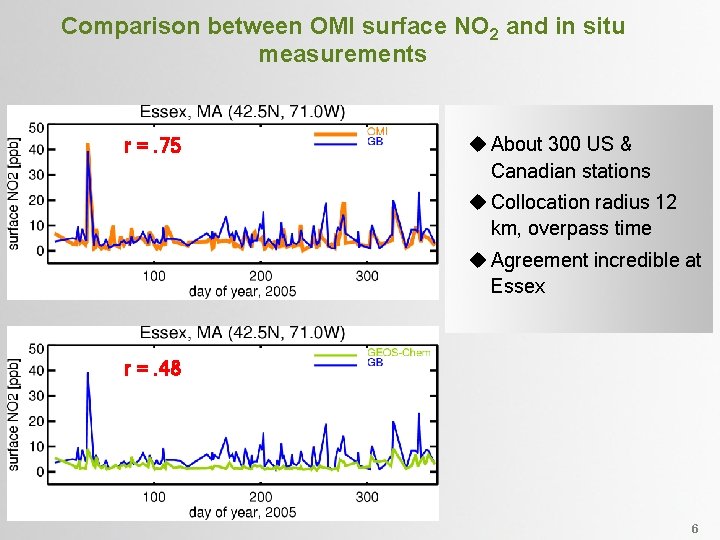
Comparison between OMI surface NO 2 and in situ measurements r =. 75 u About 300 US & Canadian stations u Collocation radius 12 km, overpass time u Agreement incredible at Essex r =. 48 6
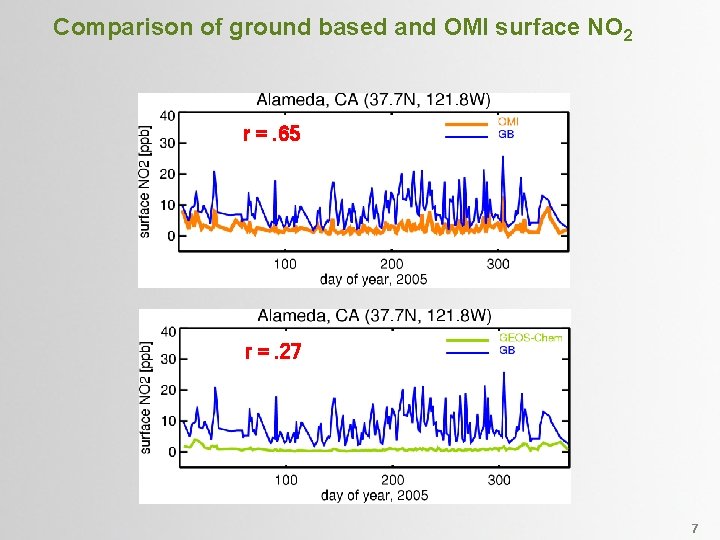
Comparison of ground based and OMI surface NO 2 r =. 65 r =. 27 7
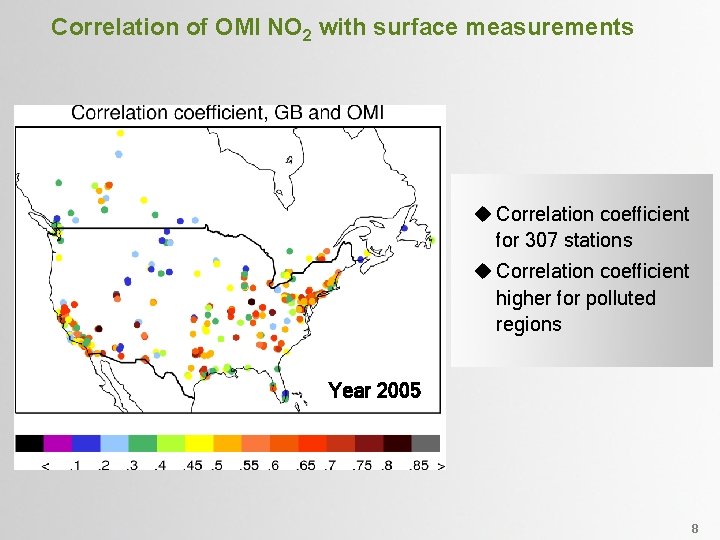
Correlation of OMI NO 2 with surface measurements u Correlation coefficient for 307 stations u Correlation coefficient higher for polluted regions Year 2005 8
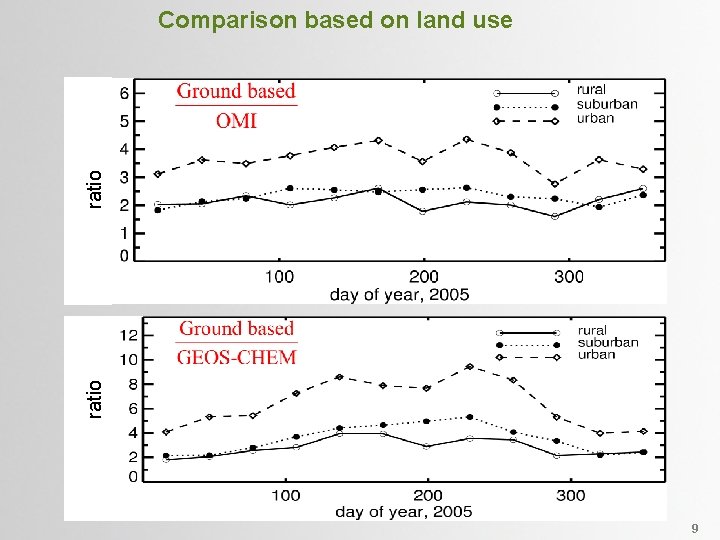
ratio Comparison based on land use 9
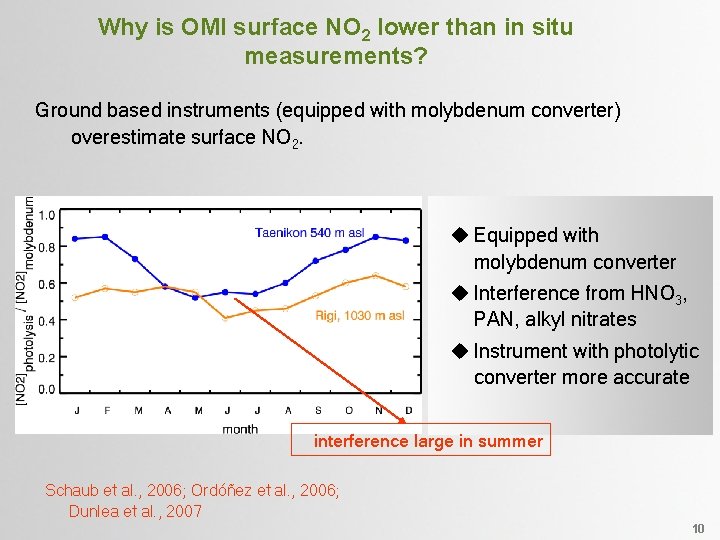
Why is OMI surface NO 2 lower than in situ measurements? Ground based instruments (equipped with molybdenum converter) overestimate surface NO 2. u Equipped with molybdenum converter u Interference from HNO 3, PAN, alkyl nitrates u Instrument with photolytic converter more accurate interference large in summer Schaub et al. , 2006; Ordóñez et al. , 2006; Dunlea et al. , 2007 10
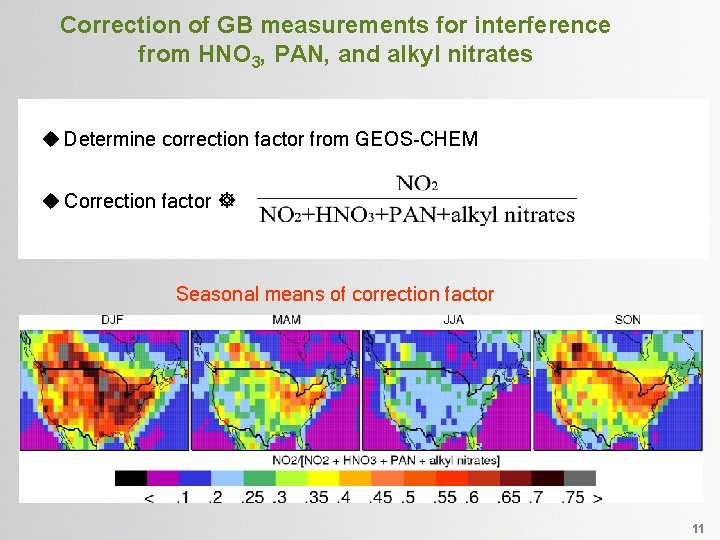
Correction of GB measurements for interference from HNO 3, PAN, and alkyl nitrates u Determine correction factor from GEOS-CHEM u Correction factor Seasonal means of correction factor 11
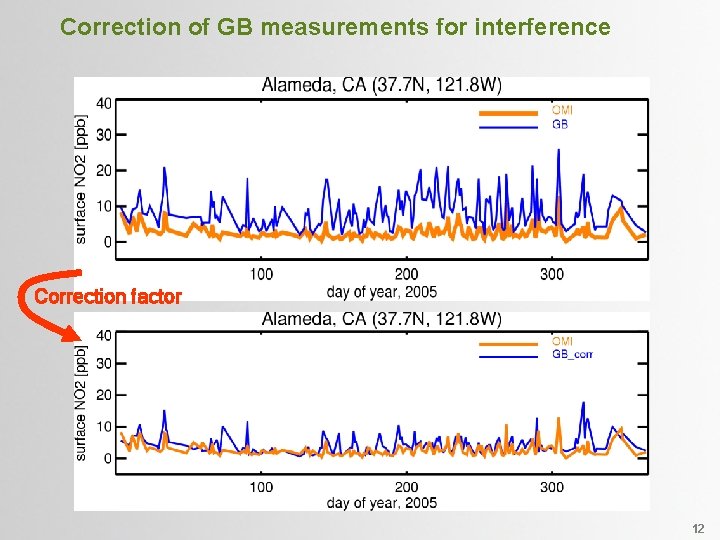
Correction of GB measurements for interference Correction factor 12
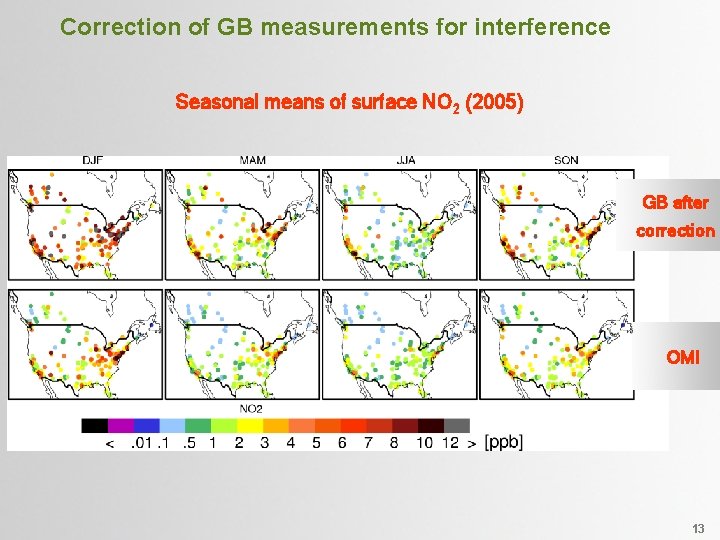
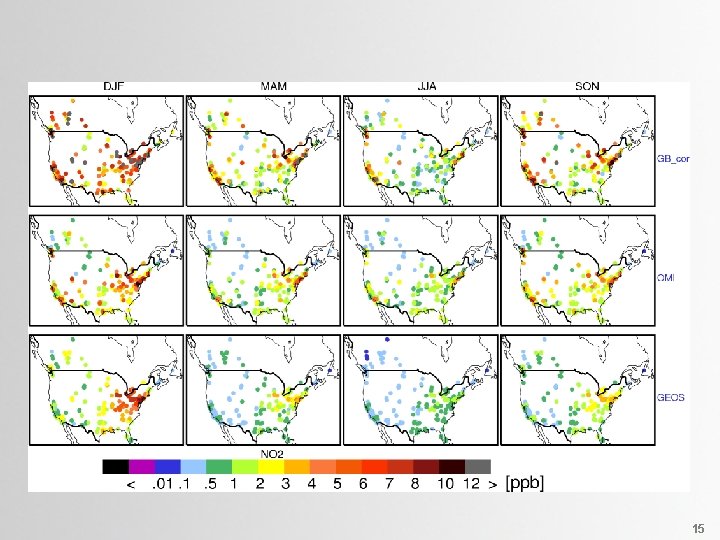
Correction of GB measurements for interference Seasonal means of surface NO 2 (2005) GB after correction OMI 13
14
15