Meteorology I Weather The state or condition of




- Slides: 104
Meteorology
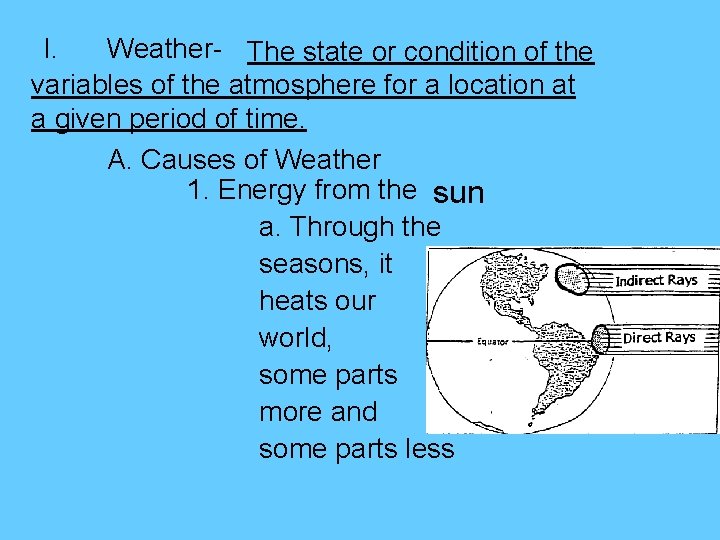
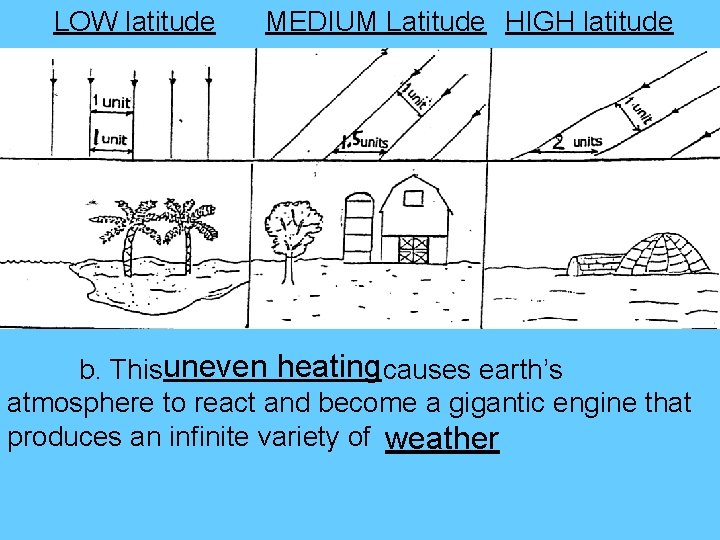
I. Weather- The state or condition of the variables of the atmosphere for a location at a given period of time. A. Causes of Weather 1. Energy from the sun a. Through the seasons, it heats our world, some parts more and some parts less
LOW latitude MEDIUM Latitude HIGH latitude b. Thisuneven heating causes earth’s atmosphere to react and become a gigantic engine that produces an infinite variety of weather
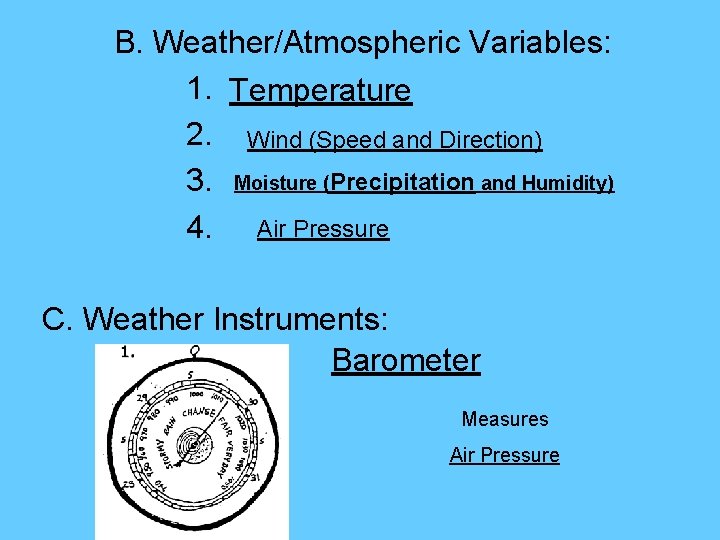
B. Weather/Atmospheric Variables: 1. Temperature 2. Wind (Speed and Direction) 3. Moisture (Precipitation and Humidity) 4. Air Pressure C. Weather Instruments: Barometer Measures Air Pressure
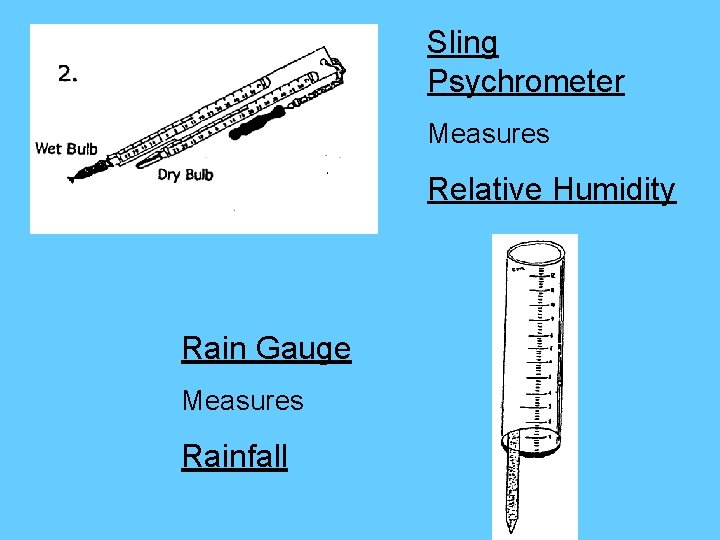
Sling Psychrometer Measures Relative Humidity Rain Gauge Measures Rainfall
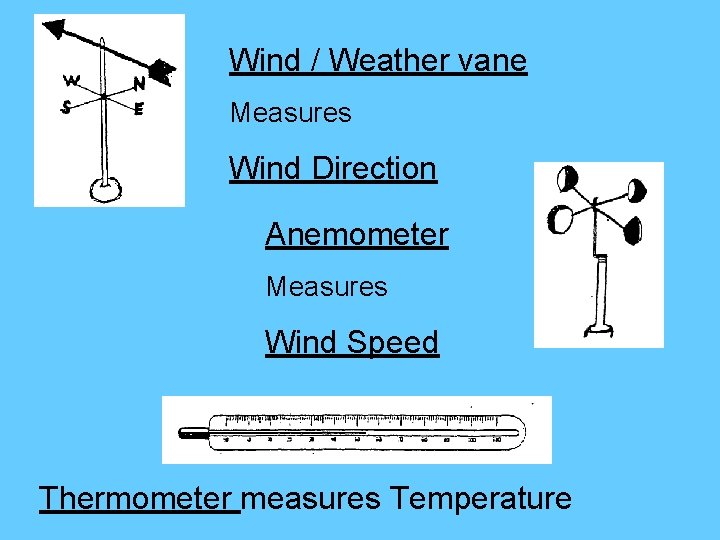
Wind / Weather vane Measures Wind Direction Anemometer Measures Wind Speed Thermometer measures Temperature
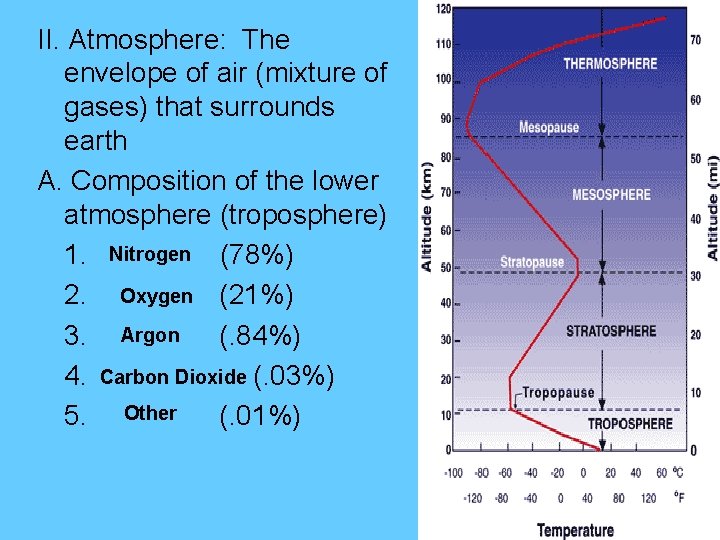
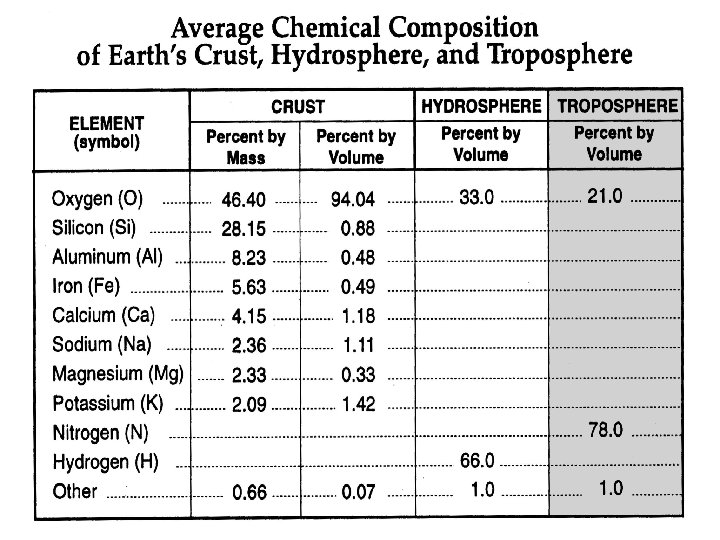
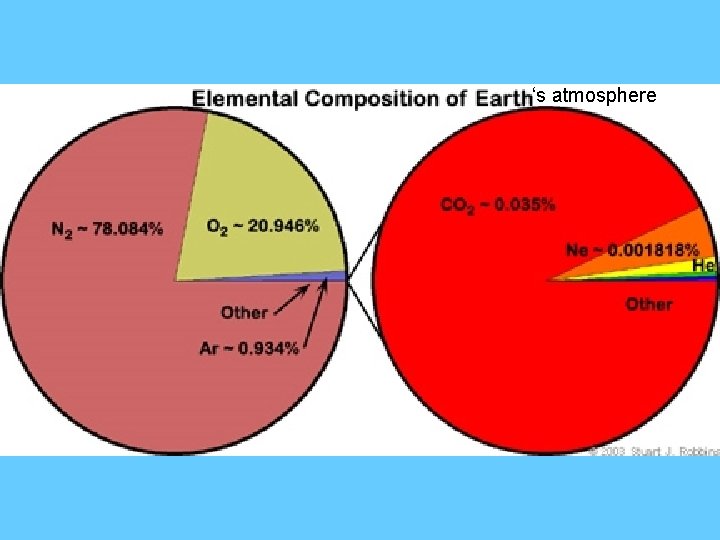
II. Atmosphere: The envelope of air (mixture of gases) that surrounds earth A. Composition of the lower atmosphere (troposphere) 1. Nitrogen (78%) 2. Oxygen (21%) 3. Argon (. 84%) 4. Carbon Dioxide (. 03%) 5. Other (. 01%)
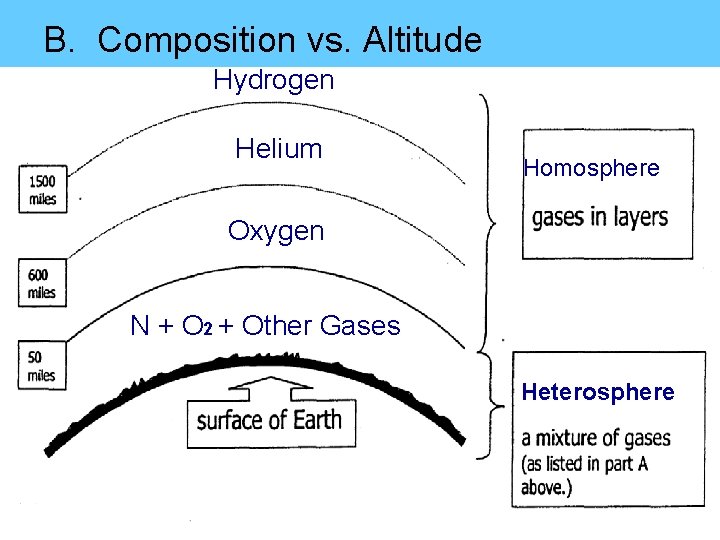
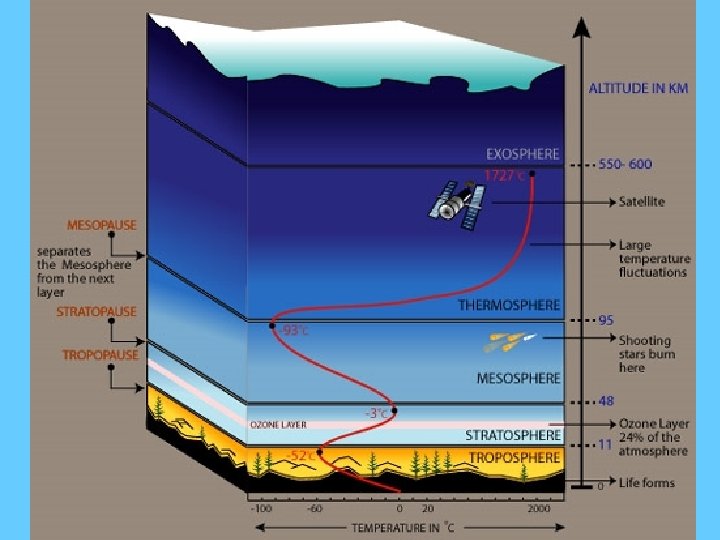
B. Composition vs. Altitude Hydrogen Helium Homosphere Oxygen N + O 2 + Other Gases Heterosphere
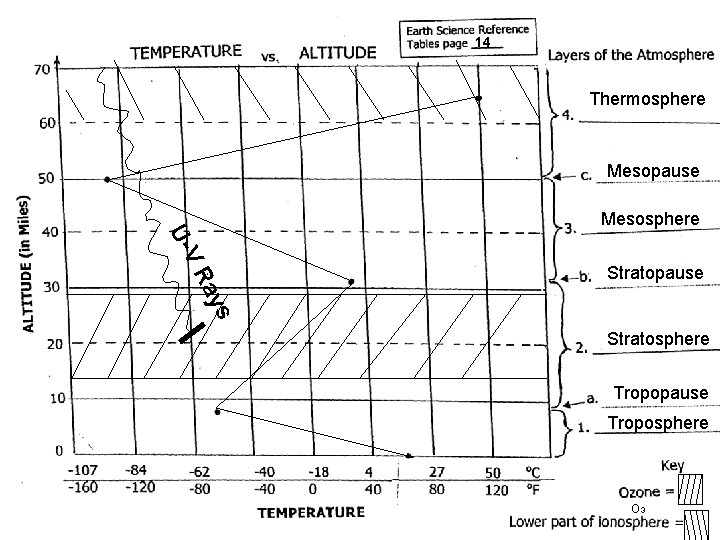
14 Thermosphere Mesopause Mesosphere s ay VR U- Stratopause Stratosphere Tropopause Troposphere O 3
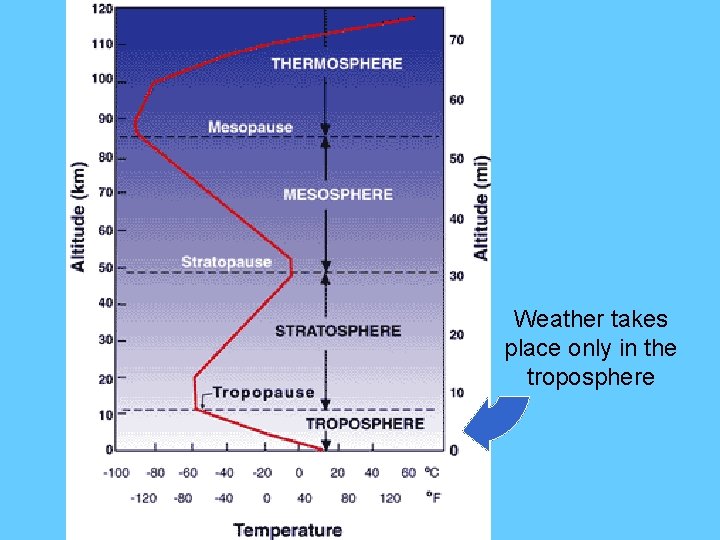
Weather takes place only in the troposphere
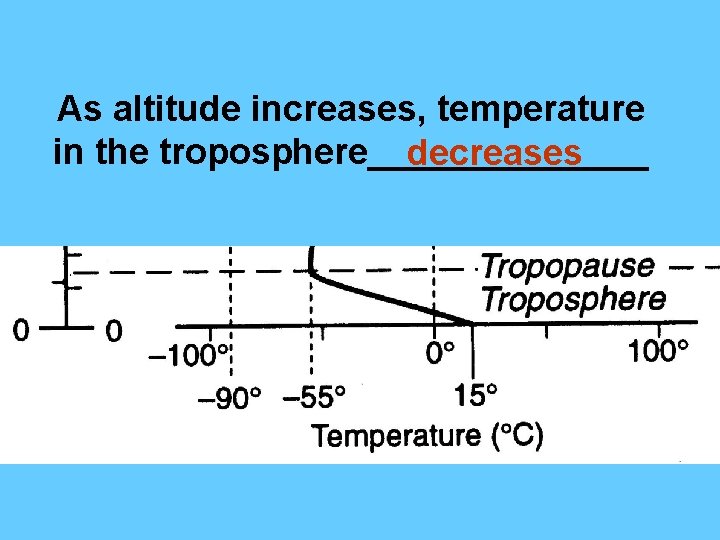
As altitude increases, temperature in the troposphere_______ decreases
‘s atmosphere
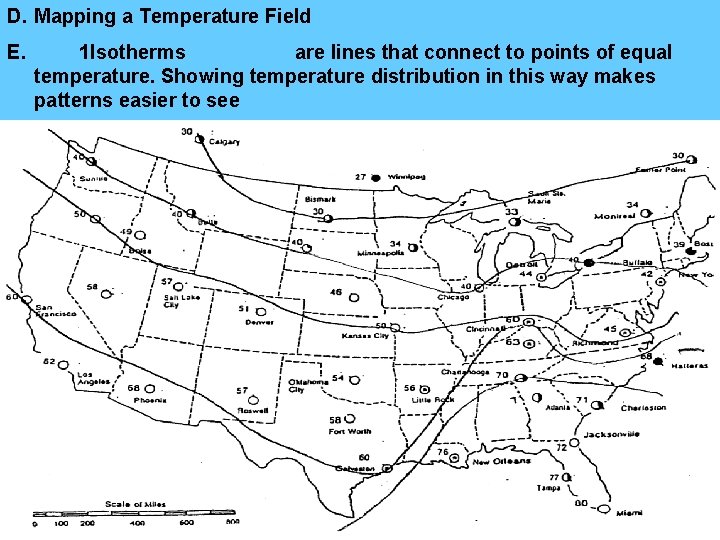
D. Mapping a Temperature Field E. 1. Isotherms are lines that connect to points of equal temperature. Showing temperature distribution in this way makes patterns easier to see
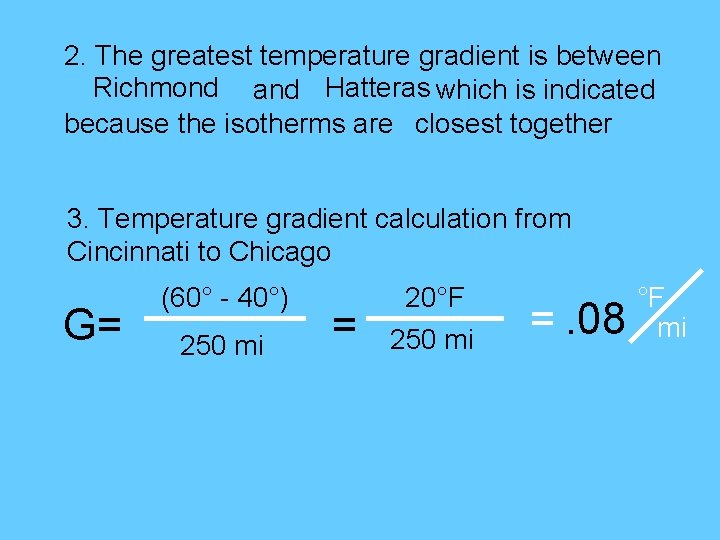
2. The greatest temperature gradient is between Richmond and Hatteras which is indicated because the isotherms are closest together 3. Temperature gradient calculation from Cincinnati to Chicago G= (60° - 40°) 250 mi = 20°F 250 mi =. 08 °F mi
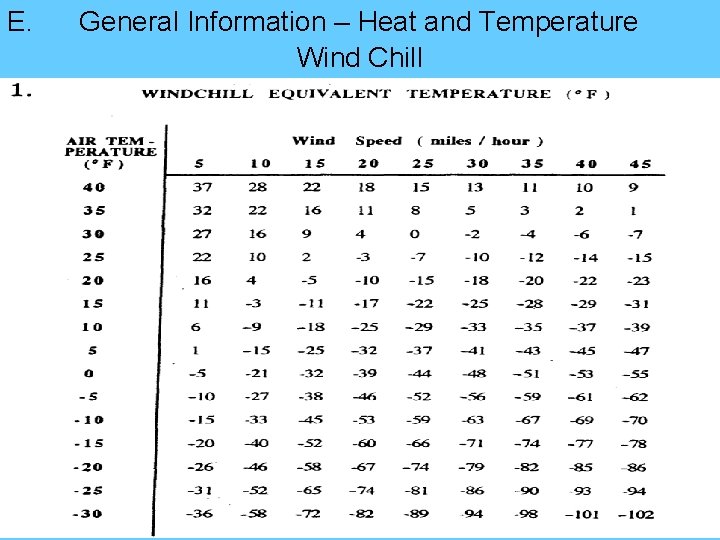
E. General Information – Heat and Temperature Wind Chill
2. Heat affects body- when your body is overheated the additional stress can cause medical problems. A. Your body’s thermostat, the determines that your body is too warm. B. increases in an effort to carry heat from deep inside the body to the surface of the skin. C. If lost by sweating is not replaced, dehydration and heat exhaustion can result. D. High humidity can interfere with the that carries away large amounts of heat.
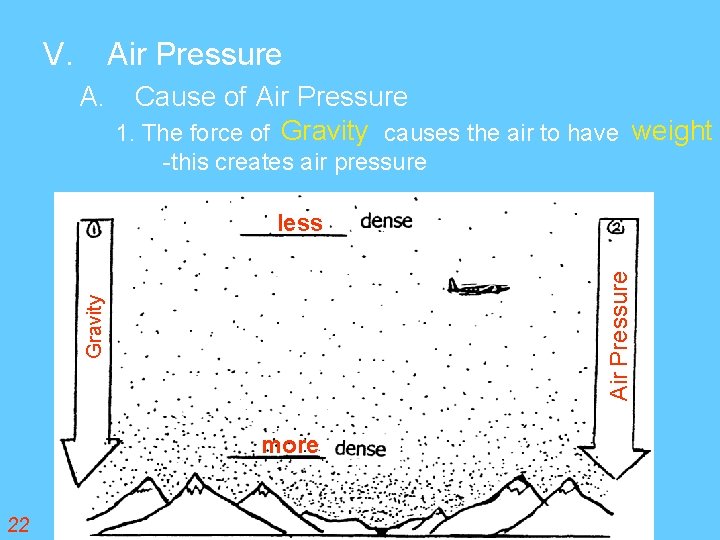
V. Air Pressure A. Cause of Air Pressure 1. The force of Gravity causes the air to have weight -this creates air pressure Gravity Air Pressure less more 22
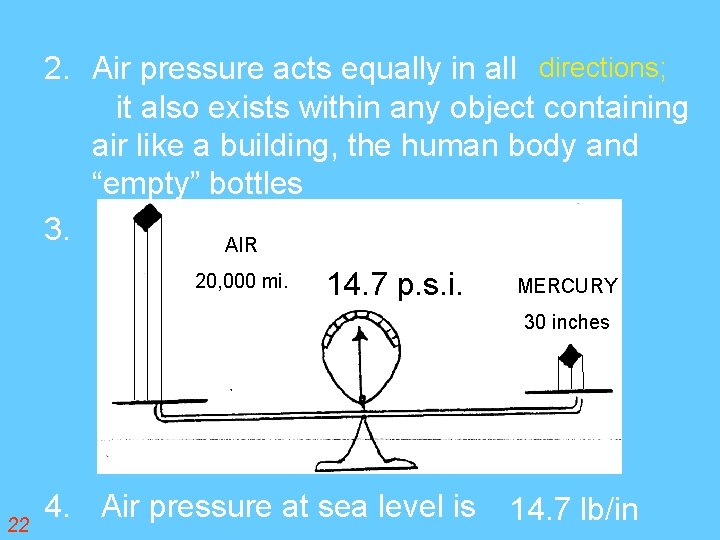
2. Air pressure acts equally in all directions; it also exists within any object containing air like a building, the human body and “empty” bottles 3. AIR 20, 000 mi. 14. 7 p. s. i. MERCURY 30 inches 22 4. Air pressure at sea level is 14. 7 lb/in
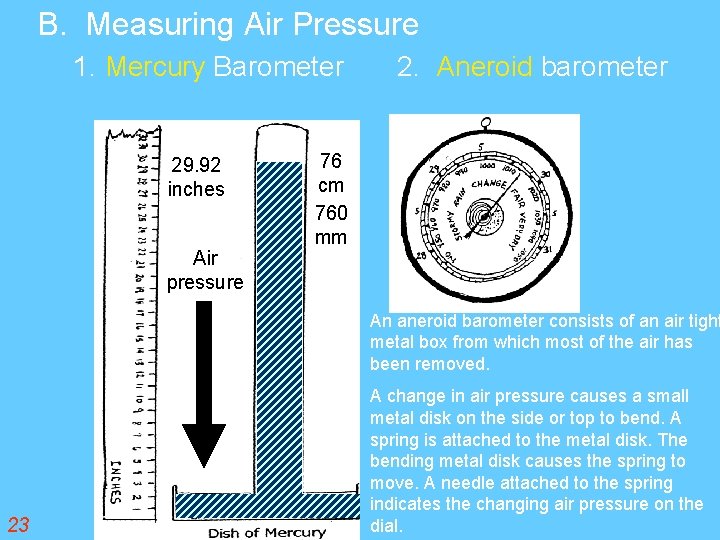
B. Measuring Air Pressure 1. Mercury Barometer 29. 92 inches Air pressure 2. Aneroid barometer 76 cm 760 mm An aneroid barometer consists of an air tight metal box from which most of the air has been removed. 23 A change in air pressure causes a small metal disk on the side or top to bend. A spring is attached to the metal disk. The bending metal disk causes the spring to move. A needle attached to the spring indicates the changing air pressure on the dial.
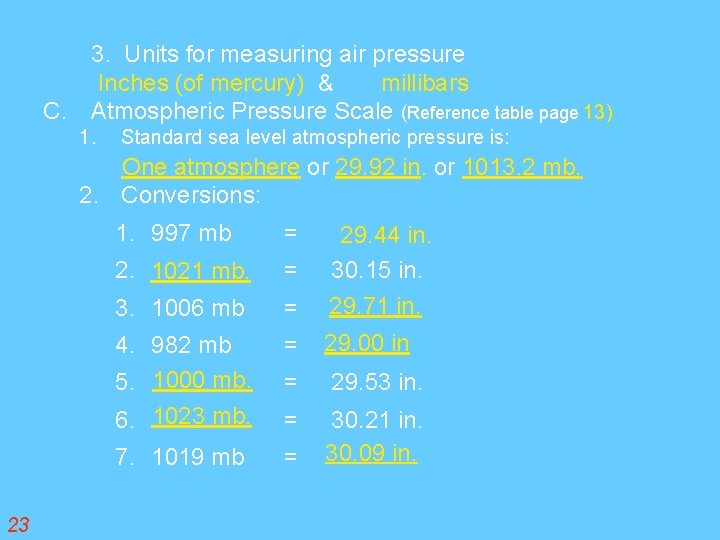
3. Units for measuring air pressure Inches (of mercury) & millibars C. Atmospheric Pressure Scale (Reference table page 13) 1. Standard sea level atmospheric pressure is: One atmosphere or 29. 92 in. or 1013. 2 mb. 2. Conversions: 23 1. 997 mb = 2. 1021 mb. = 29. 44 in. 30. 15 in. 3. 1006 mb = 29. 71 in. 4. 982 mb 5. 1000 mb. 6. 1023 mb. = 29. 00 in = 29. 53 in. = 7. 1019 mb = 30. 21 in. 30. 09 in.
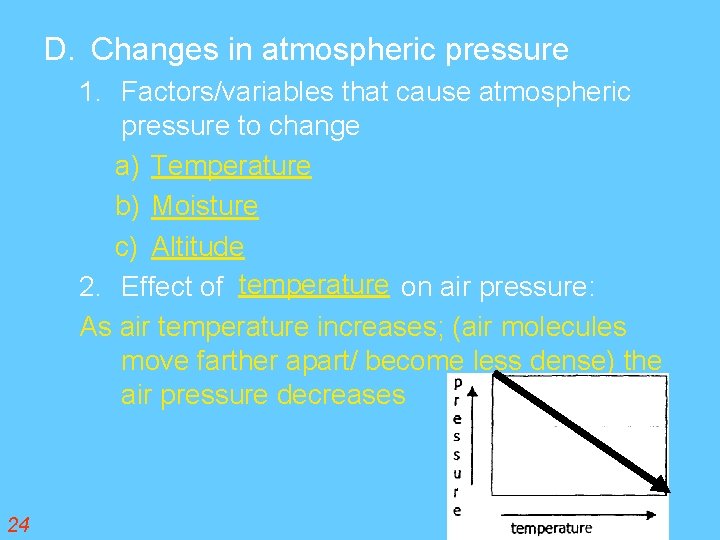
D. Changes in atmospheric pressure 1. Factors/variables that cause atmospheric pressure to change a) Temperature b) Moisture c) Altitude 2. Effect of temperature on air pressure: As air temperature increases; (air molecules move farther apart/ become less dense) the air pressure decreases 24
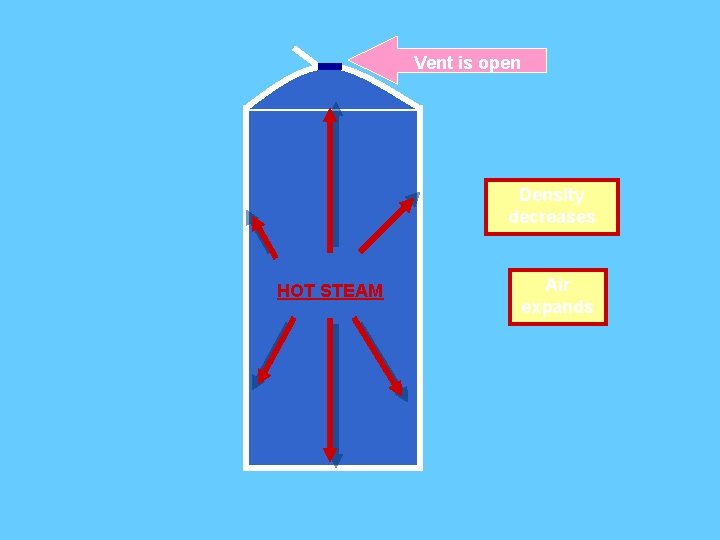
Vent is open Density decreases HOT STEAM Air expands
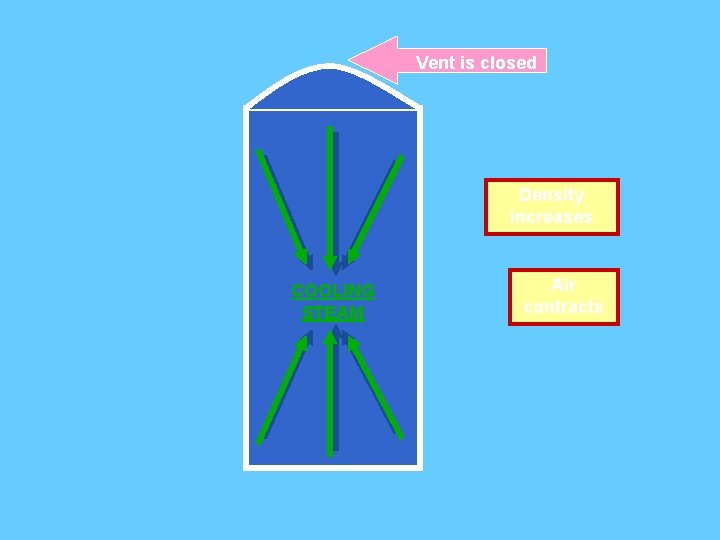
Vent is closed Density increases COOLING STEAM Air contracts
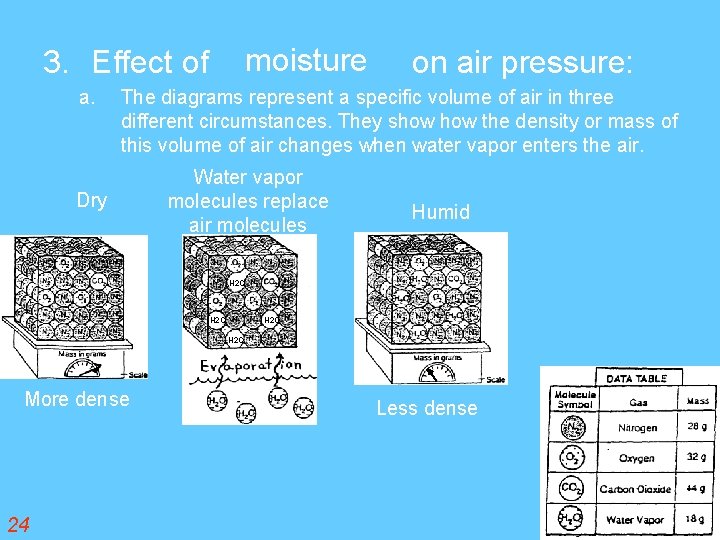
moisture 3. Effect of a. on air pressure: The diagrams represent a specific volume of air in three different circumstances. They show the density or mass of this volume of air changes when water vapor enters the air. Dry Water vapor molecules replace air molecules Humid H 2 O More dense 24 Less dense
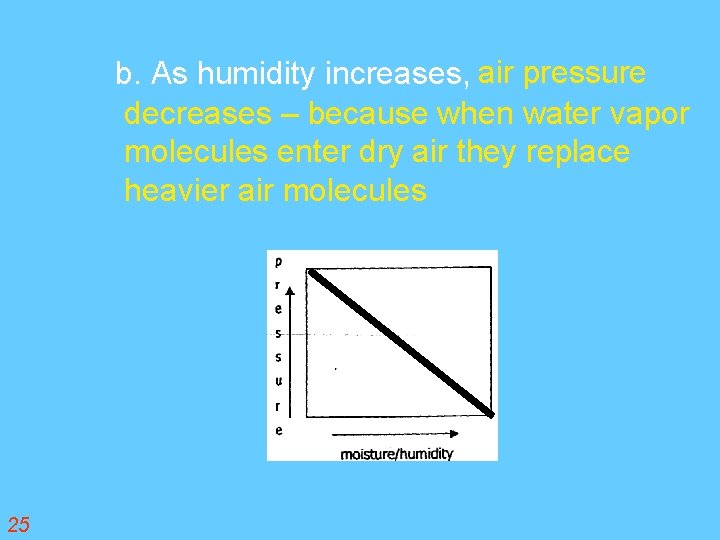
b. As humidity increases, air pressure decreases – because when water vapor molecules enter dry air they replace heavier air molecules 25
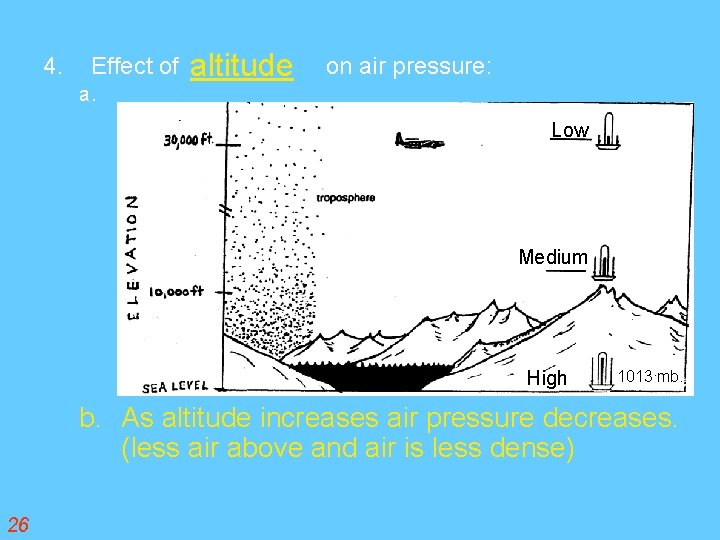
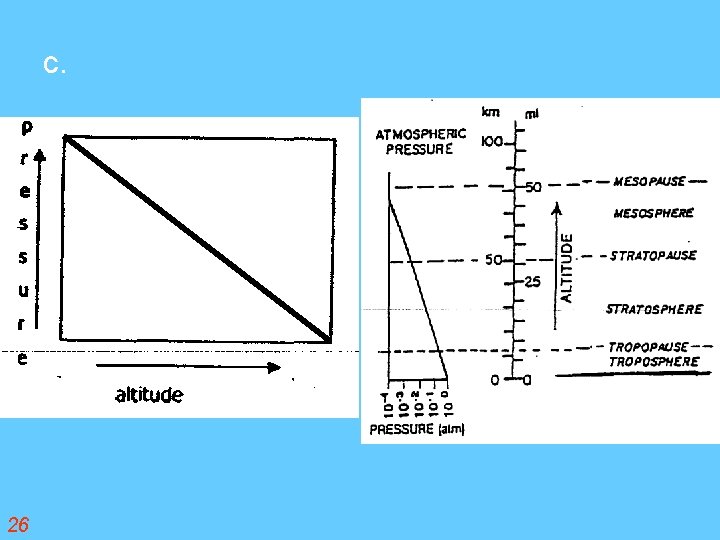
4. Effect of a. altitude on air pressure: Low Medium High 1013 mb. b. As altitude increases air pressure decreases. (less air above and air is less dense) 26
c. 26
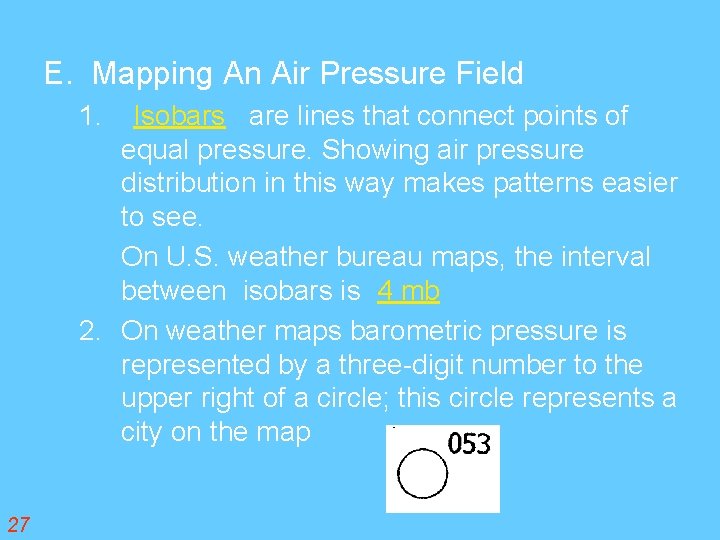
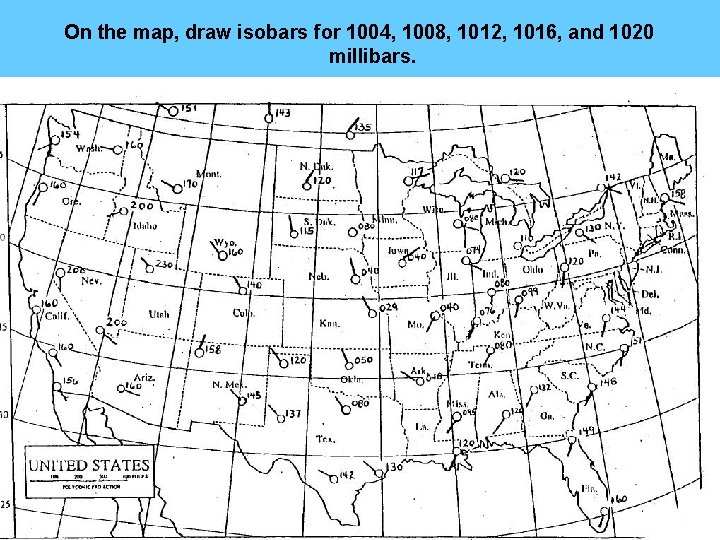
E. Mapping An Air Pressure Field Isobars are lines that connect points of equal pressure. Showing air pressure distribution in this way makes patterns easier to see. On U. S. weather bureau maps, the interval between isobars is 4 mb 2. On weather maps barometric pressure is represented by a three-digit number to the upper right of a circle; this circle represents a city on the map 1. 27
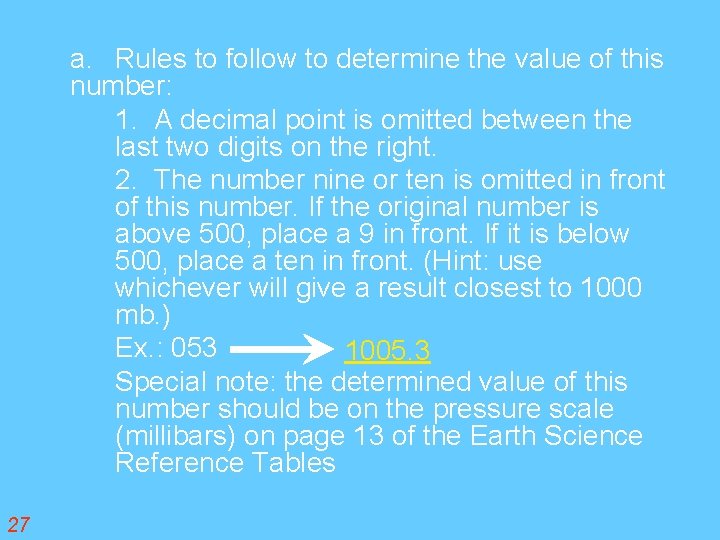
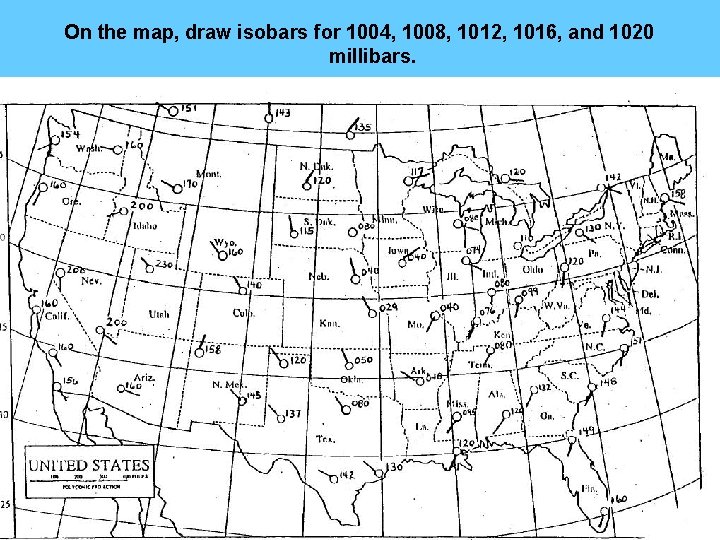
a. Rules to follow to determine the value of this number: 1. A decimal point is omitted between the last two digits on the right. 2. The number nine or ten is omitted in front of this number. If the original number is above 500, place a 9 in front. If it is below 500, place a ten in front. (Hint: use whichever will give a result closest to 1000 mb. ) Ex. : 053 1005. 3 Special note: the determined value of this number should be on the pressure scale (millibars) on page 13 of the Earth Science Reference Tables 27
On the map, draw isobars for 1004, 1008, 1012, 1016, and 1020 millibars.
VI. Wind- The horizontal movement of air parallel to the earths surface A. Causes of winds 1. Uneven heating of the earths surface 2. Examples: a. Land vs. water b. Poles vs. equator c. Dark forest vs. snowfield 3. Winds help to distribute energy from areas of surplus to areas of energy deficit. 29
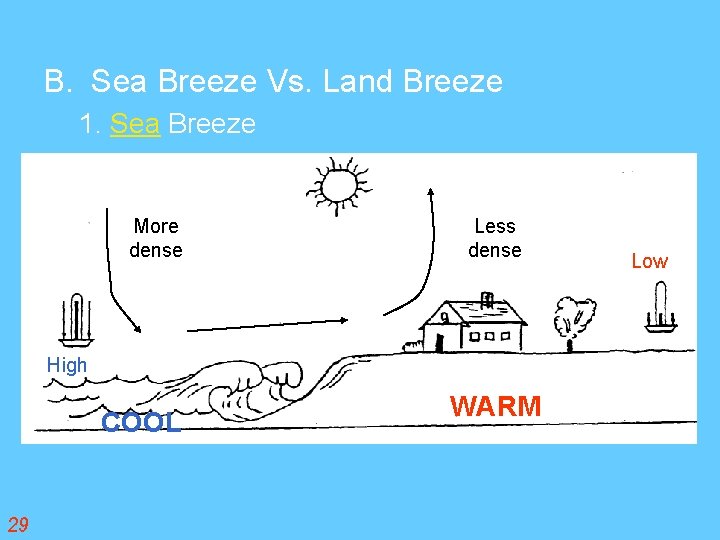
B. Sea Breeze Vs. Land Breeze 1. Sea Breeze More dense Less dense High COOL 29 WARM Low
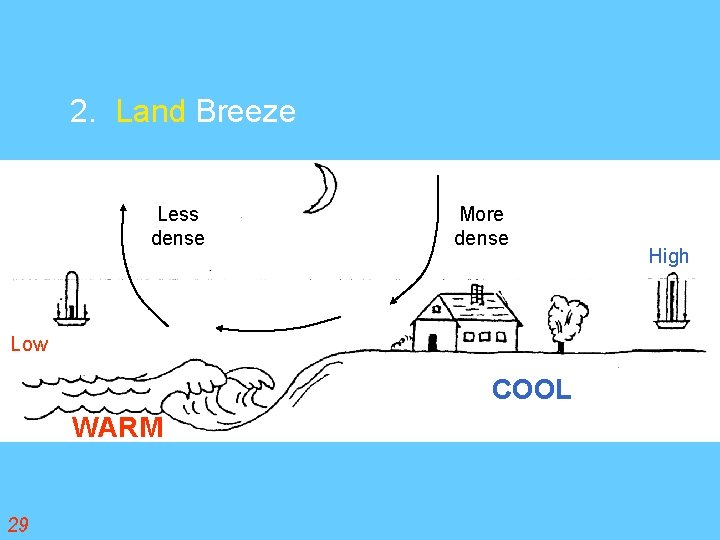
2. Land Breeze Less dense More dense Low COOL WARM 29 High
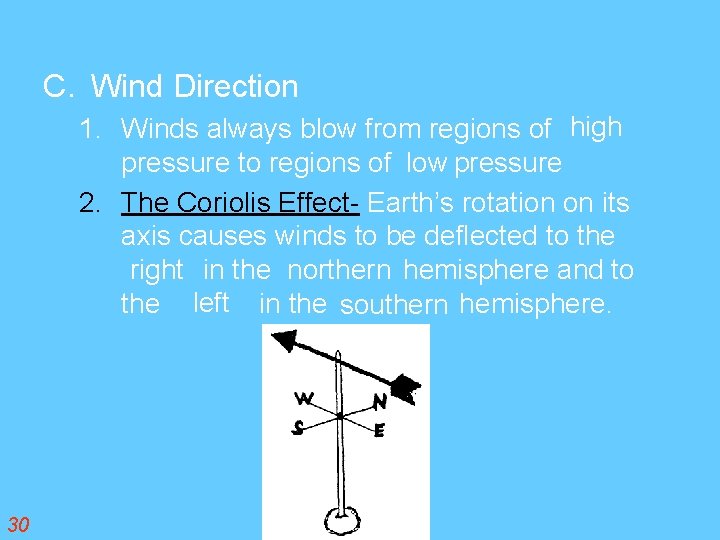
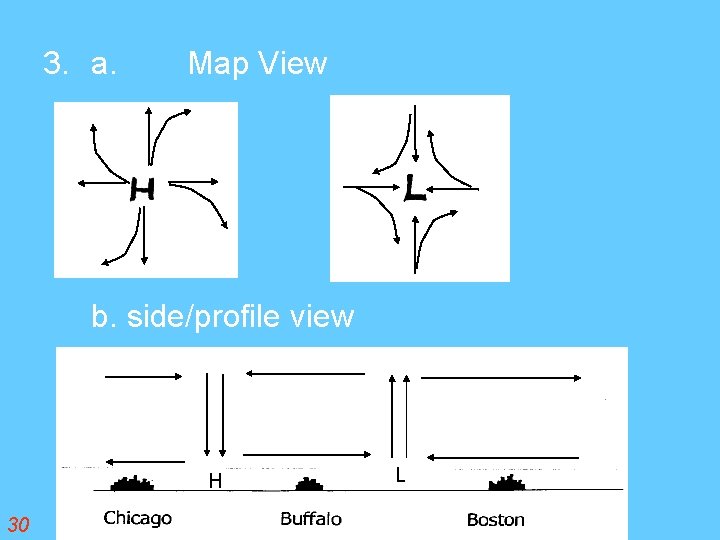
C. Wind Direction 1. Winds always blow from regions of high pressure to regions of low pressure 2. The Coriolis Effect- Earth’s rotation on its axis causes winds to be deflected to the right in the northern hemisphere and to the left in the southern hemisphere. 30
3. a. Map View b. side/profile view H 30 L
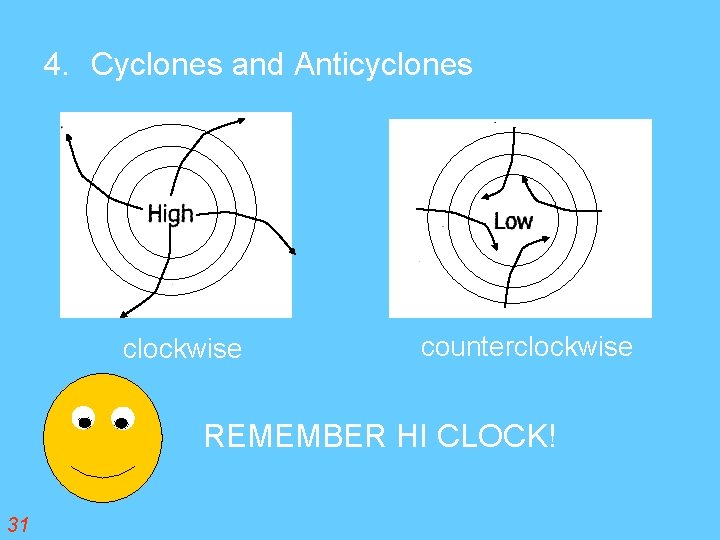
4. Cyclones and Anticyclones clockwise counterclockwise REMEMBER HI CLOCK! 31
a. Winds move in a clockwise outer spiral around a high pressure system b. Winds move in a counterclockwise inward spiral around a low pressure system Activity: On the map on page 28, a. for each station model extend the shaft of the wind arrow and draw the head of the arrow to show the “direction the wind is blowing” b. Draw larger arrows to show the general direction the wind is blowing 31
On the map, draw isobars for 1004, 1008, 1012, 1016, and 1020 millibars.
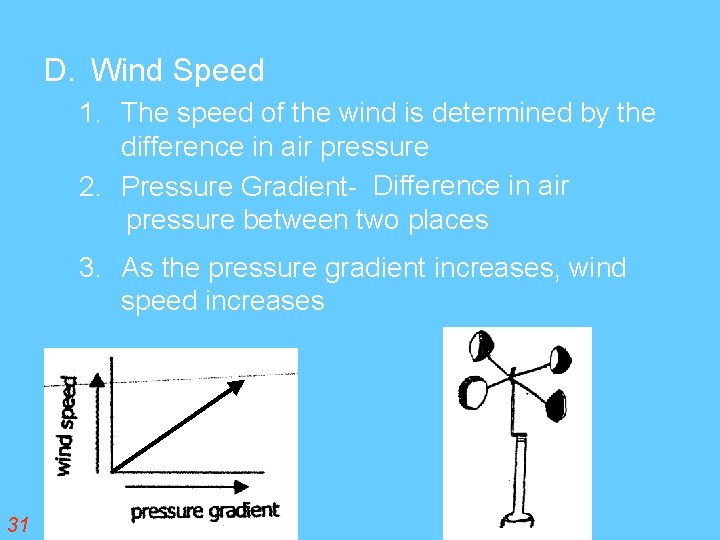
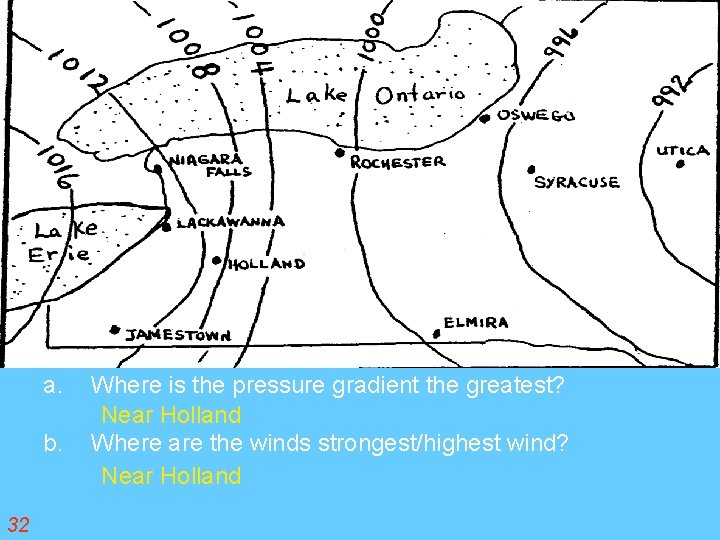
D. Wind Speed 1. The speed of the wind is determined by the difference in air pressure 2. Pressure Gradient- Difference in air pressure between two places 3. As the pressure gradient increases, wind speed increases 31
a. b. 32 Where is the pressure gradient the greatest? Near Holland Where are the winds strongest/highest wind? Near Holland
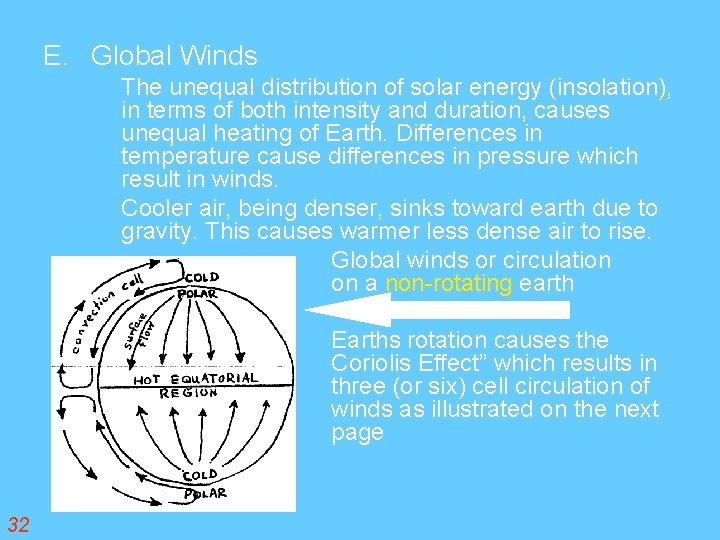
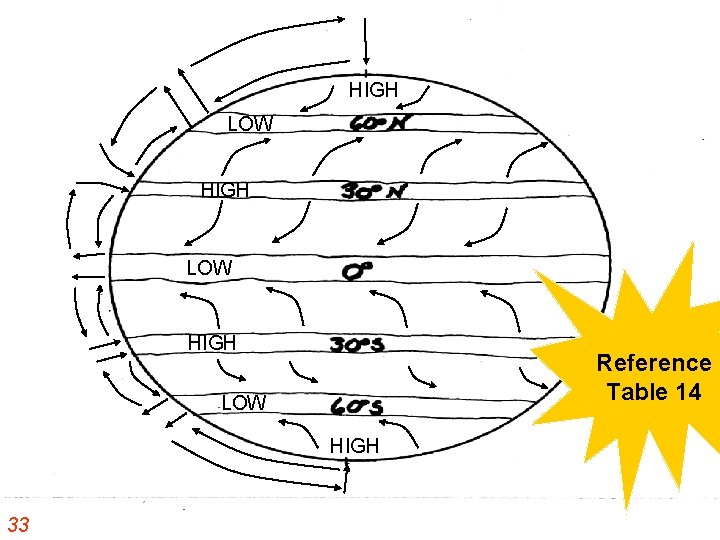
E. Global Winds The unequal distribution of solar energy (insolation), in terms of both intensity and duration, causes unequal heating of Earth. Differences in temperature cause differences in pressure which result in winds. Cooler air, being denser, sinks toward earth due to gravity. This causes warmer less dense air to rise. Global winds or circulation on a non-rotating earth Earths rotation causes the Coriolis Effect” which results in three (or six) cell circulation of winds as illustrated on the next page 32
HIGH LOW HIGH Reference Table 14 LOW HIGH 33
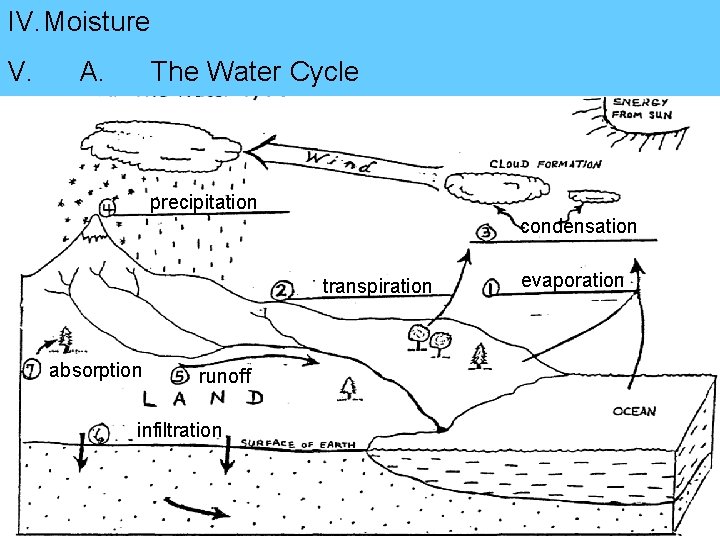
IV. Moisture V. A. The Water Cycle precipitation condensation transpiration absorption runoff infiltration evaporation
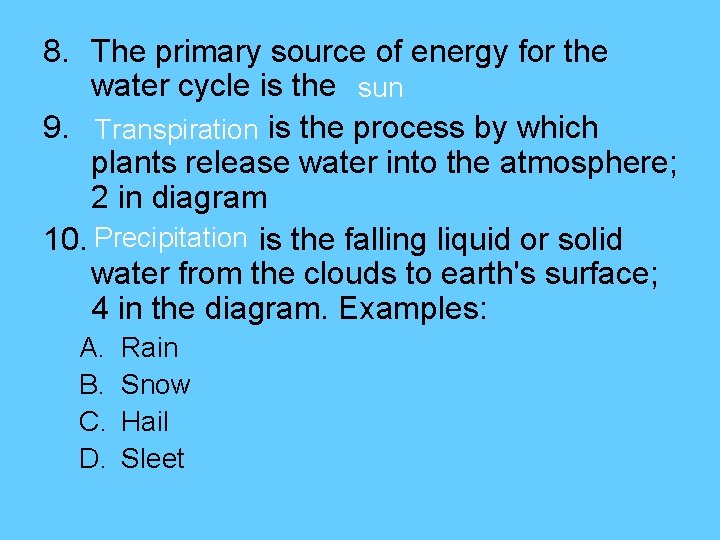
8. The primary source of energy for the water cycle is the sun 9. Transpiration is the process by which plants release water into the atmosphere; 2 in diagram 10. Precipitation is the falling liquid or solid water from the clouds to earth's surface; 4 in the diagram. Examples: A. B. C. D. Rain Snow Hail Sleet
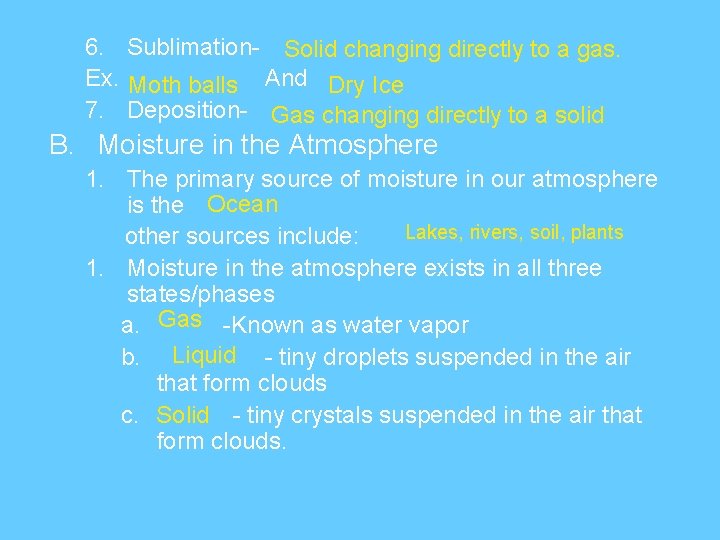
6. Sublimation- Solid changing directly to a gas. Ex. Moth balls And Dry Ice 7. Deposition- Gas changing directly to a solid B. Moisture in the Atmosphere 1. The primary source of moisture in our atmosphere is the Ocean Lakes, rivers, soil, plants other sources include: 1. Moisture in the atmosphere exists in all three states/phases a. Gas -Known as water vapor b. Liquid - tiny droplets suspended in the air that form clouds c. Solid - tiny crystals suspended in the air that form clouds.
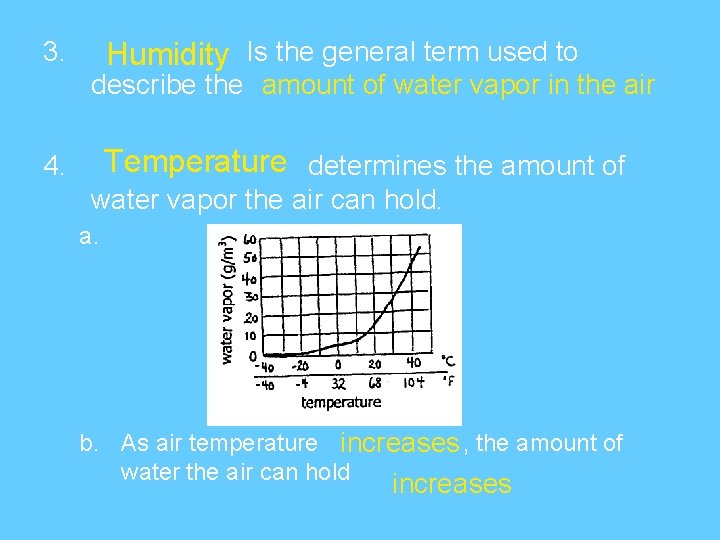
3. Humidity Is the general term used to describe the amount of water vapor in the air Temperature determines the amount of 4. water vapor the air can hold. a. b. As air temperature increases , the amount of water the air can hold increases
c. At 35°C, a cubic meter of air can hold 35 grams of water vapor. 5. Saturation- When air holds as much water as it can at a certain temperature 6. Saturation occurs when condensation = evaporation
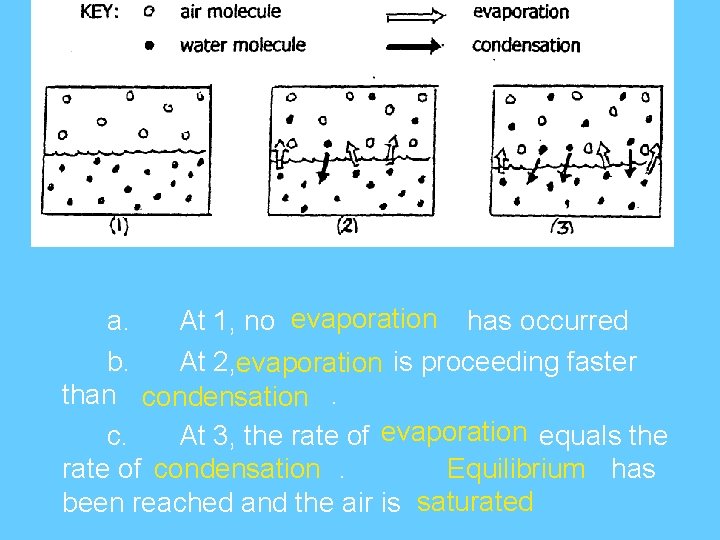
a. At 1, no evaporation has occurred b. At 2, evaporation is proceeding faster than condensation. c. At 3, the rate of evaporation equals the rate of condensation. Equilibrium has been reached and the air is saturated
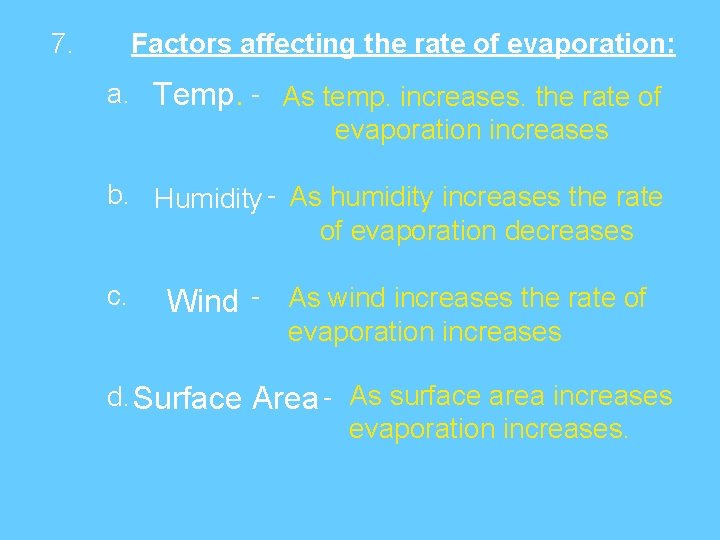
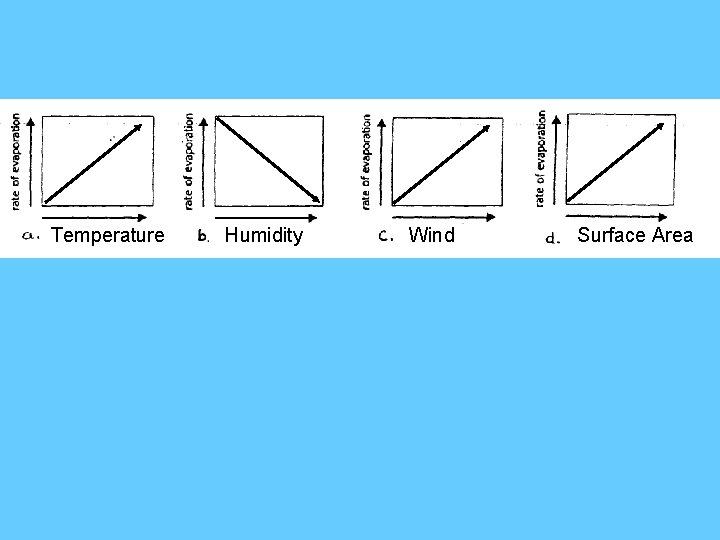
7. Factors affecting the rate of evaporation: a. Temp. - As temp. increases. the rate of evaporation increases b. Humidity - As humidity increases the rate of evaporation decreases c. Wind - As wind increases the rate of evaporation increases d. Surface Area - As surface area increases evaporation increases.
Temperature Humidity Wind Surface Area
9. Dew Point Temperature- The temperature to which air must be to reach saturation. a. Using a sling psychrometer to measure the dew point temperature A sling psychrometer consists of two thermometers mounted on a narrow frame which has a handle used to whirl it. The thermometer always remains dry (dry bulb). The other has a cloth sock or wick over its bulb that is moistened before use (wet bulb) After a psychrometer is whirled around for a little less than one minute, both thermometers should be read. Evaporation of water from the wick will have lowered the temperature reading on the wet bulb (if the air is not saturated). Remember: evaporation absorbs heat and is a cooling process. 16
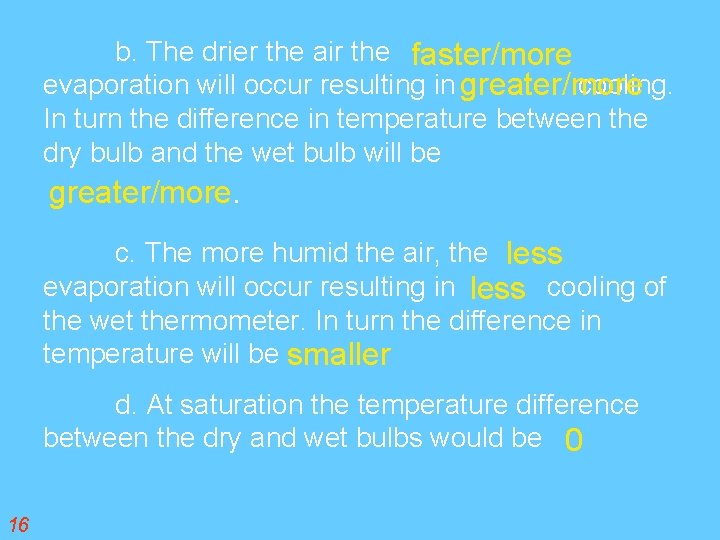
b. The drier the air the faster/more evaporation will occur resulting in greater/more cooling. In turn the difference in temperature between the dry bulb and the wet bulb will be greater/more. c. The more humid the air, the less evaporation will occur resulting in less cooling of the wet thermometer. In turn the difference in temperature will be smaller d. At saturation the temperature difference between the dry and wet bulbs would be 0 16
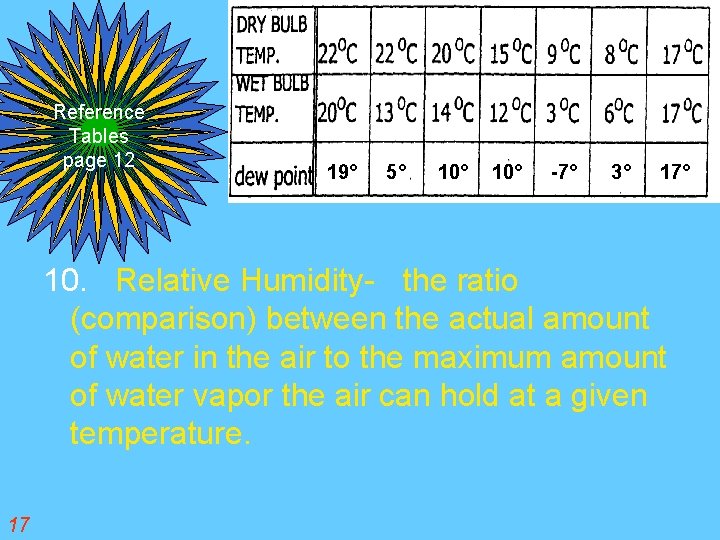
Reference Tables page 12 19° 5° 10° -7° 3° 17° 10. Relative Humidity- the ratio (comparison) between the actual amount of water in the air to the maximum amount of water vapor the air can hold at a given temperature. 17
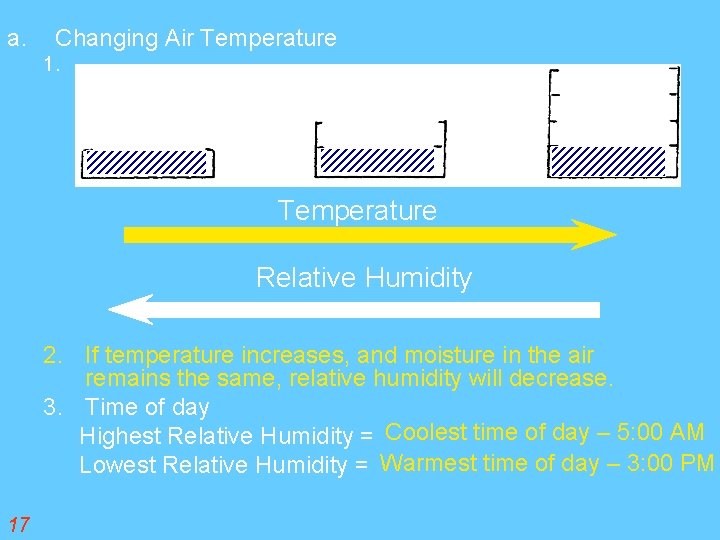
a. Changing Air Temperature 1. Temperature Relative Humidity 2. If temperature increases, and moisture in the air remains the same, relative humidity will decrease. 3. Time of day Highest Relative Humidity = Coolest time of day – 5: 00 AM Lowest Relative Humidity = Warmest time of day – 3: 00 PM 17
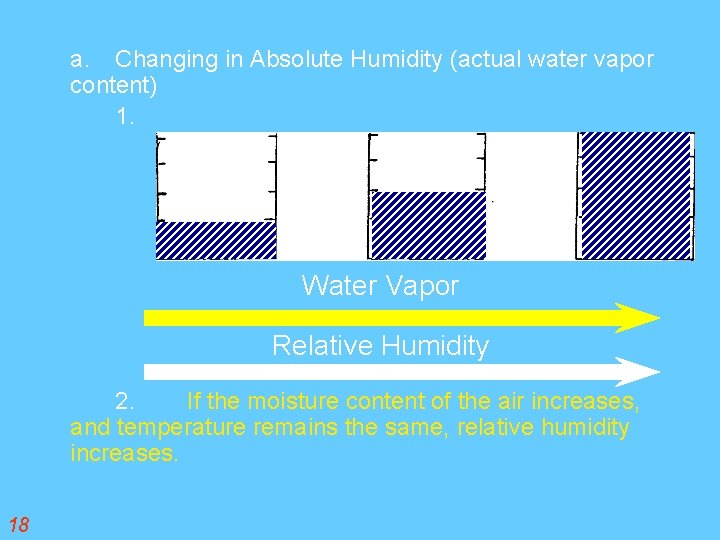
a. Changing in Absolute Humidity (actual water vapor content) 1. Water Vapor Relative Humidity 2. If the moisture content of the air increases, and temperature remains the same, relative humidity increases. 18
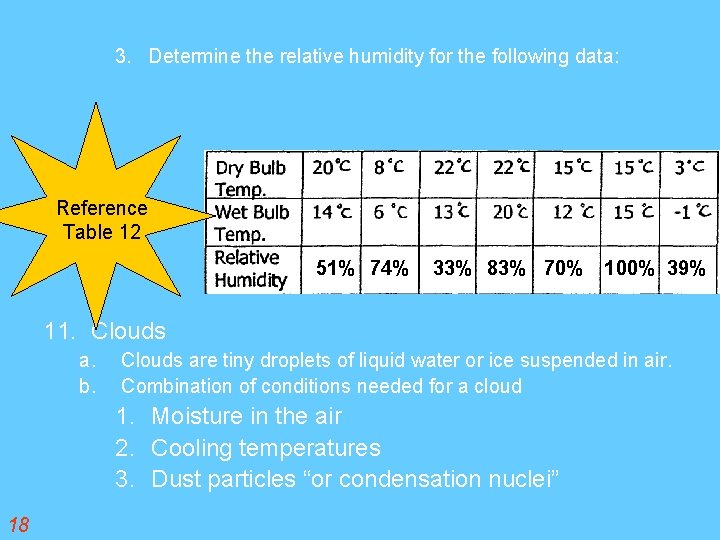
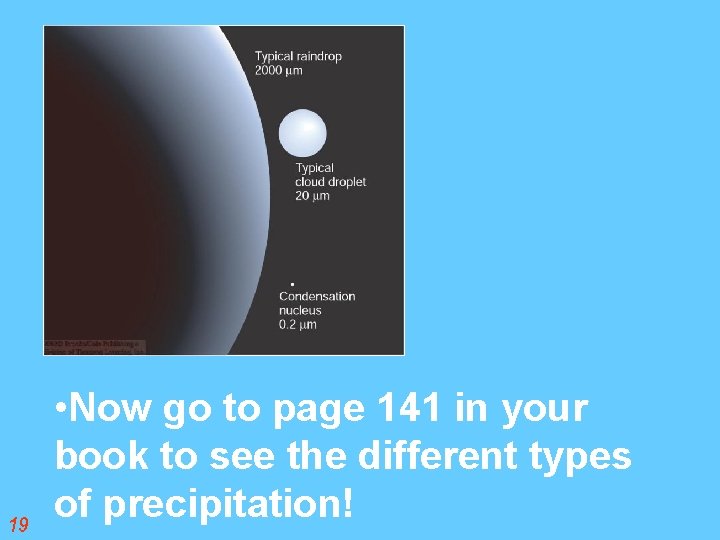
3. Determine the relative humidity for the following data: Reference Table 12 51% 74% 33% 83% 70% 100% 39% 11. Clouds a. b. Clouds are tiny droplets of liquid water or ice suspended in air. Combination of conditions needed for a cloud 1. Moisture in the air 2. Cooling temperatures 3. Dust particles “or condensation nuclei” 18
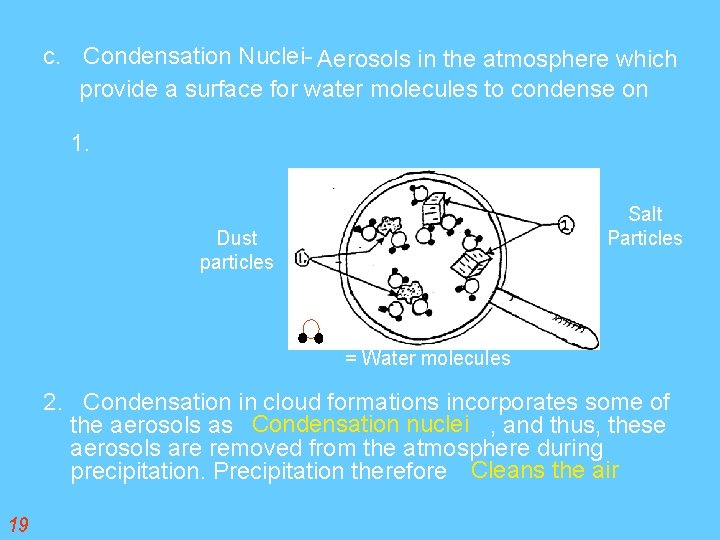
c. Condensation Nuclei- Aerosols in the atmosphere which provide a surface for water molecules to condense on 1. Salt Particles Dust particles = Water molecules 2. Condensation in cloud formations incorporates some of the aerosols as Condensation nuclei , and thus, these aerosols are removed from the atmosphere during precipitation. Precipitation therefore Cleans the air 19
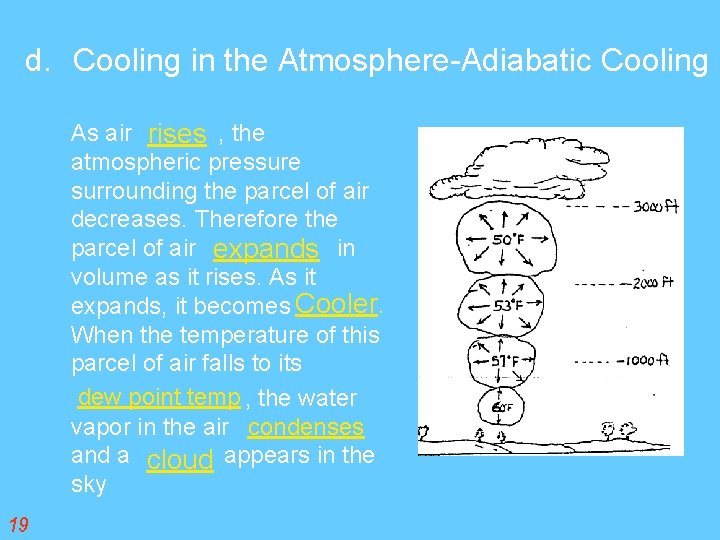
d. Cooling in the Atmosphere-Adiabatic Cooling As air rises , the atmospheric pressure surrounding the parcel of air decreases. Therefore the parcel of air expands in volume as it rises. As it expands, it becomes Cooler. When the temperature of this parcel of air falls to its dew point temp , the water vapor in the air condenses and a cloud appears in the sky 19
19 • Now go to page 141 in your book Clouds float to see the different types of precipitation!
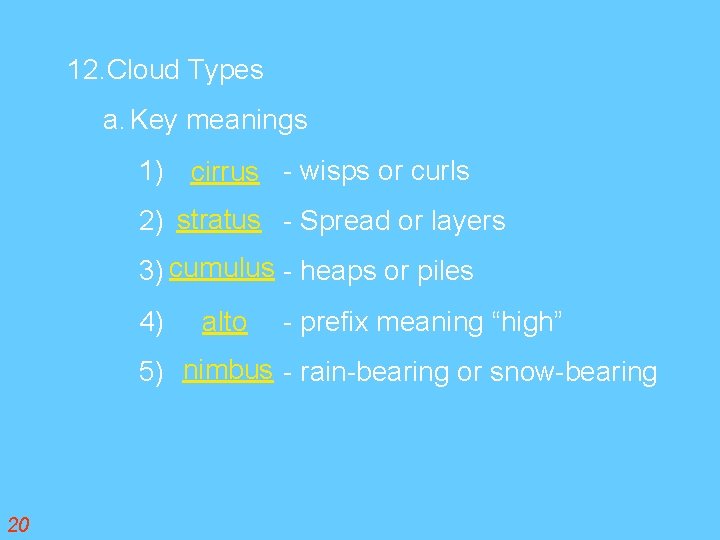
12. Cloud Types a. Key meanings 1) cirrus - wisps or curls 2) stratus - Spread or layers 3) cum ulus - heaps or piles 4) alto - prefix meaning “high” 5) nimbus - rain-bearing or snow-bearing 20
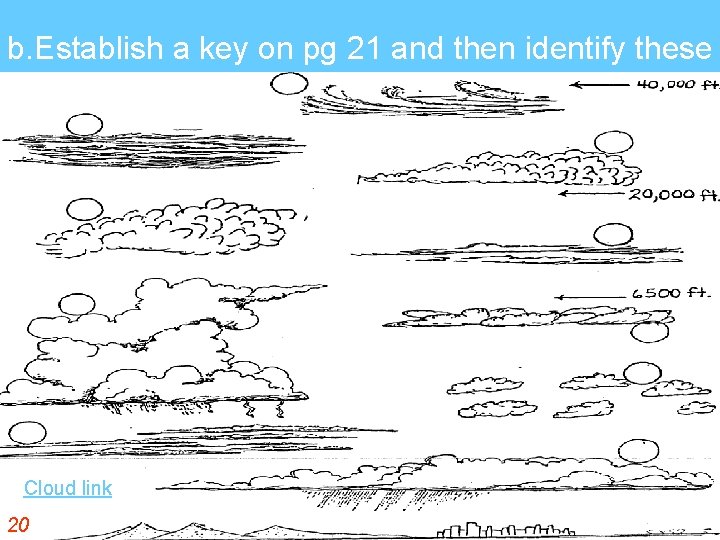
b. Establish a key on pg 21 and then identify these Cloud link 20
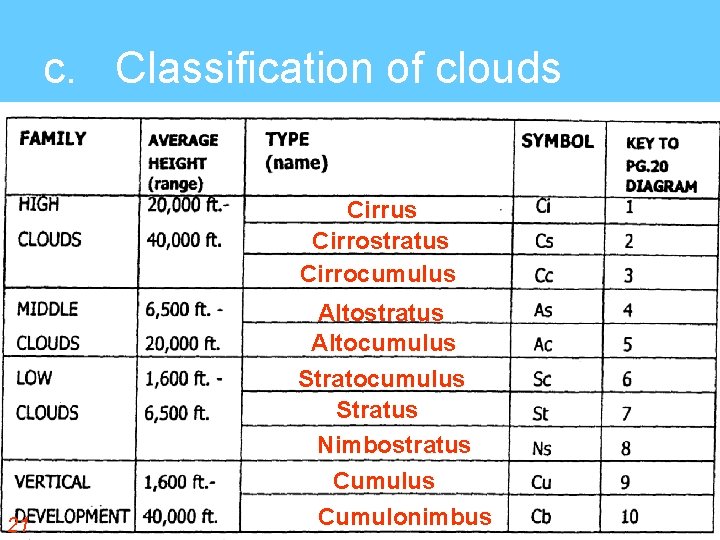
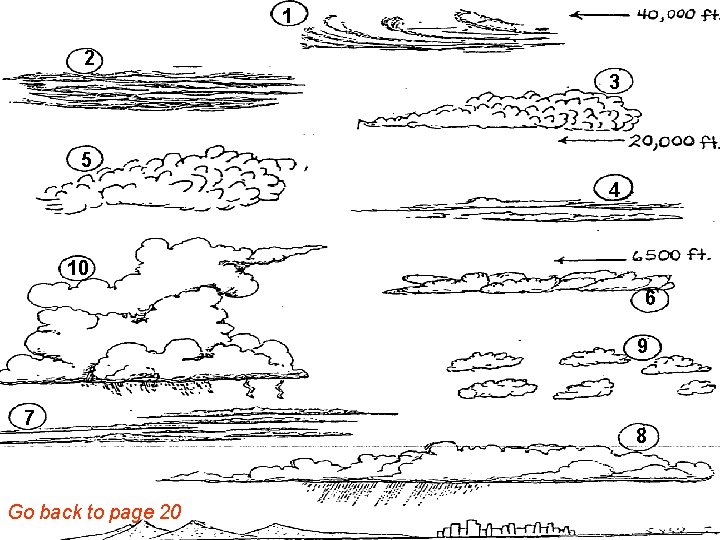
c. Classification of clouds Cirrus Cirrostratus Cirrocumulus 21 Altostratus Altocumulus Stratus Nimbostratus Cumulonimbus
1 2 3 5 4 10 6 9 7 Go back to page 20 8
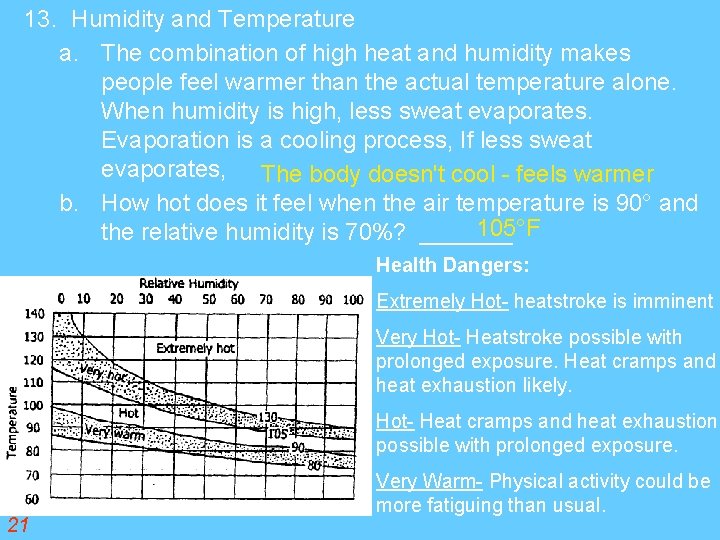
13. Humidity and Temperature a. The combination of high heat and humidity makes people feel warmer than the actual temperature alone. When humidity is high, less sweat evaporates. Evaporation is a cooling process, If less sweat evaporates, The body doesn't cool - feels warmer b. How hot does it feel when the air temperature is 90° and 105°F the relative humidity is 70%? _______ Health Dangers: Extremely Hot- heatstroke is imminent Very Hot- Heatstroke possible with prolonged exposure. Heat cramps and heat exhaustion likely. Hot- Heat cramps and heat exhaustion possible with prolonged exposure. 21 Very Warm- Physical activity could be more fatiguing than usual.
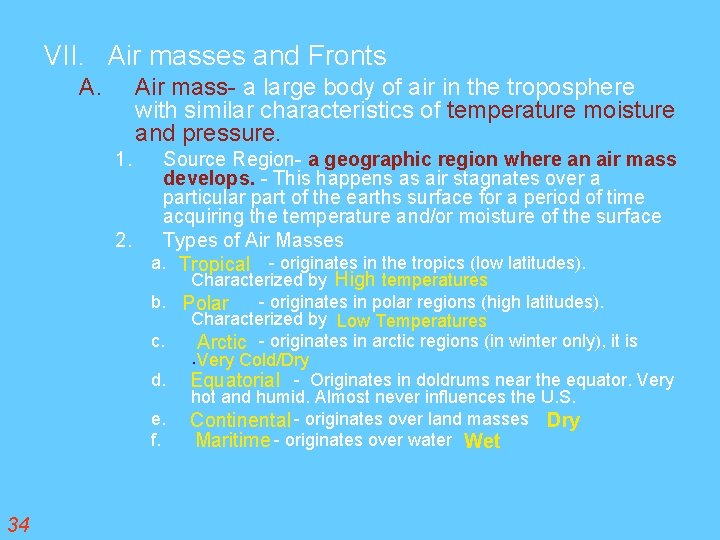
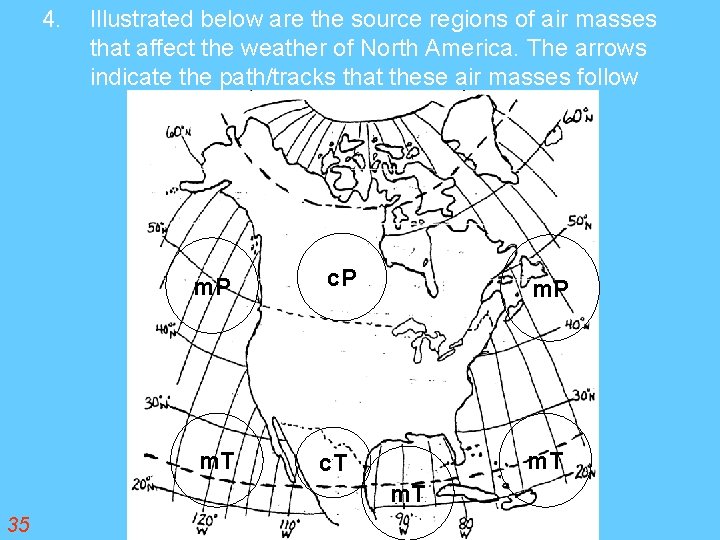
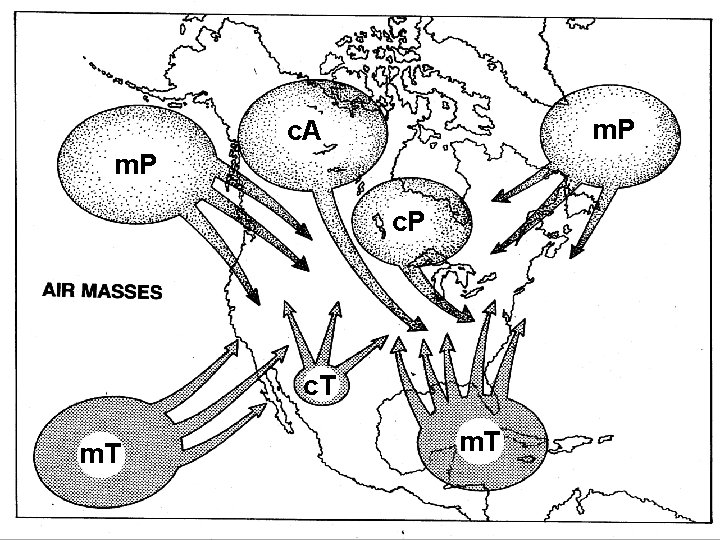
VII. Air masses and Fronts A. Air mass- a large body of air in the troposphere with similar characteristics of temperature moisture and pressure. 1. Source Region- a geographic region where an air mass develops. - This happens as air stagnates over a particular part of the earths surface for a period of time acquiring the temperature and/or moisture of the surface 2. Types of Air Masses a. Tropical - originates in the tropics (low latitudes). Characterized by High temperatures b. Polar - originates in polar regions (high latitudes). c. d. e. f. 34 Characterized by Low Temperatures Arctic - originates in arctic regions (in winter only), it is. Very Cold/Dry Equatorial - Originates in doldrums near the equator. Very hot and humid. Almost never influences the U. S. Continental - originates over land masses Dry Maritime - originates over water Wet
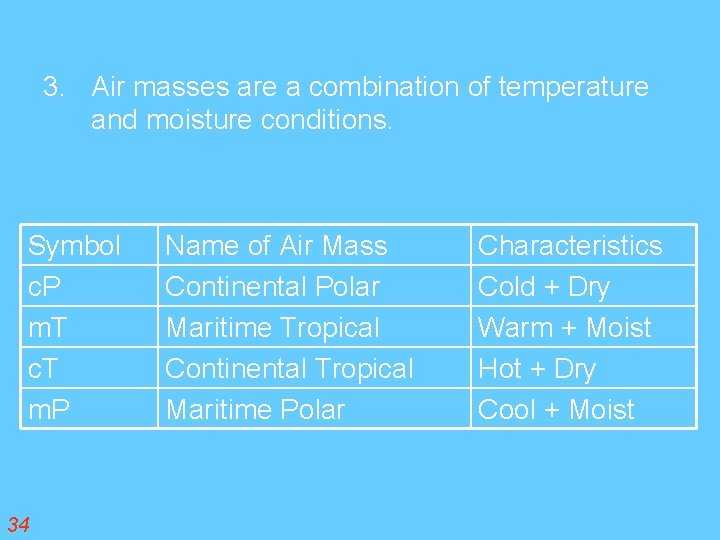
3. Air masses are a combination of temperature and moisture conditions. Symbol c. P m. T c. T m. P 34 Name of Air Mass Continental Polar Maritime Tropical Continental Tropical Maritime Polar Characteristics Cold + Dry Warm + Moist Hot + Dry Cool + Moist
4. Illustrated below are the source regions of air masses that affect the weather of North America. The arrows indicate the path/tracks that these air masses follow m. P m. T c. T m. T 35
m. P c. A m. P c. T m. T
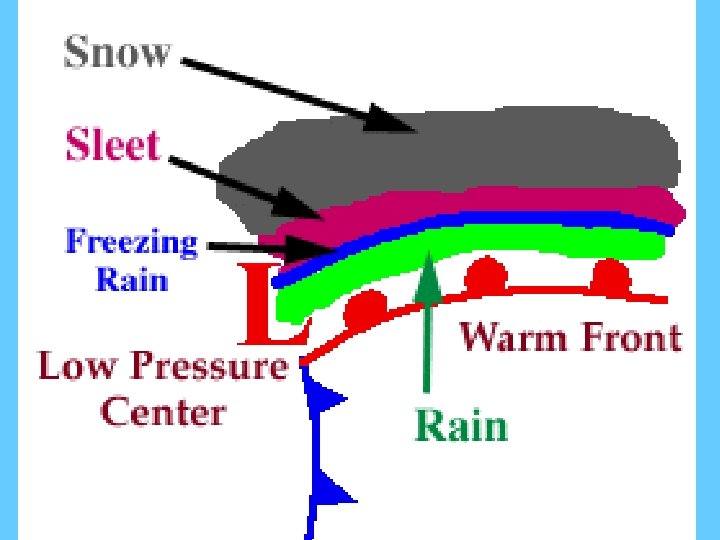
FRONTS • The boundary between two air mass. • Little mixing of air occurs at fronts. • Unstableness of fronts is the cause of precipitation. • 4 types of fronts and they are. . .
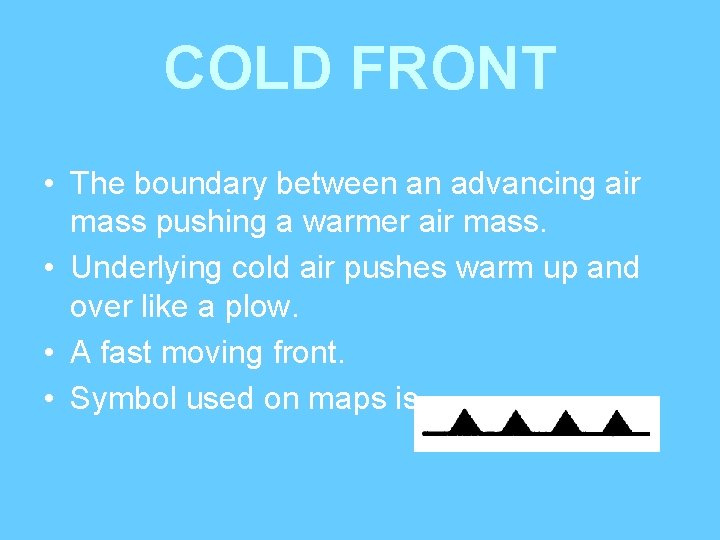
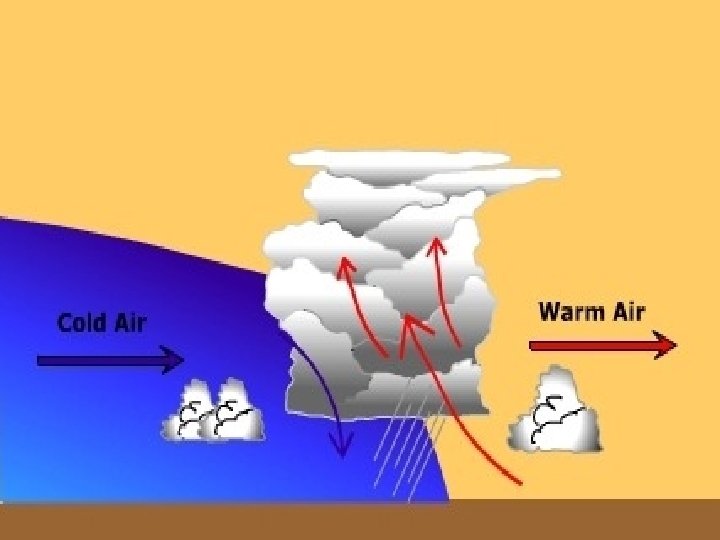
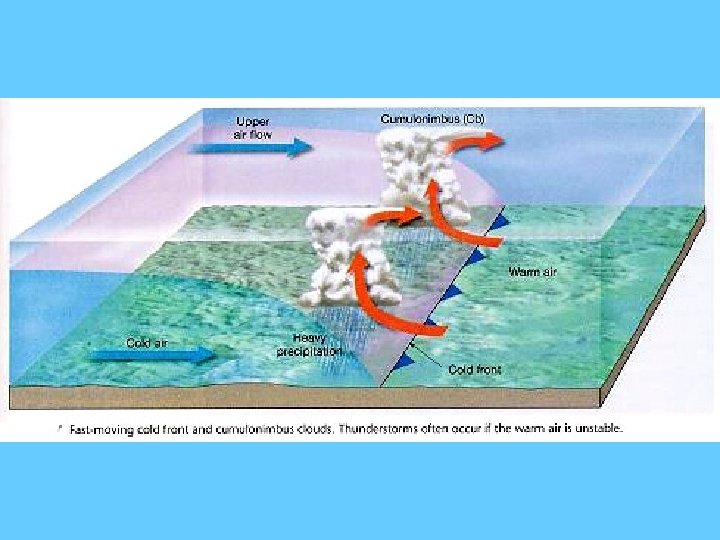
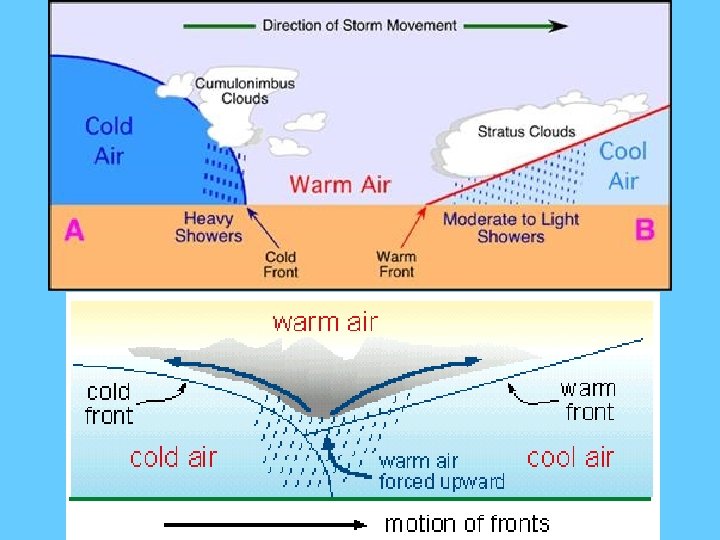
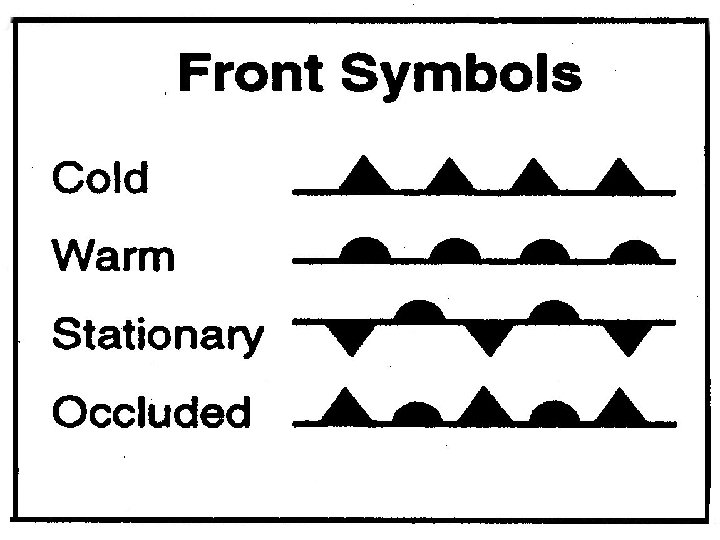
COLD FRONT • The boundary between an advancing air mass pushing a warmer air mass. • Underlying cold air pushes warm up and over like a plow. • A fast moving front. • Symbol used on maps is
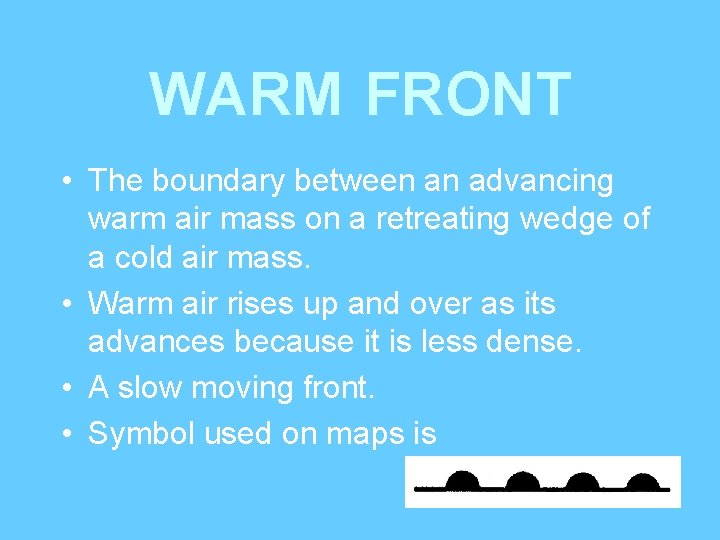
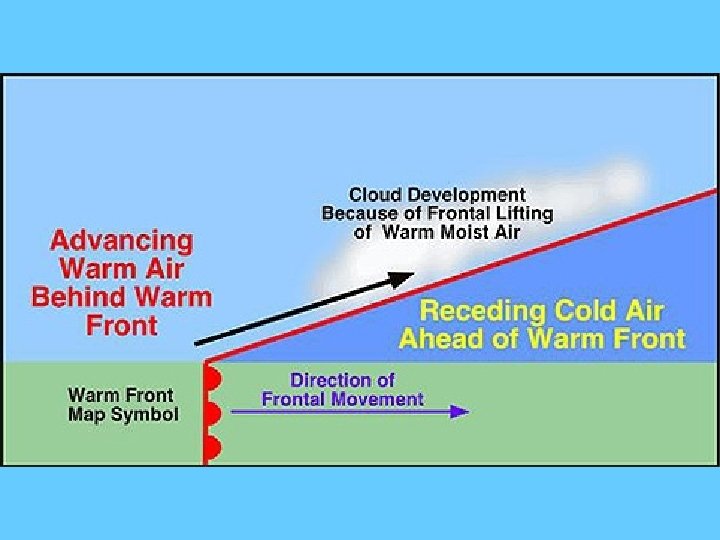
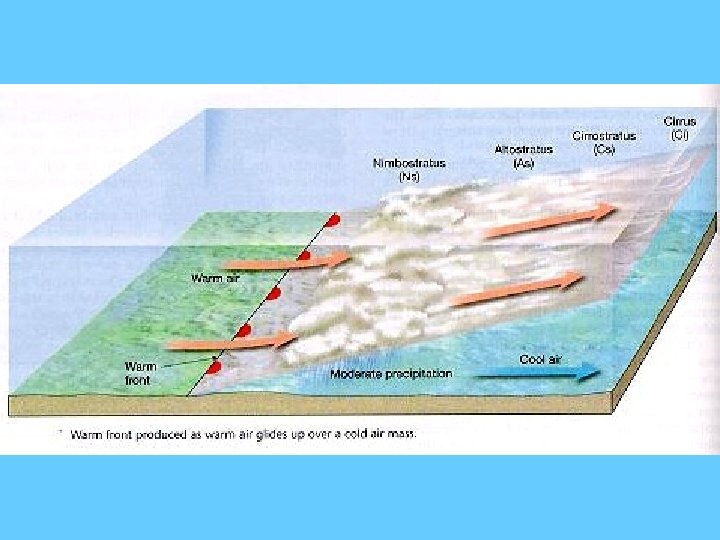
WARM FRONT • The boundary between an advancing warm air mass on a retreating wedge of a cold air mass. • Warm air rises up and over as its advances because it is less dense. • A slow moving front. • Symbol used on maps is
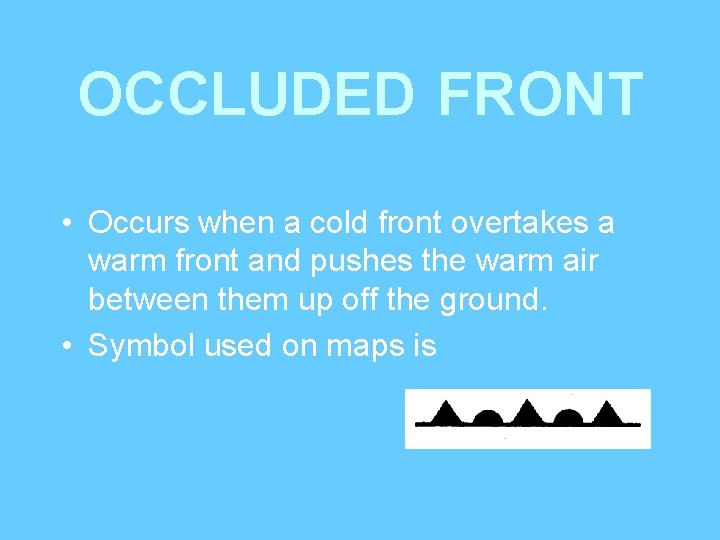
OCCLUDED FRONT • Occurs when a cold front overtakes a warm front and pushes the warm air between them up off the ground. • Symbol used on maps is
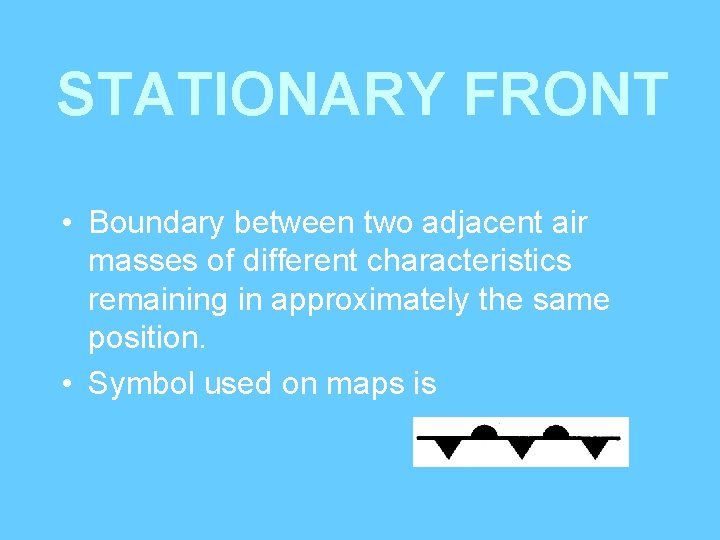
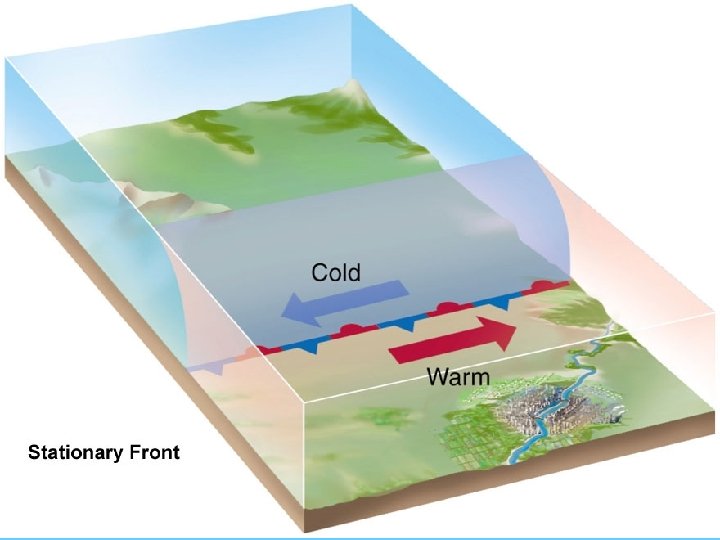
STATIONARY FRONT • Boundary between two adjacent air masses of different characteristics remaining in approximately the same position. • Symbol used on maps is
Symbols point in the direction the air mass is moving.
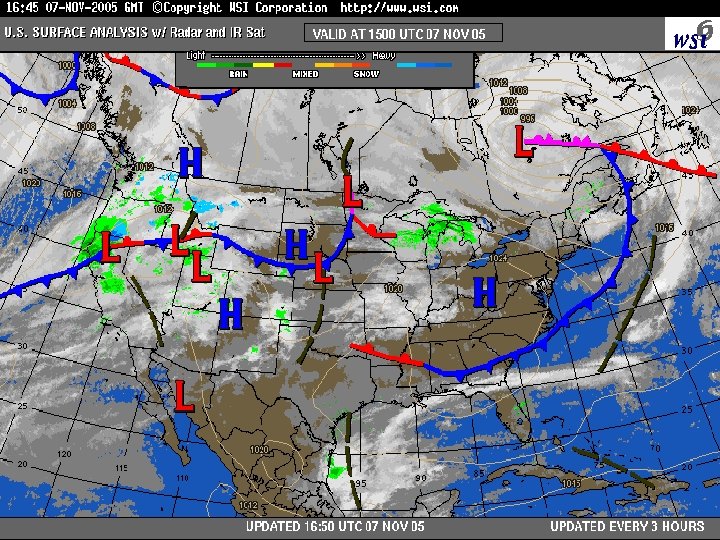
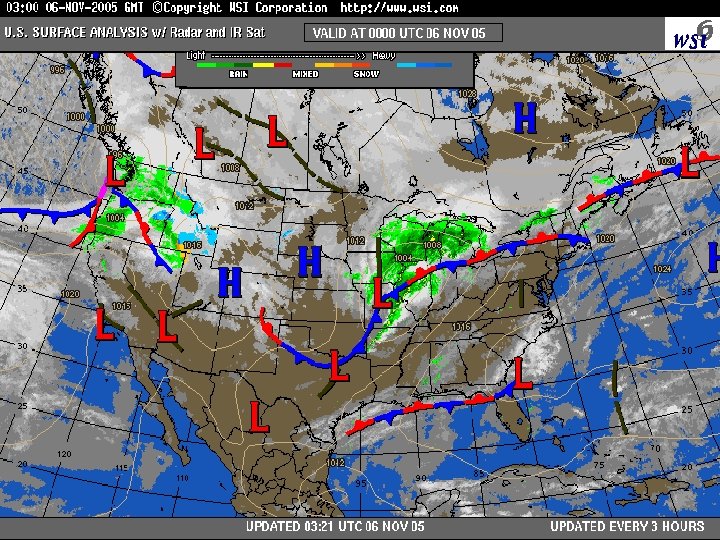
STORM TRACKS • Low pressure storms generally track (move) to the east (or northeast) across the United States. • Due to the wind belt in which the United States is located. ESRT p 14
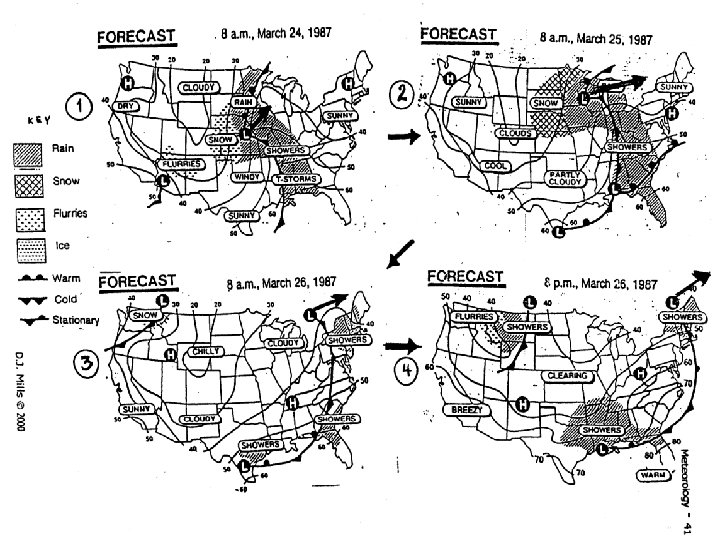
WEATHER PREDICTION • Weather prediction is based on probability. • A few days predictions are more accurate and reliable than long term predictions. • Computer analysis and satellite images have improved forecasting in recent years.
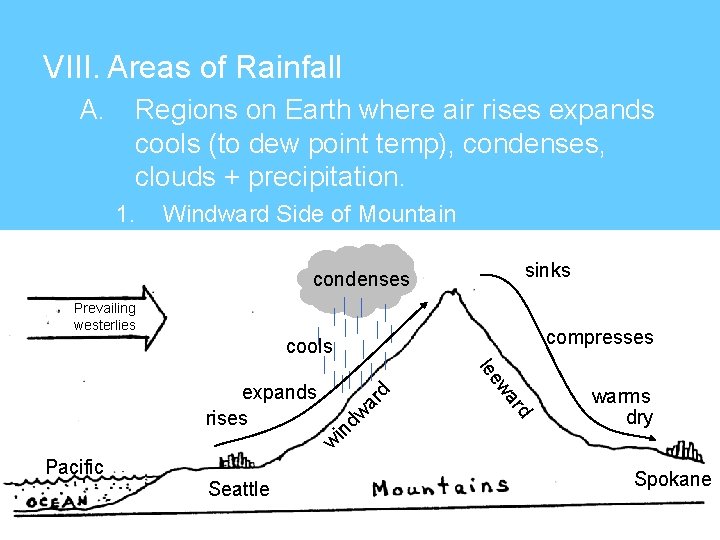
VIII. Areas of Rainfall A. Regions on Earth where air rises expands cools (to dew point temp), condenses, clouds + precipitation. 1. Windward Side of Mountain sinks condenses Prevailing westerlies compresses dw ar warms dry w in rd wa lee expands rises d cools Pacific Seattle Spokane
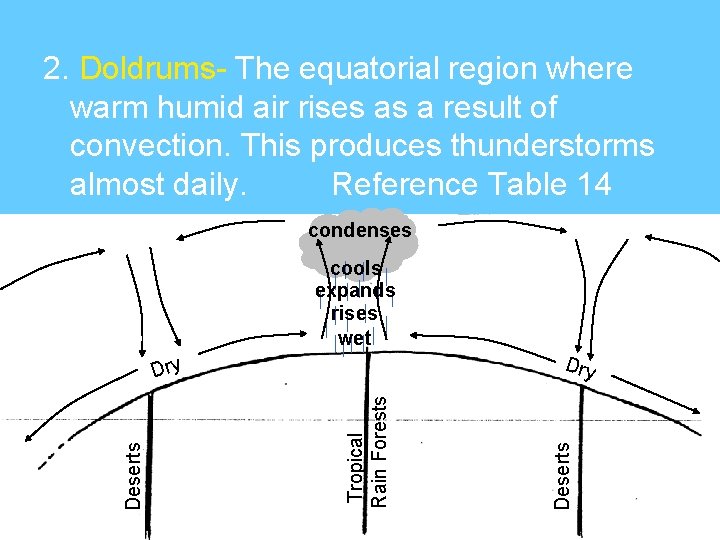
2. Doldrums- The equatorial region where warm humid air rises as a result of convection. This produces thunderstorms almost daily. Reference Table 14 condenses cools expands rises wet Tropical Rain Forests Deserts Dry
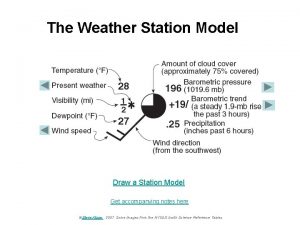
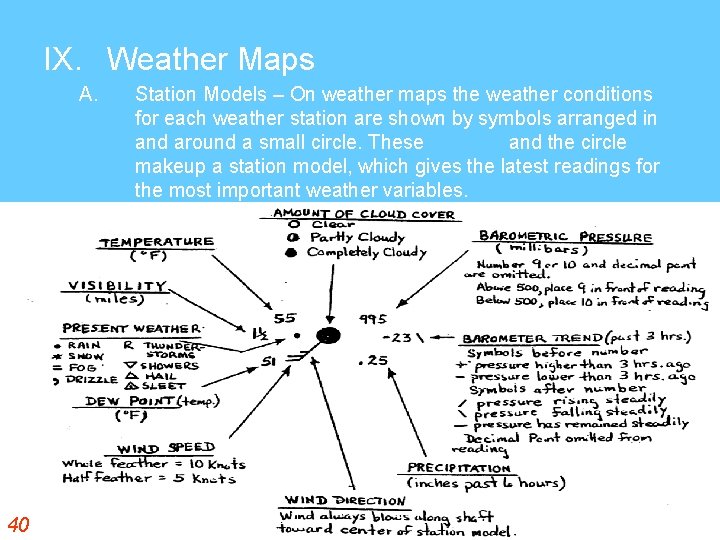
IX. Weather Maps A. 40 Station Models – On weather maps the weather conditions for each weather station are shown by symbols arranged in and around a small circle. These symbols and the circle makeup a station model, which gives the latest readings for the most important weather variables.
The Weather Station Model Draw a Station Model Get accompanying notes here ©Steve Kluge 2007 Some images from the NYSED Earth Science Reference Tables link
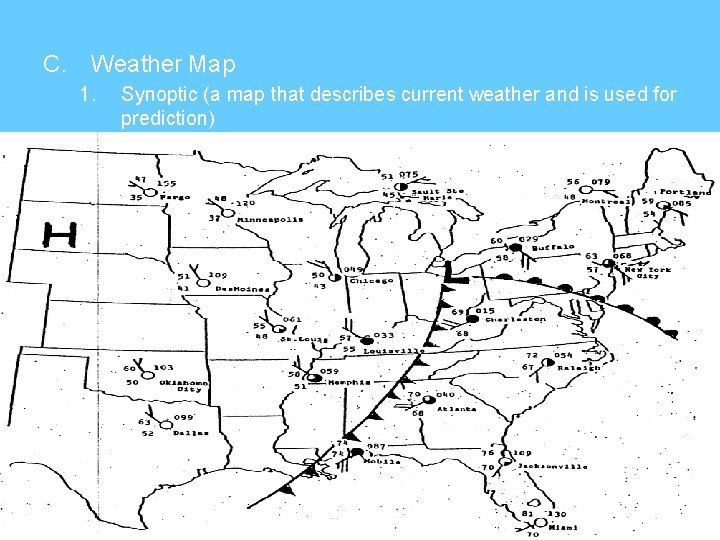
C. Weather Map 1. Synoptic (a map that describes current weather and is used for prediction)
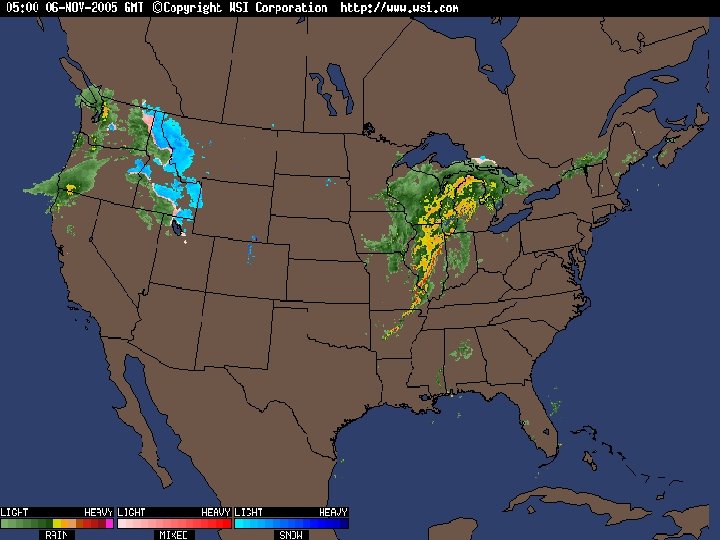
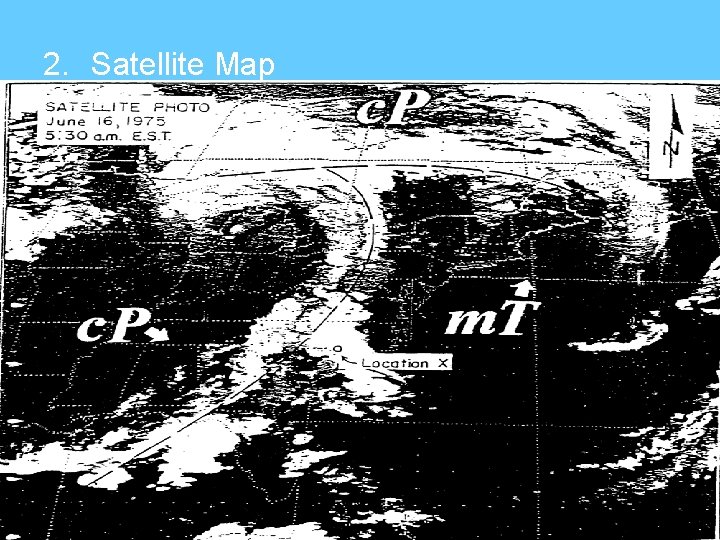
2. Satellite Map
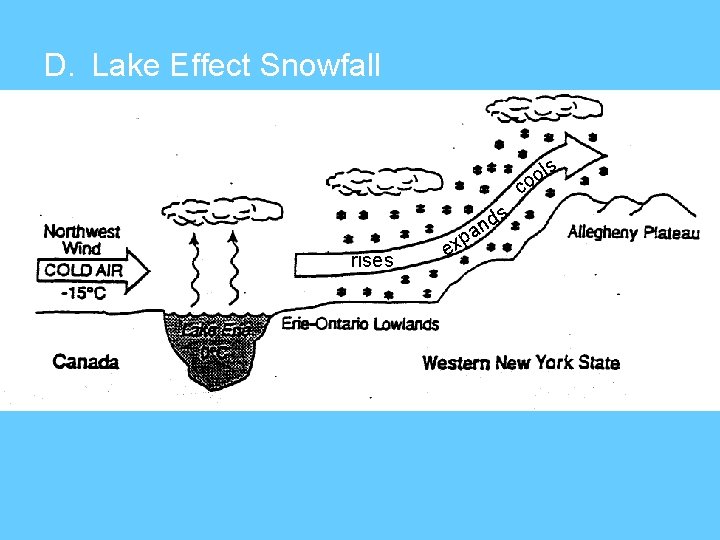
D. Lake Effect Snowfall ls o co s rises p ex d an