GEU 0047 Meteorology Lecture 01 Introduction to weather


.")


- Slides: 60
GEU 0047: Meteorology Lecture 01 Introduction to weather and climate
Web Resources • Online tutorials – Ahrens 7 • World Weather Information Service – world's weather today • The Local Weather and Forecast – http: //www. cwb. gov. tw/ • The NOAA National Weather Service – http: //www. nws. noaa. gov/ • The GOES Weather Satellites – http: //wwwghcc. msfc. nasa. gov/GOES/ • Satellites monitoring the natural resources – http: //modis. gsfc. nasa. gov
Meteorology Overview • Topics – – – – – Observational Atmospheric Phenomena Structure of the Atmosphere Physical Dynamics* Atmospheric Chemistry Radiation and Heat Transfer Remote Sensing* Weather Forecasting* Severe Weather Global Climate Issues
Meteorology Overview • Meteorology – the study of the atmosphere and the involved processes that cause weather (mainly within the troposphere). • Study the meteorology = study the atmosphere, weather and climate. • Atmosphere – a region of gas about 0. 25% of the earth’s diameter (contains 99% of the atmospheric mass. )
The Atmosphere • It is the medium in which the weather takes place which is a thin envelope of gases (a mixture) (which may contain suspended solid and liquid particles and clouds) which encircles the globe. • It functions to provide the essentials for life and orderly functions of physical and biological processes on the earth. (e. g. shields UV, gases for photosynthesis.
Table 1 -1, p. 3
The Weather • Weather is the state of the atmosphere at a specific location and time. • It is described by temperature, cloudiness, visibility, precipitation, wind speed and direction, and humidity, … etc.
Fig. 1 -CO
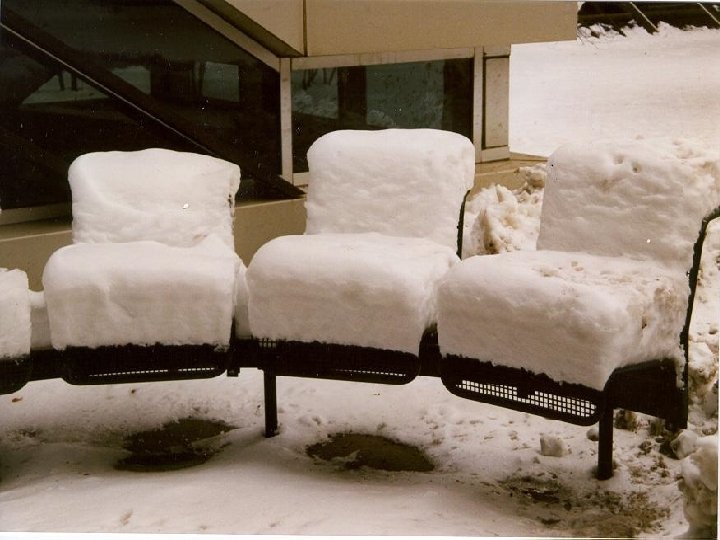
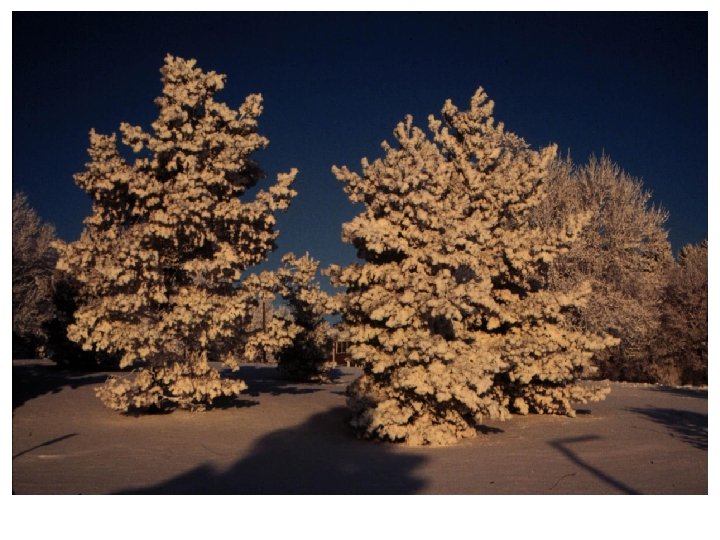
Atmos. is here! What season this image was most likely taken? Sirocco Fig. 1 -2, p. 3
The Climate • Climate is the weather conditions at a locality averaged over a specific period (typically 30 years). • In descriptions, it also includes the departures (anomalies) from the average and extremes in weather (e. g. , frequency of wet-dry spells, frequency of hail, average rainfall.
Condensation Evaporation Fig. 1 -3, p. 5
The Grand Carbon Cycle Fig. 1 -4, p. 5
The Keeling curve Fig. 1 -5, p. 6
Hole? Dobson ? Fig. 1 -6, p. 7
Fig. 1 -7, p. 7
Evolution of the Atmosphere “BIG BANG” 1. First atmosphere -- one of cosmic gases: H 2 - Hydrogen He - Helium CH 4 - Methane NH 3 - Ammonia H 2 O - Water Vapor CO 2 - Carbon Dioxide NOx - Oxides of Nitrogen
Second and Third Atmospheres High temperatures probably drove off primeval atmosphere. 2. Second Atmosphere: Nothing -- similar to the moon 3. Third Atmosphere: Developed from secondary sources such as outgassing from volcanoes, geysers, cracks, fissures, etc. . (gaseous emissions from solids or liquids, usually caused by exposure to high operating temperatures and/or altitude (low external pressure)
Evolution of the Atmosphere Composition of Volcano Effluent H 2 Ov - 68% CO 2 - 13% N 2 , N 0 x - 19% rain oceans After the Earth cooled CO 2 - 74% H 2 Ov - 15% N 2 , NOx - 11% As the earth cooled, the water vapor condensed and created the oceans, etc.
Evolution of the Atmosphere • First bacteria evolved maybe four billion years ago (anaerobic). • About 2 -3 billion years ago green plants appeared in the oceans (algae). • Why oceans? Important for life because H 2 O screens out UV
Evolution of the Atmosphere Why oceans? • The cooling of the primordial Earth to the point where the outgassed volatile components were held in an atmosphere of sufficient pressure for the stabilization and retention of liquid water. • Comets, trans-Neptunian objects (TNO) or water-rich meteorites from the outer reaches of the asteroid belt colliding with a primordial Earth. • Biochemically through mineralization and photosynthesis. e. g. 4 H 2 S + CO 2 ―> CH 4 + 2 H 20 + 4 S (in the presences of sulfide-dependent bacteria and light energy) • Gradual leakage of water stored in hydrous minerals of the Earth's rocks.
Evolution of the Atmosphere • Photosynthesis: CO 2 + sunlight + chlorophyll O 2 + organic material However, time is needed for this to occur, Photodissociation (2 H 2 O ―> 4 H + O 2)
Approximate Composition Evolution of the Atmosphere Faint young sun paradox 100 % CO 2 50 % O 2 0% 5 4 3 2 1 Billions of years before present 0
Evolution of the Atmosphere • Current Atmosphere – N 2 - 78% – O 2 - 21% – Ar - 1% – CO 2 - 0. 03% Nitrogen Oxygen Argon Carbon Dioxide – H 2 Ov - 0 to 4% Water Vapor – Particulates, Trace gases
Summary • Changes after plant life evolved: – CO 2 decreased via photosynthesis – O 2 increased via photosynthesis – Ar (Argon) increased via the radioactive decay of potassium – N 2 ? ? ? ? --- Hmmm, a mystery! (Lavoisier named it azote, “without life”) Homework #1: Please survey current theorems regarding the origin of nitrogen in modern atmosphere (Due 4 Oct. )
Vertical structure of atmosphere
= mass/volume = force/area Fig. 1 -8, p. 10
1 mb = 1 h. Pa = 100 Pascal 1 Pascal = 1 NT/m 2 1 NT = 1 Kg .1 meter/sec 2 Fig. 1 -9, p. 10
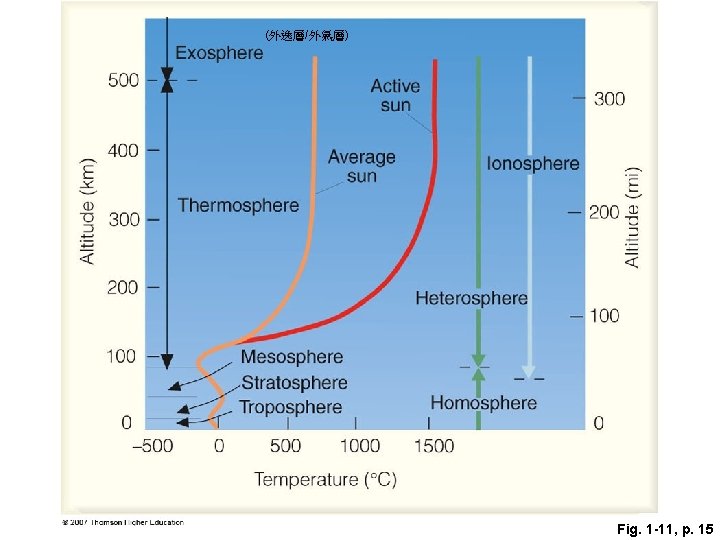
Temperature profile Fig. 1 -10, p. 11
Why hot-air balloon rises ? Fig. 4, p. 14
Table 1, p. 13
THE ATMOSPHERE • The atmosphere has two other attributes: • Homosphere – has the same mixing fraction of gases throughout. • Heterosphere – the gases settle out with the heavier gases at the lower part and the lighter at the top. Ionosphere – region where the gases are ionized by the sun’s UV and affect the propagation of radio waves.
Role of ionosphere in radio communications Fig. 1 -12, p. 16
Brief History of Meteorology • The book Meteorologica, written by Aristotle in 340 BC, first described the sum knowledge on weather and climate. It also included topics in astronomy, geography and chemistry. • Instruments developed starting in the late 16 th century. The thermometer, barometer, hygrometer. The development of the telegraph provided routine weather observations.
Brief History of Meteorology • There were advances made in understanding wind flow and storm movement. This lead to produce crude weather maps with isobars in the late 1860’s. In the 1920’s, Norwegian scientists made advances in understanding air masses and weather fronts. In the 1940’s balloon observations of T, humidity and pressure began.
Brief History of Meteorology • High-flying military aircraft discovered the jet streams (mid- to high latitudes). • During the next decade computer programs were developed to describe the atmosphere and programs to predict the weather were developed at Princeton University. These led to the development of Numerical Weather Prediction (NWP) models used today. • The next slide is such a NWP model output analyzed by a forecaster/meteorologist.
http: //www. ametsoc. org Fig. 5, p. 18
Brief History of Meteorology • In the 1960’s weather satellites were introduced. Today these provide remote sensing of many weather elements. They also provide visual and infrared observations of clouds, weather fronts and water and hurricanes. There are satellite instruments which detect ozone, and other pollution components in the atmosphere.
Fig. 1 -13, p. 20
Model Output • There are many ways to observe weather models. We saw a previous slide that was a model output. • A weather map depicting ground and satellite data is also a model (called analyzed field by atmospheric scientists). • The following slide shows a simplified model of the weather by indicating air masses, high and low pressure areas, wind velocity and temperatures.
See Appendix B for more weather symbols and station model Fig. 1 -14, p. 21
Weather and Climate • Weather and climate play a vital roles in the life of humans. • Weather often determines the clothing we wear and whether or not to travel. Often the balance of lives depend on weather. • Climate plays a role in determining when to plant, type of home to build and the type of construction to use (2/3 of economic activities are climate-related )
Fig. 1 -15, p. 21
Fig. 1 -16, p. 22
Fig. 1 -18, p. 23
Fig. 1 -17, p. 22
Fig. 1 -19, p. 23
Fig. 1 -20, p. 23
Tools of the Trade • Need to get used to Time, Temperature, Pressure, Height, Speed thinking in the metric world • Temperature is reported in ºF in the US in ºC everywhere else, K in science • Conversion – ºC=5/9 * (ºF-32) – K = ºC + 273. 15
Tools of the Trade • Time – In meteorology we deal with a universal time so that all observations taken can be used throughout the world – UTC – Coordinated Universal Time – Or GMT Greenwich Mean Time, Zulu (Z) – Right now we are +8 hours from GMT in 120 E
Pressure • Pressure is a unit that will come up in map discussions all the time in meteorology we talk mostly in millibars with standard pressure being 1013. 25 mb, lower pressure more disturbed weather • For calculations we use the Pascal (SI Unit)
Height • Another variable we need to get used to is height. Most of the time we talk in height in feet but in meteorology most charts are done by meters, and distances in km • Precipitation in the US is recorded in hundredths of an inch, while in the rest of world and for calculations we use mm • Conversion • In 1 inch = 2. 54 cm • 100 cm = 1 m • 1000 m = 1 km
Speed • When talking about wind speeds on map charts we use the knot • Conversion – 1 knot = 1. 15 mph • However we do calculations based on meters per seconds (SI units) – 1 mph =. 44704 m/s – 1 knot =. 5144 m/s – So to roughly get knots or mph from m/s just multiply by 2 – 25 m/s ~ 50 knots
Why do we do this? • Need to adhere to WMO standards, so that everyone in the world takes observations the same way at the same times. • Purpose: produce maps and charts and then use these maps and charts for input into numerical models to produce forecast maps and charts. • In this way we know what the weather will be at a given point at a given time in the future.
Finally…Scales in meteorology • Microscale – millimeters to a few kilometers in a seconds to a few minutes – Includes turbulence and pollution dispersion • Mesoscale – a few kilometers to 100’s of km over the scales of a few minutes to a days – Thunderstorms, tornadoes, land/sea breezes • Synoptic scale – 100’s of km to 1000’s of km on the order of a few days to a week – Highs and lows, Hurricanes*, Fronts, Short waves • Planetary scale – 1000 -10000 km weeks to months – Long waves, standing eddies, blocking highs