
Chapter 4 Elements of Meteorology Part 1 Elements

- Slides: 53
Chapter 4 Elements of Meteorology Part 1
Elements of Meteorology • • Temperature Pressure Wind Speed Precipitation Humidity Dewpoint Clouds
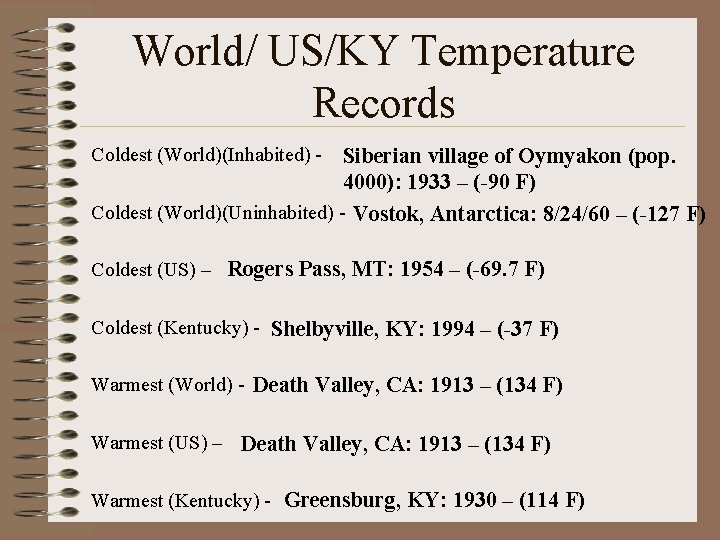
World/ US/KY Temperature Records Coldest (World)(Inhabited) - Siberian village of Oymyakon (pop. 4000): 1933 – (-90 F) Coldest (World)(Uninhabited) - Vostok, Antarctica: 8/24/60 – (-127 F) Coldest (US) – Rogers Pass, MT: 1954 – (-69. 7 F) Coldest (Kentucky) - Shelbyville, KY: 1994 – (-37 F) Warmest (World) - Death Valley, CA: 1913 – (134 F) Warmest (US) – Death Valley, CA: 1913 – (134 F) Warmest (Kentucky) - Greensburg, KY: 1930 – (114 F)
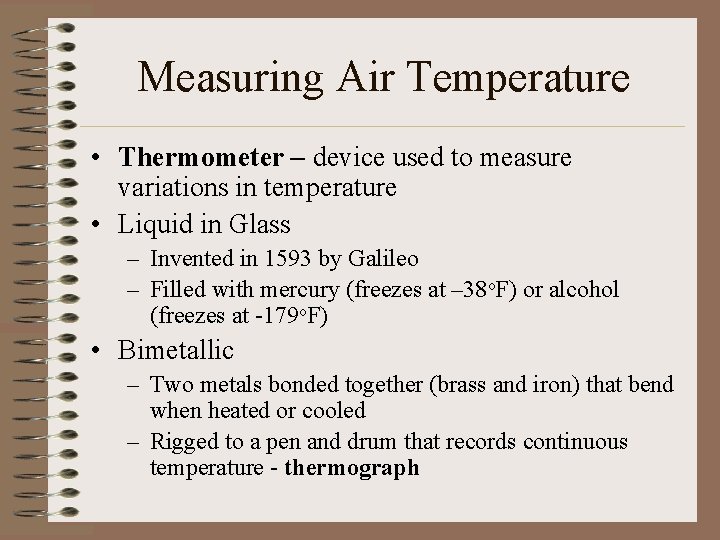
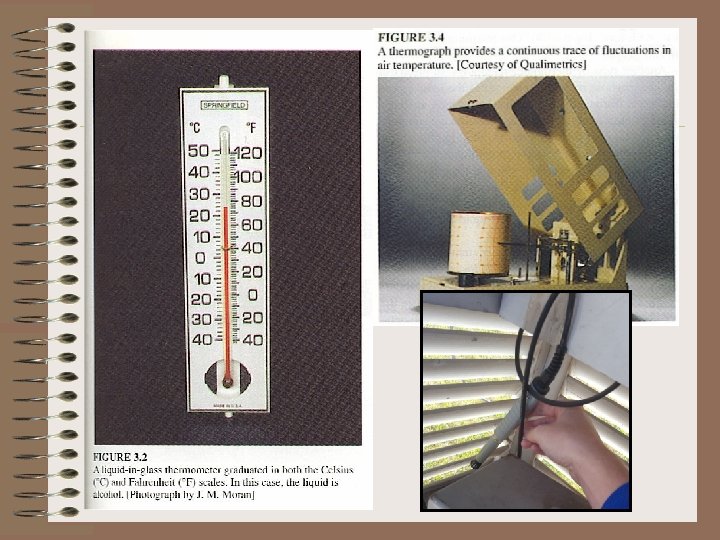
Measuring Air Temperature • Thermometer – device used to measure variations in temperature • Liquid in Glass – Invented in 1593 by Galileo – Filled with mercury (freezes at – 38 o. F) or alcohol (freezes at -179 o. F) • Bimetallic – Two metals bonded together (brass and iron) that bend when heated or cooled – Rigged to a pen and drum that records continuous temperature - thermograph
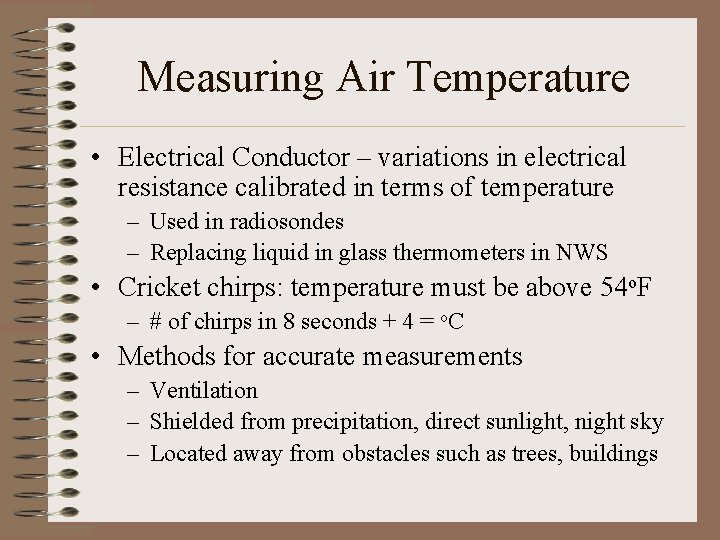
Measuring Air Temperature • Electrical Conductor – variations in electrical resistance calibrated in terms of temperature – Used in radiosondes – Replacing liquid in glass thermometers in NWS • Cricket chirps: temperature must be above 54 o. F – # of chirps in 8 seconds + 4 = o. C • Methods for accurate measurements – Ventilation – Shielded from precipitation, direct sunlight, night sky – Located away from obstacles such as trees, buildings
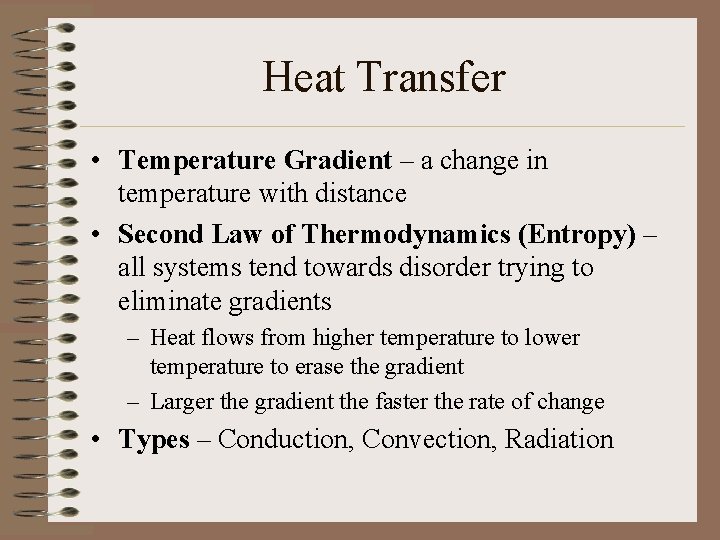
Heat Transfer • Temperature Gradient – a change in temperature with distance • Second Law of Thermodynamics (Entropy) – all systems tend towards disorder trying to eliminate gradients – Heat flows from higher temperature to lower temperature to erase the gradient – Larger the gradient the faster the rate of change • Types – Conduction, Convection, Radiation
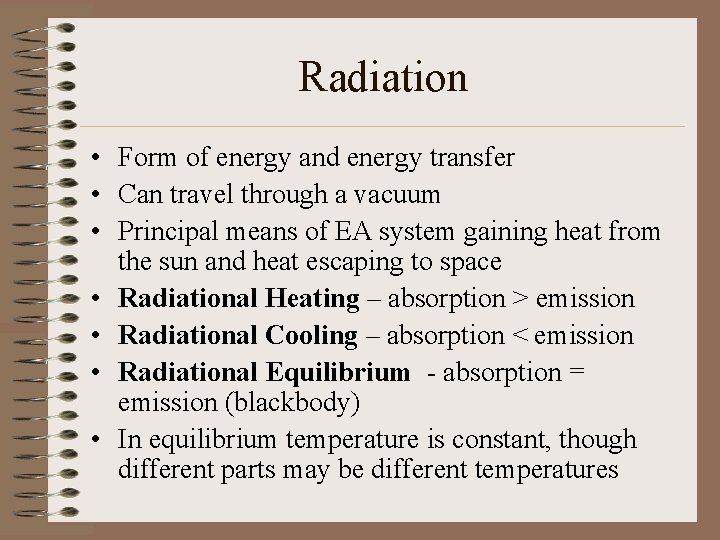
Radiation • Form of energy and energy transfer • Can travel through a vacuum • Principal means of EA system gaining heat from the sun and heat escaping to space • Radiational Heating – absorption > emission • Radiational Cooling – absorption < emission • Radiational Equilibrium - absorption = emission (blackbody) • In equilibrium temperature is constant, though different parts may be different temperatures
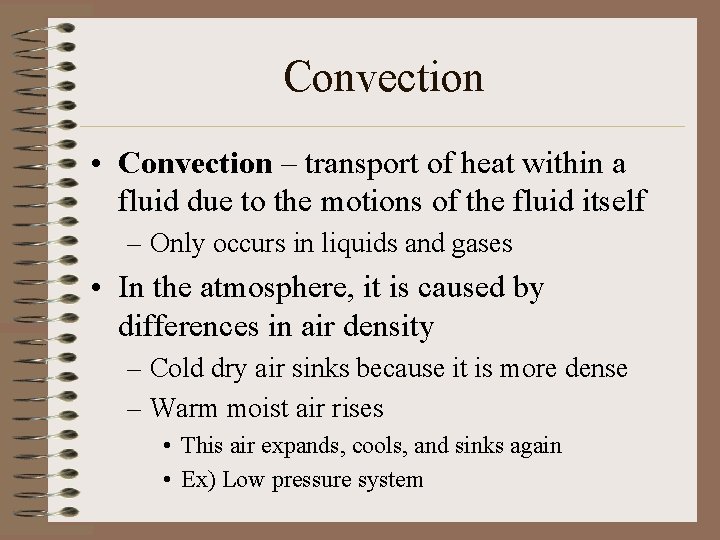
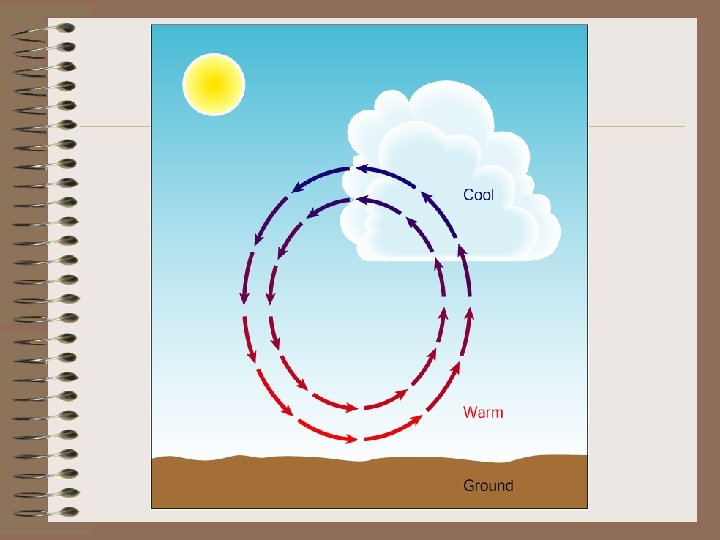
Convection • Convection – transport of heat within a fluid due to the motions of the fluid itself – Only occurs in liquids and gases • In the atmosphere, it is caused by differences in air density – Cold dry air sinks because it is more dense – Warm moist air rises • This air expands, cools, and sinks again • Ex) Low pressure system
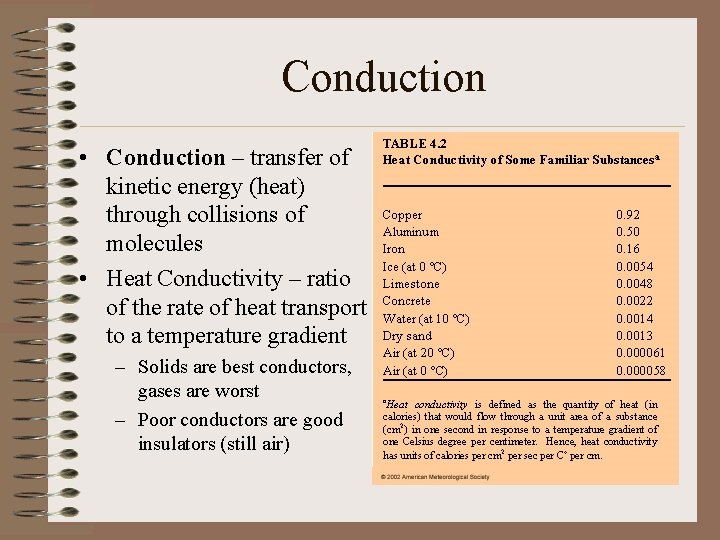
Conduction • Conduction – transfer of kinetic energy (heat) through collisions of molecules • Heat Conductivity – ratio of the rate of heat transport to a temperature gradient – Solids are best conductors, gases are worst – Poor conductors are good insulators (still air)
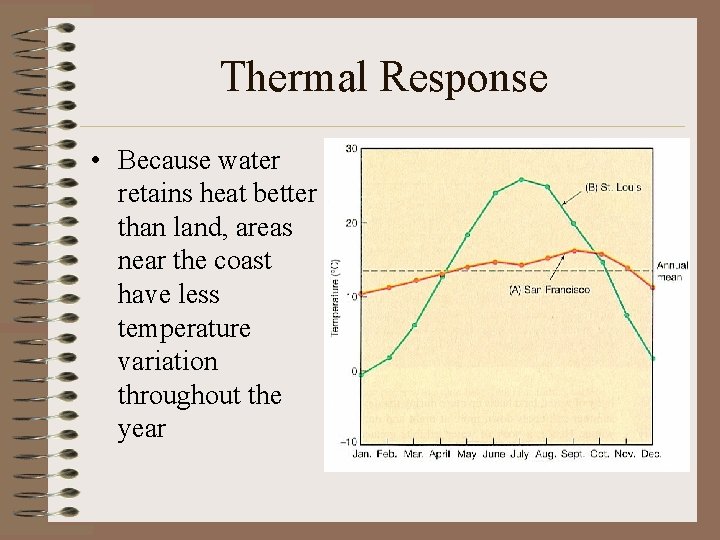
Thermal Response • Because water retains heat better than land, areas near the coast have less temperature variation throughout the year
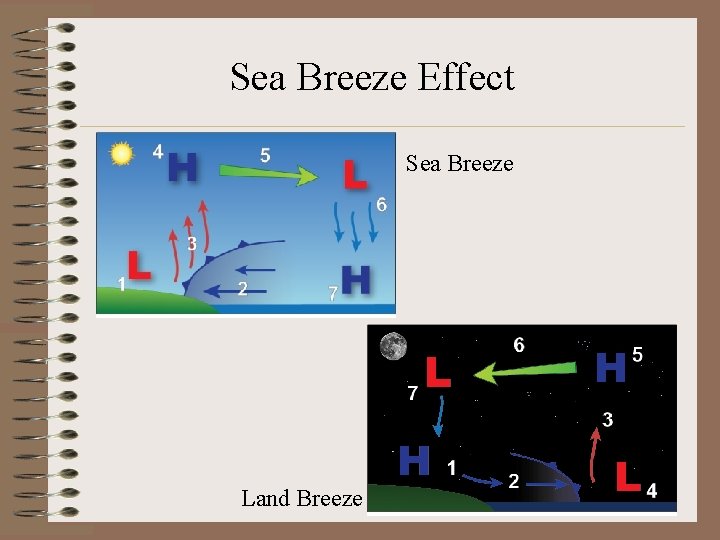
Sea Breeze Effect Sea Breeze Land Breeze
Heat Imbalance (Surface v. Atmosphere) • Earth’s surface undergoes net radiational heating • Earth’s atmosphere undergoes net radiational cooling • In response to this unbalance, heat is transferred to the atmosphere from the surface
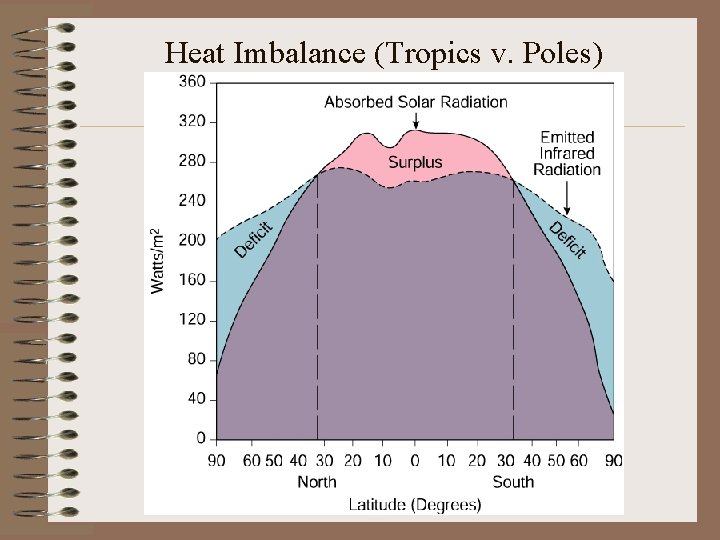
Heat Imbalance (Tropics v. Poles)
Heat Imbalance (Tropics v. Poles) • Tropical Areas: incoming solar radiation is greater than outgoing IR radiation • Polar Areas: incoming solar radiation is less than outgoing IR radiation • Global Radiative Equilibrium: surplus of solar radiation = deficit of IR radiation • Excess heat in tropics is transported to higher latitudes by air masses
Response to Heat Imbalance: Weather • Heat imbalances create temperature gradients – Between surface and troposphere – Between tropics and polar latitudes • Heat is transported by conduction, convection, clouds, air masses, storms – Circulation of the atmosphere • Circulation brings about changes in the state of the atmosphere – WEATHER
Temperature Variations • • Time and Day of year: solar intensity, angle Cloud Cover Surface Characteristics (albedo) Temperature is warmer when – – – It is daylight Under clear skies during the day Under cloudy skies during the night When the ground is not snow covered When the ground is dry (2012)
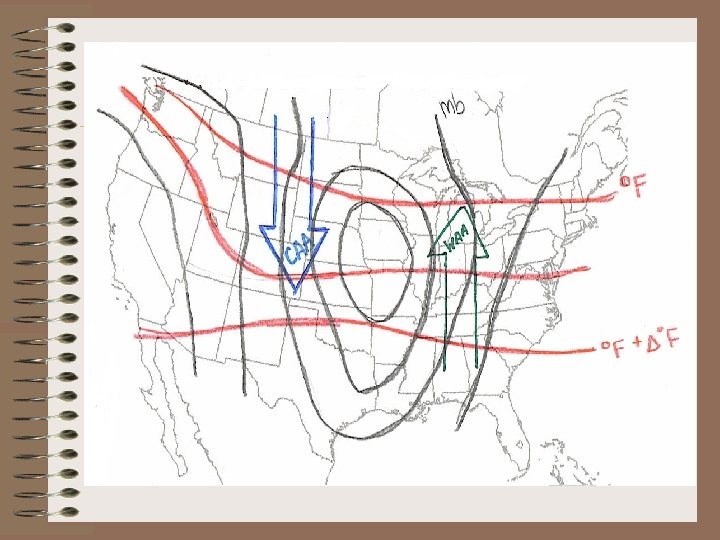
Air Mass Advection • Movement of an air mass from one place to another • Warm Air Advection (WAA) – Movement of warm air • Cold Air Advection (CAA) – Movement of cold air • Advection occurs when isobars and isotherms are NOT parallel
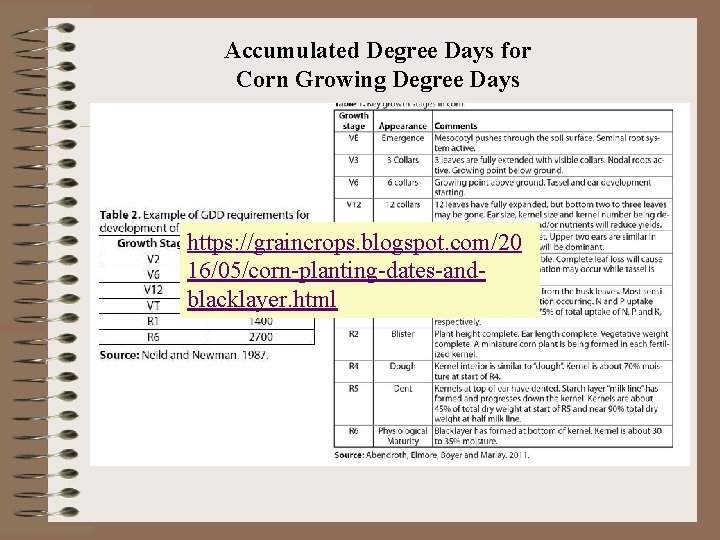
Accumulated Degree Days for Corn Growing Degree Days https: //graincrops. blogspot. com/20 16/05/corn-planting-dates-andblacklayer. html
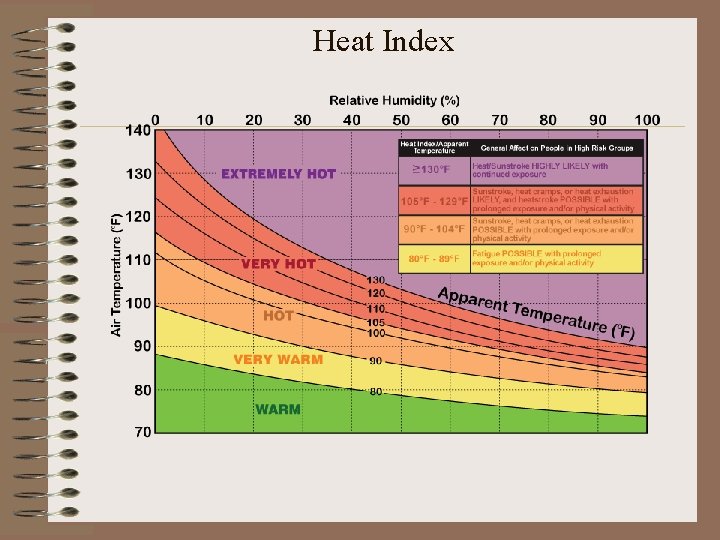
Heat Index
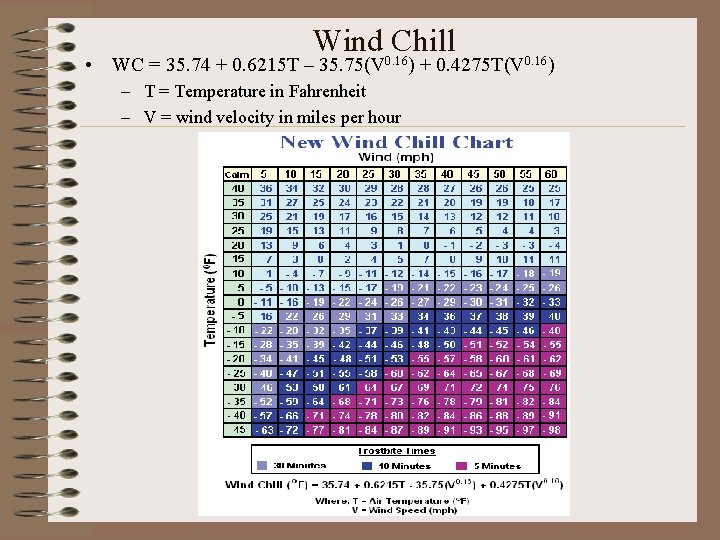
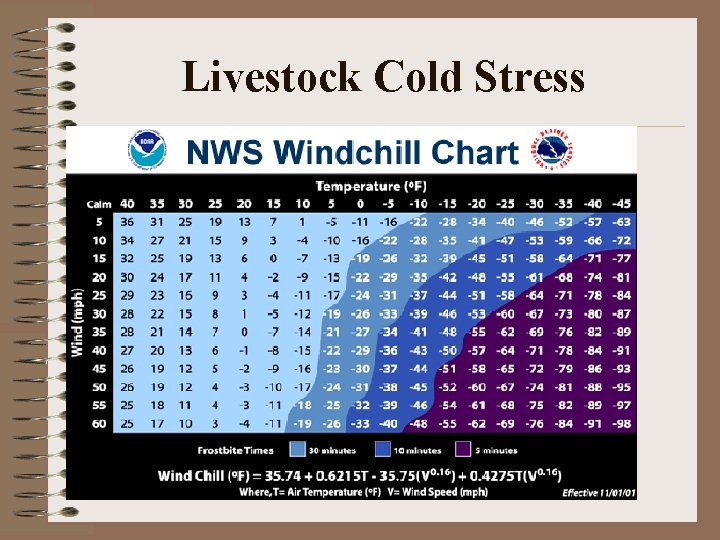
Wind 0. 16 Chill • WC = 35. 74 + 0. 6215 T – 35. 75(V – T = Temperature in Fahrenheit – V = wind velocity in miles per hour ) + 0. 4275 T(V 0. 16)
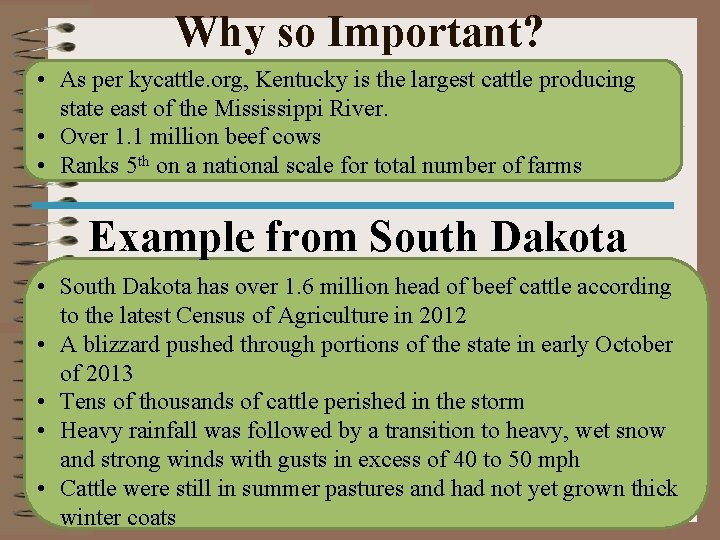
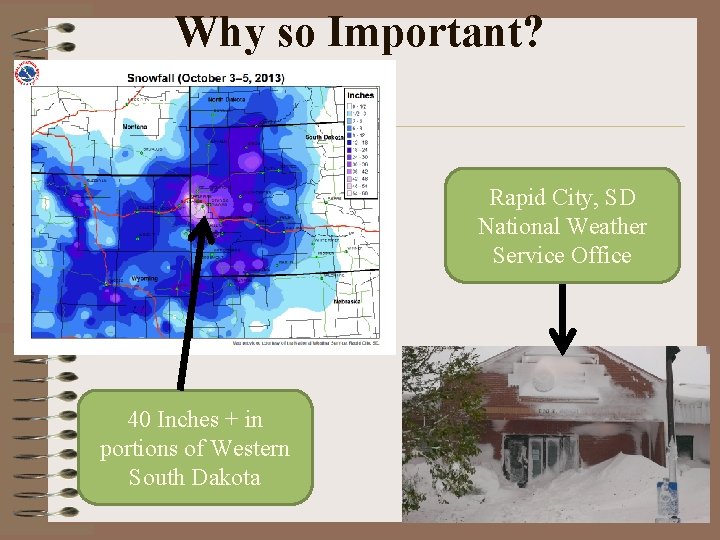
Why so Important? • As per kycattle. org, Kentucky is the largest cattle producing state east of the Mississippi River. • Over 1. 1 million beef cows • Ranks 5 th on a national scale for total number of farms Example from South Dakota • South Dakota has over 1. 6 million head of beef cattle according to the latest Census of Agriculture in 2012 • A blizzard pushed through portions of the state in early October of 2013 • Tens of thousands of cattle perished in the storm • Heavy rainfall was followed by a transition to heavy, wet snow and strong winds with gusts in excess of 40 to 50 mph • Cattle were still in summer pastures and had not yet grown thick winter coats
Livestock Cold Stress
Why so Important? Rapid City, SD National Weather Service Office 40 Inches + in portions of Western South Dakota
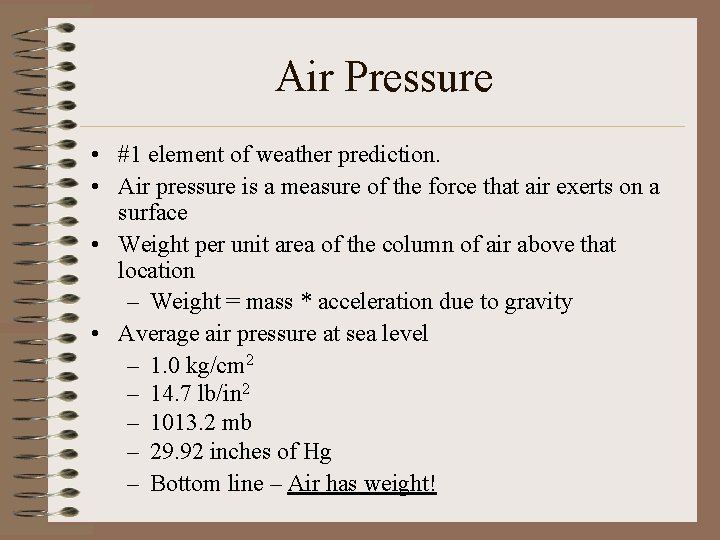
Air Pressure • #1 element of weather prediction. • Air pressure is a measure of the force that air exerts on a surface • Weight per unit area of the column of air above that location – Weight = mass * acceleration due to gravity • Average air pressure at sea level – 1. 0 kg/cm 2 – 14. 7 lb/in 2 – 1013. 2 mb – 29. 92 inches of Hg – Bottom line – Air has weight!
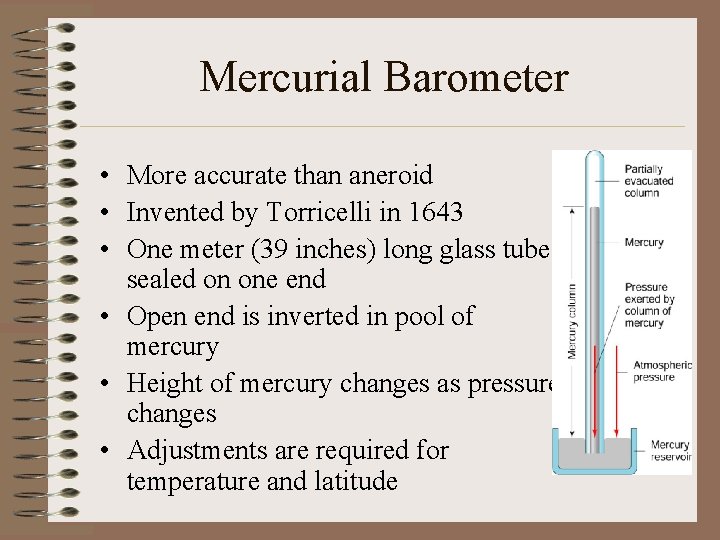
Mercurial Barometer • More accurate than aneroid • Invented by Torricelli in 1643 • One meter (39 inches) long glass tube sealed on one end • Open end is inverted in pool of mercury • Height of mercury changes as pressure changes • Adjustments are required for temperature and latitude
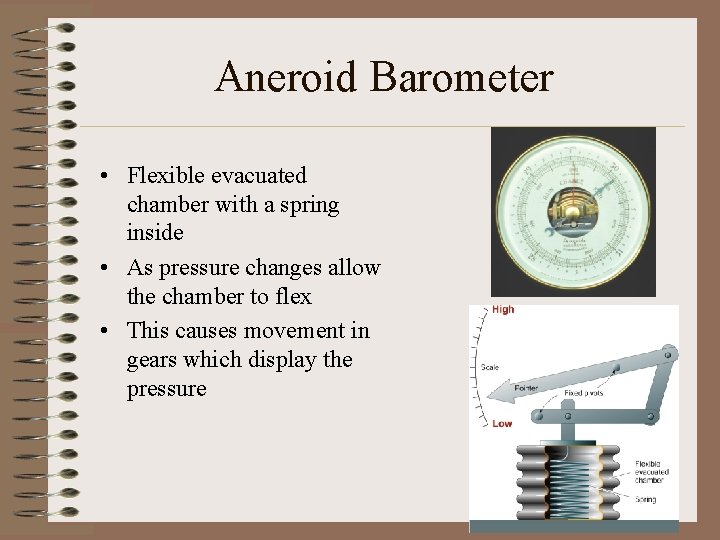
Aneroid Barometer • Flexible evacuated chamber with a spring inside • As pressure changes allow the chamber to flex • This causes movement in gears which display the pressure
Air Pressure Tendency • The change in air pressure with time – Rising: continuing fair or clearing weather – Falling: approaching inclement weather – Steady: no change • Barograph – An instrument that provides a continuous trace of air pressure with time • Altimeter – An aneroid barometer that is calibrated to measure altitude or elevation
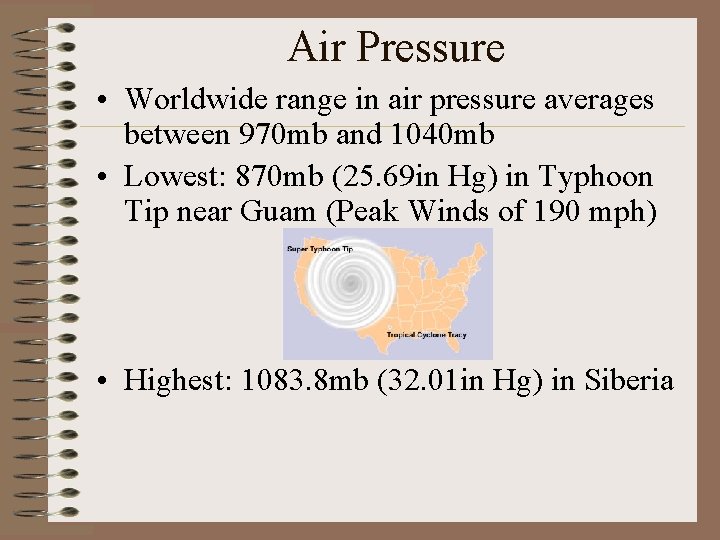
Air Pressure • Worldwide range in air pressure averages between 970 mb and 1040 mb • Lowest: 870 mb (25. 69 in Hg) in Typhoon Tip near Guam (Peak Winds of 190 mph) • Highest: 1083. 8 mb (32. 01 in Hg) in Siberia
Variations in Air Pressure With Altitude • The maximum air density is at the surface • Number density: the number of gas molecules per unit volume – Decreases with altitude • Thinning of the air with altitude is associated with decline in air pressure • 50% atmosphere’s mass below 3 miles • 99% atmosphere’s mass below 20 miles
Variations in Air Pressure With Altitude • Denver (mile high city) has an average air pressure 83% less than Boston – Altitude sickness – Lexington is about 900 feet above sea level, so actual pressure is less than “fixed” pressure • In very sparse air (thermosphere) temperature is very high, but heat transfer is low
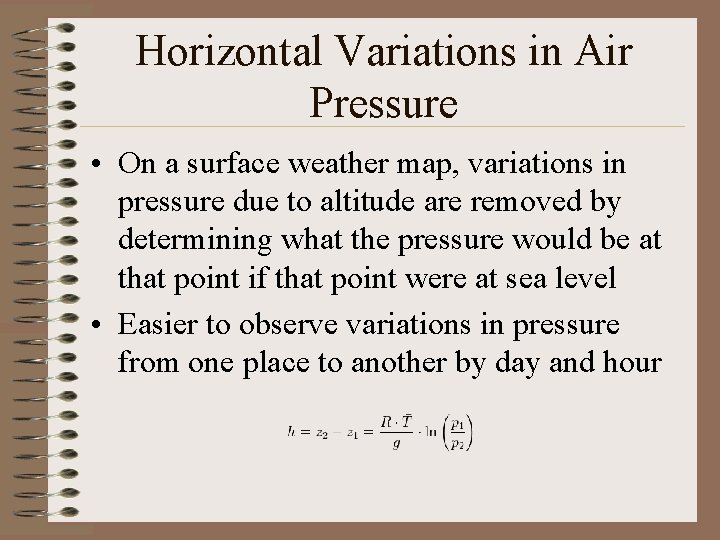
Horizontal Variations in Air Pressure • On a surface weather map, variations in pressure due to altitude are removed by determining what the pressure would be at that point if that point were at sea level • Easier to observe variations in pressure from one place to another by day and hour
Influence of Temperature and Humidity • Generally, temperature has a greater influence on density and pressure than water vapor • Air pressure drops more rapidly with altitude in cold (more dense) air than warm (less dense) air • Dry air is more dense that humid air!! • Cold, dry air masses are more dense and produce higher surface pressures than warm, humid air masses
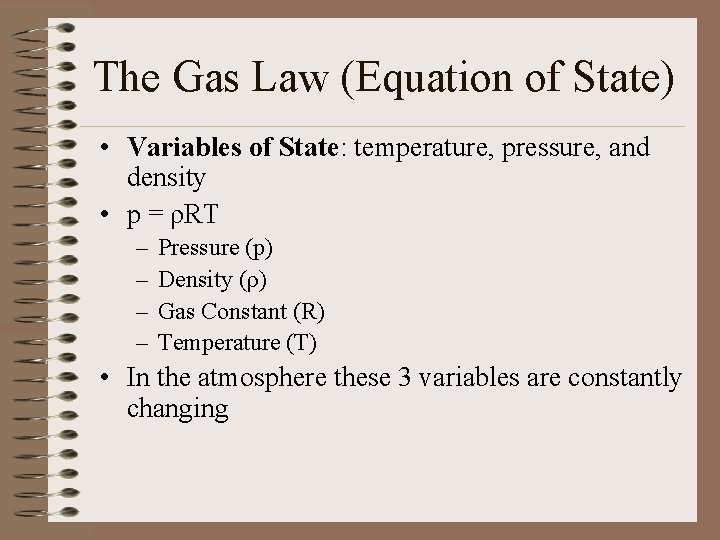
The Gas Law (Equation of State) • Variables of State: temperature, pressure, and density • p = ρRT – – Pressure (p) Density (ρ) Gas Constant (R) Temperature (T) • In the atmosphere these 3 variables are constantly changing
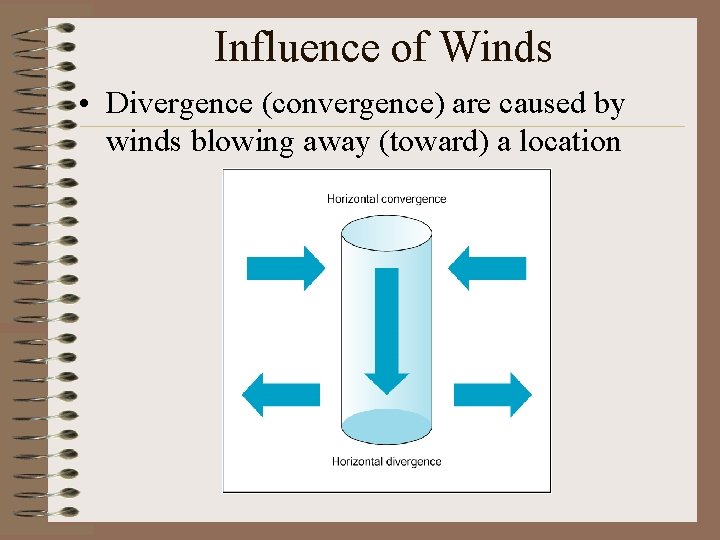
Influence of Winds • Divergence (convergence) are caused by winds blowing away (toward) a location
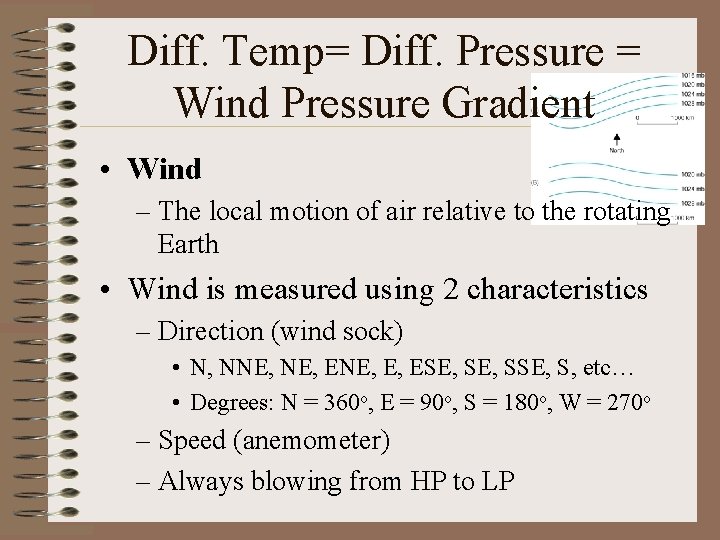
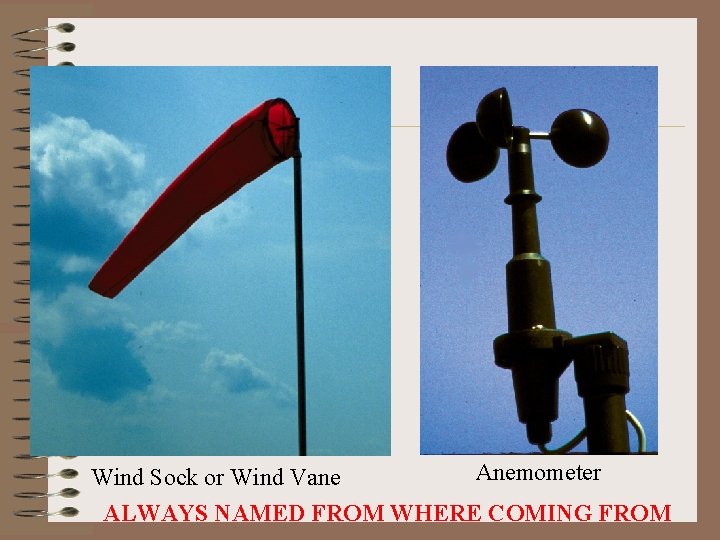
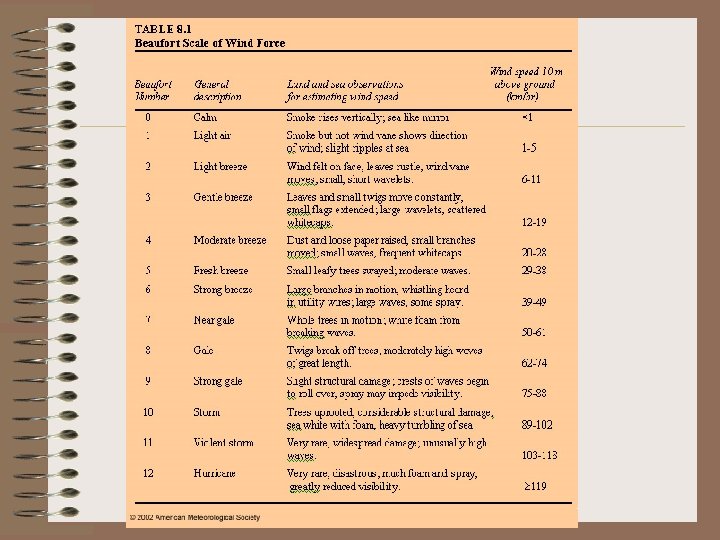
Diff. Temp= Diff. Pressure = Wind Pressure Gradient • Wind – The local motion of air relative to the rotating Earth • Wind is measured using 2 characteristics – Direction (wind sock) • N, NNE, ENE, E, ESE, SSE, S, etc… • Degrees: N = 360 o, E = 90 o, S = 180 o, W = 270 o – Speed (anemometer) – Always blowing from HP to LP
Wind Sock or Wind Vane Anemometer ALWAYS NAMED FROM WHERE COMING FROM
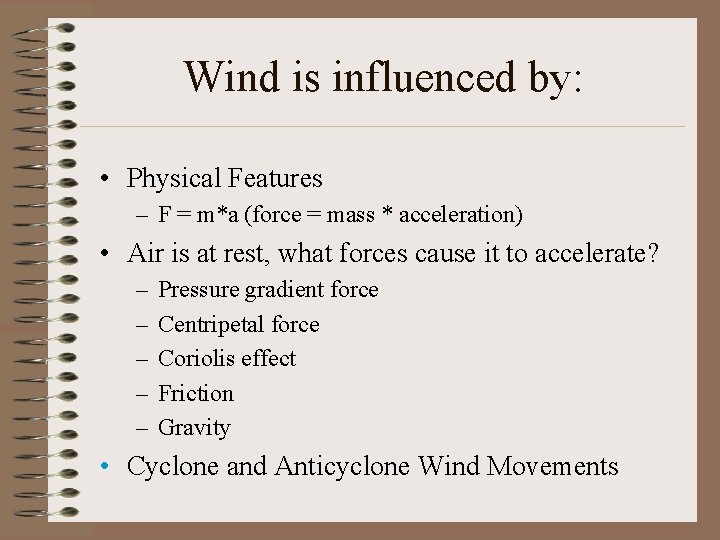
Wind is influenced by: • Physical Features – F = m*a (force = mass * acceleration) • Air is at rest, what forces cause it to accelerate? – – – Pressure gradient force Centripetal force Coriolis effect Friction Gravity • Cyclone and Anticyclone Wind Movements
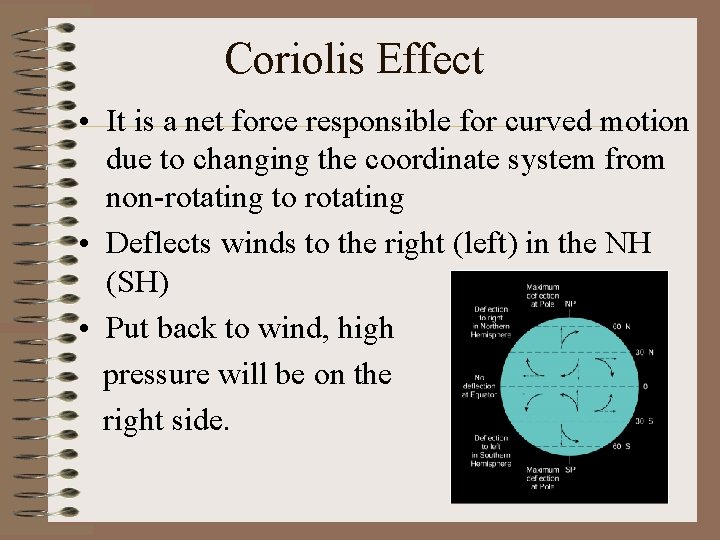
Coriolis Effect • It is a net force responsible for curved motion due to changing the coordinate system from non-rotating to rotating • Deflects winds to the right (left) in the NH (SH) • Put back to wind, high pressure will be on the right side.
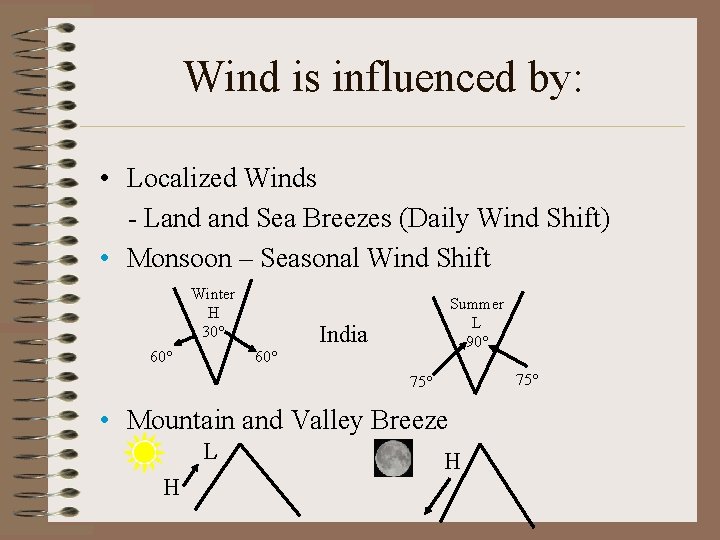
Wind is influenced by: • Localized Winds - Land Sea Breezes (Daily Wind Shift) • Monsoon – Seasonal Wind Shift Winter H 30° 60° Summer L 90° India 75° • Mountain and Valley Breeze L H H
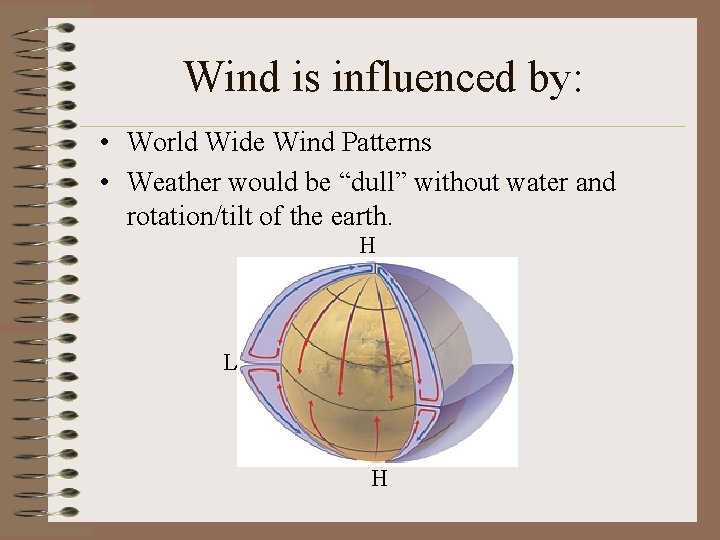
Wind is influenced by: • World Wide Wind Patterns • Weather would be “dull” without water and rotation/tilt of the earth. H L H
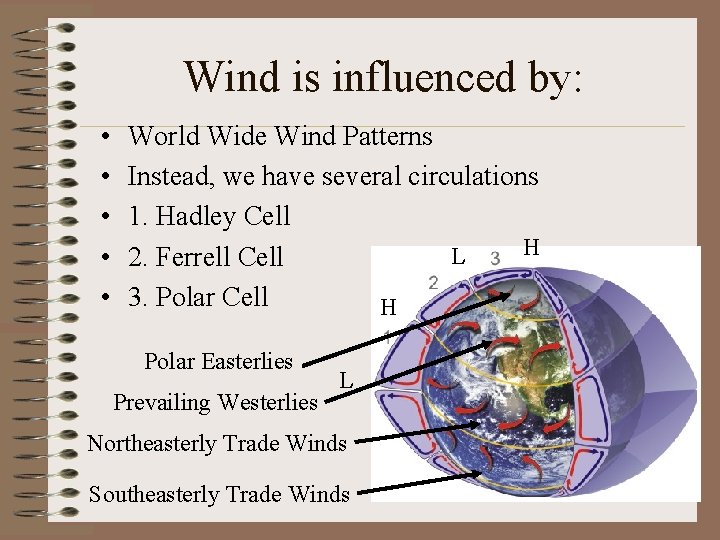
Wind is influenced by: • • • World Wide Wind Patterns Instead, we have several circulations 1. Hadley Cell H L 2. Ferrell Cell 3. Polar Cell H Polar Easterlies Prevailing Westerlies L Northeasterly Trade Winds Southeasterly Trade Winds
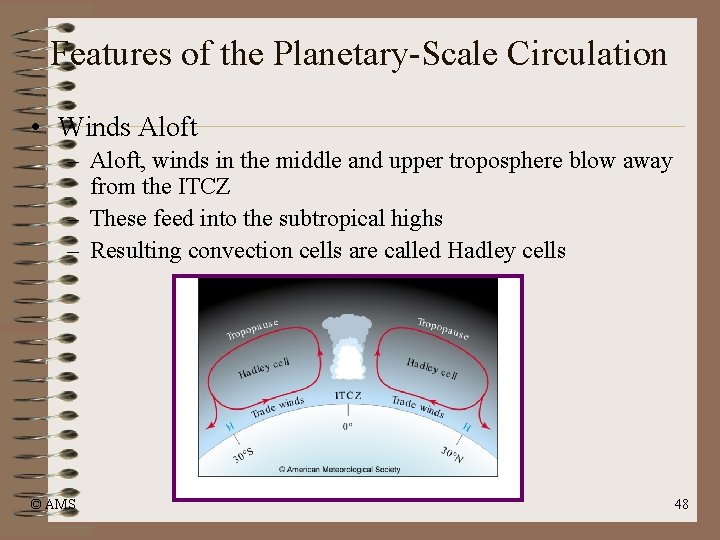
Features of the Planetary-Scale Circulation • Winds Aloft – Aloft, winds in the middle and upper troposphere blow away from the ITCZ – These feed into the subtropical highs – Resulting convection cells are called Hadley cells © AMS 48
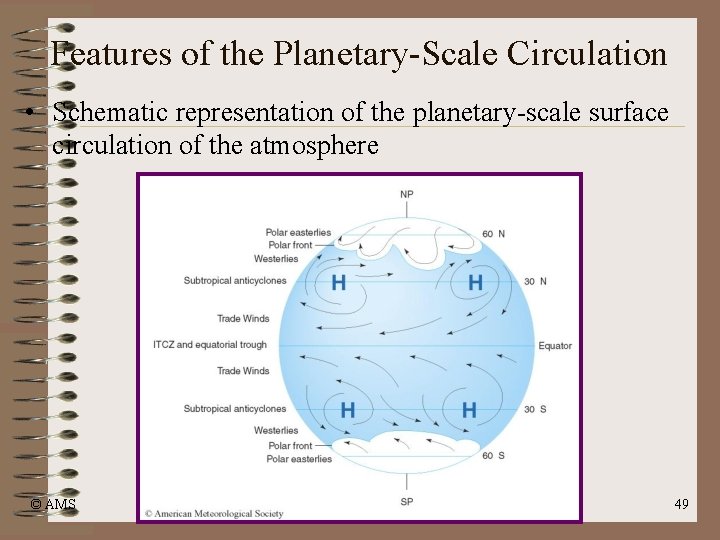
Features of the Planetary-Scale Circulation • Schematic representation of the planetary-scale surface circulation of the atmosphere © AMS 49
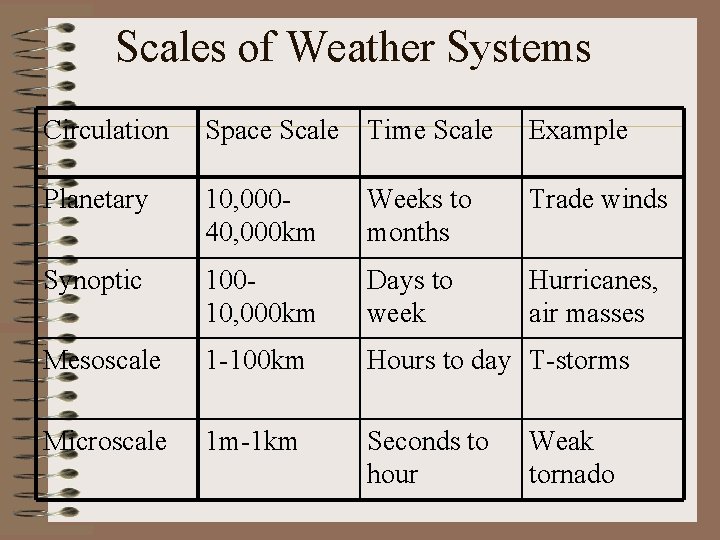
Scales of Weather Systems Circulation Space Scale Time Scale Example Planetary 10, 00040, 000 km Weeks to months Trade winds Synoptic 10010, 000 km Days to week Hurricanes, air masses Mesoscale 1 -100 km Hours to day T-storms Microscale 1 m-1 km Seconds to hour Weak tornado
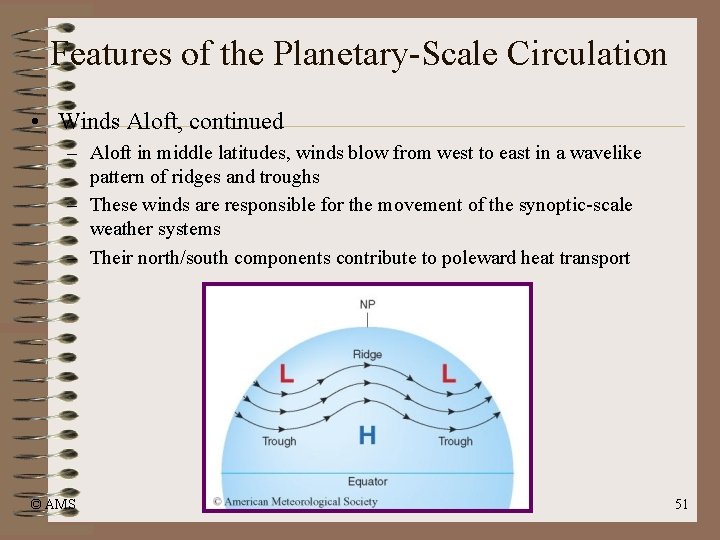
Features of the Planetary-Scale Circulation • Winds Aloft, continued – Aloft in middle latitudes, winds blow from west to east in a wavelike pattern of ridges and troughs – These winds are responsible for the movement of the synoptic-scale weather systems – Their north/south components contribute to poleward heat transport © AMS 51
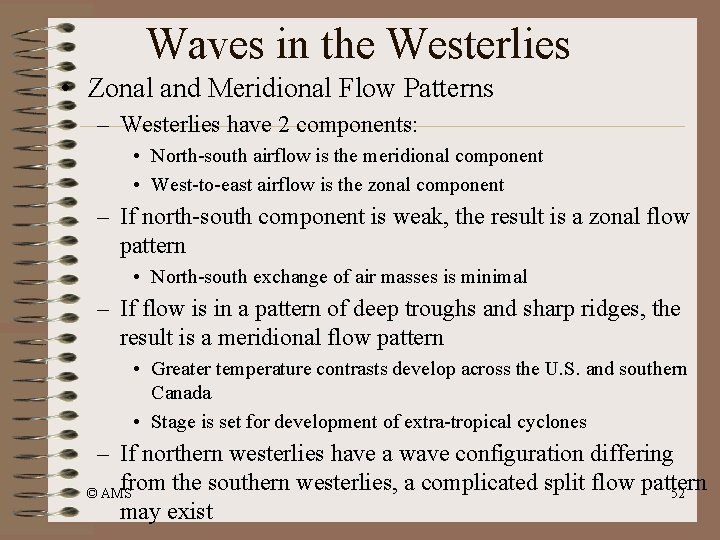
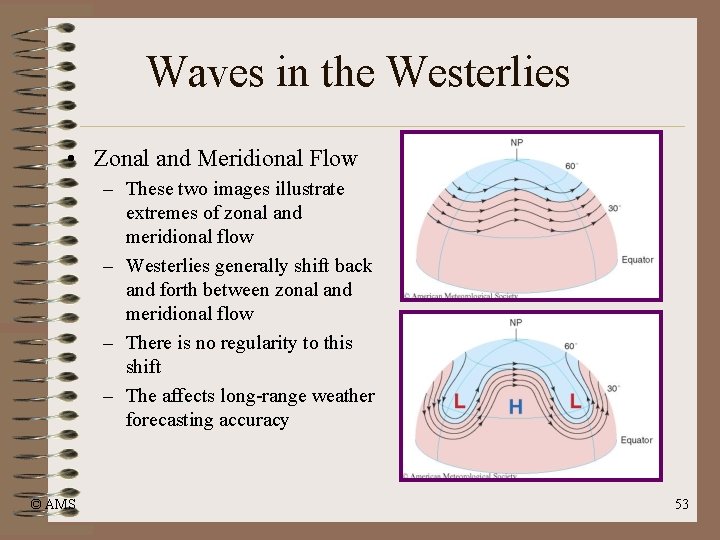
Waves in the Westerlies • Zonal and Meridional Flow Patterns – Westerlies have 2 components: • North-south airflow is the meridional component • West-to-east airflow is the zonal component – If north-south component is weak, the result is a zonal flow pattern • North-south exchange of air masses is minimal – If flow is in a pattern of deep troughs and sharp ridges, the result is a meridional flow pattern • Greater temperature contrasts develop across the U. S. and southern Canada • Stage is set for development of extra-tropical cyclones – If northern westerlies have a wave configuration differing from the southern westerlies, a complicated split flow pattern © AMS 52 may exist
Waves in the Westerlies • Zonal and Meridional Flow – These two images illustrate extremes of zonal and meridional flow – Westerlies generally shift back and forth between zonal and meridional flow – There is no regularity to this shift – The affects long-range weather forecasting accuracy © AMS 53