M North Data Mining for the Masses 2012


 33")

 35")


 Filter Examples (operator) 47")
 Filter Examples (operator) 48")
 attribute_value_filter (Parameter string) Online_Shopping=. (Click on the process to see the parameter")


 56")


 - booking. com (949 total reviews) - Trip.")

 term \"excellent Wi-fi\", \"free Wi-fi\", \"Wi-fi\"")


- Slides: 86
Ενδεικτική Βιβλιογραφία • M. North, Data Mining for the Masses, 2012, ISBN: 978 -0615684376 • This book is licensed under a Creative Commons Attribution 3. 0 License
CRISP-DM, the CRoss-Industry Standard Process for Data Mining. 3
CRISP-DM Conceptual Model Data Mining for the Masses 8
Survey & Rapid. Miner 10
Attributes Gender Race Birth_Year Marital_Status Years_on_Internet Hours_Per_Day Preferred_Browser Preferred_Search_Engine Preferred_Email, Read_News Online_Shopping Online_Gaming Facebook Twitter Other_Social_Network 11
https: //sites. google. com/site/dataminingforthemasses/ 12
The process of data scrubbing (πως θα διαχειριστούμε ανωμαλίες στα δεδομένα σύμφωνα με τις ανάγκες μας) 4εις περιπτώσεις διαχείρισης data scrubbing: 1. handling missing data 2. reducing data (observations) 3. handling inconsistent data 4. reducing attributes.
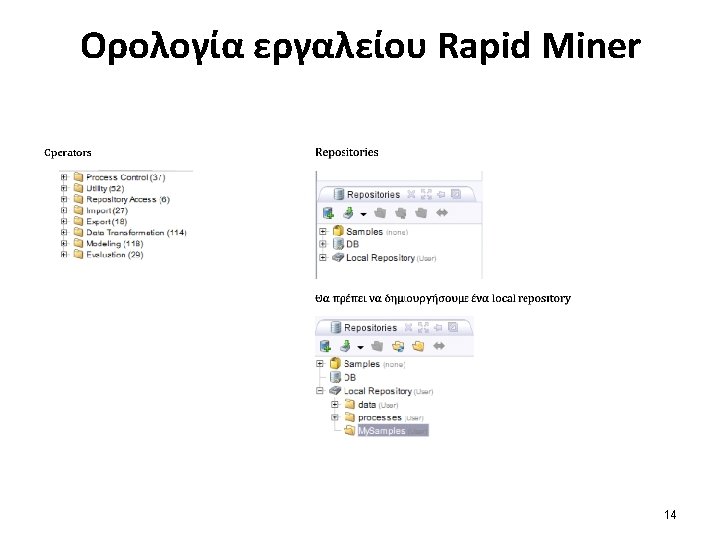
A new data mining project in Rapid. Miner The Rapid. Miner start screen 15
Import 16
Import Data Set 17
Import Data Set – Steps 5 18
How columns are separated - λάθος 19
How columns are separated 20
How columns are separated - σωστό 21
Names of the attributes 22
Data types, role 23
Where to store 24
Data View 25
Toggle between Design Perspective and Results Perspective Design Perspective 26
Design Perspective 27
Design Perspective – Drag and Drop 28
29
Drag and Drop 30
Drag and Drop 31
Results Perspective 32
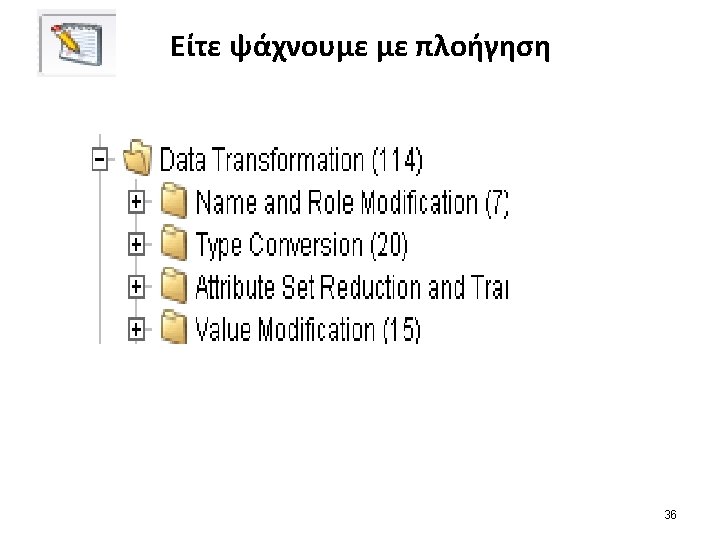
Meta Data View (basic descriptive statistics) 33
Data Type In a data set, each attribute is assigned a data type based on the kind of data stored in the attribute. There are many data types which can be generalized into one of three areas: Character (Text) based; Numeric; and Date/Time. Within these categories, Rapid. Miner has several data types. For example, in the Character area, Rapid. Miner has Polynominal, Binominal, etc. ; and in the Numeric area it has Real, Integer, etc. Binomial means one of two numbers (usually 0 and 1), so the basic underlying data type is still numeric. Binominal on the other hand, means one of two values which may be numeric or character based. (M. North, Data Mining for the Masses, 2012 34
Online_Gaming attribute (3 missing values) 35
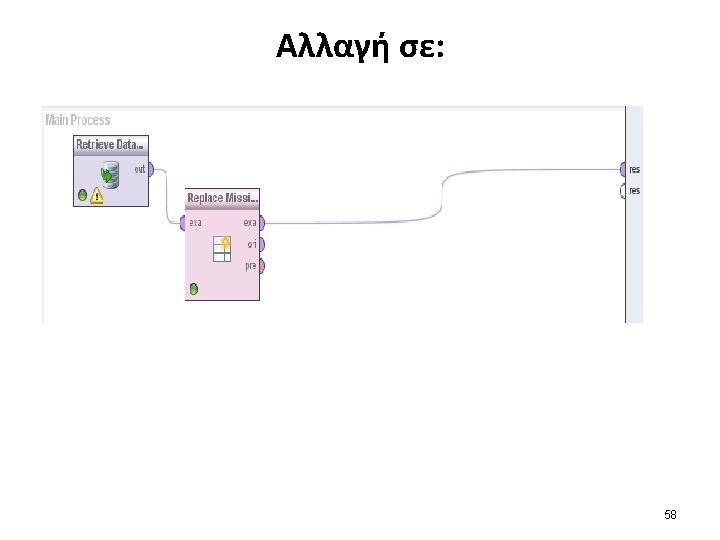
Drag and Drop – Replace Missing Values operator 38
Drag and Drop 39
Spline 40
Ports Exa port = example set (‘examples’ is the word Rapid. Miner uses for observations in a data set). result set (res) (when you run your process, you will have output). 41
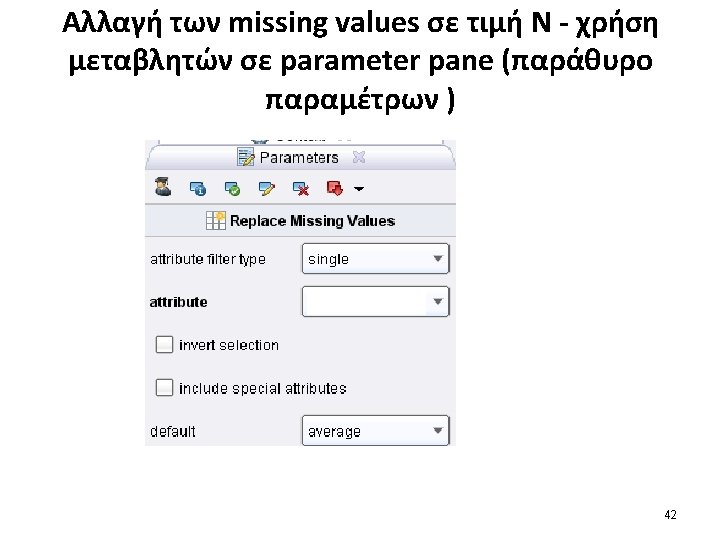
Επιλογή attribute 43
Play 44
Data View 45
Data Reduction 46
(Use the) Filter Examples (operator) 47
(Use the) Filter Examples (operator) 48
(Condition class) attribute_value_filter (Parameter string) Online_Shopping=. (Click on the process to see the parameter pane) 49
Play 50
Online_Shopping 51
Sample 52
53
Parameter pane 54
Play 55
Handling Inconsistent Data: twitter (99) 56
57
59
60
Attribute Reduction 61
62
Button 63
64
Hostal Fernando, Barcelona 66
67
68
Plaza de San Jaime http: //es. wikipedia. org/wiki/Plaza_de_San_Jaime 69
La Rambla, Barcelona http: //en. wikipedia. org/wiki/La_Rambla, _Barcelona 70
Text Mining Procedure 71
Step 1: Establishing the corpus (2014) - booking. com (949 total reviews) - Trip. Advisor (333 total reviews) - Twitter (1 review). The booking. com list was pruned to contain only reviews that contained text (i. e. reviews that just had a numeric grade and a headline were excluded). We also decided to use reviews from the past four years (2010 -2014), as older reviews may not be relevant to the state of the hotel in the present day. This left 90 reviews from booking. com, 89 from Trip. Advisor and 1 from Twitter. From these a sample of 45 reviews was obtained as follows: 1) 22 reviews from booking. com, by starting from the first review and selecting every fifth review 2) 22 reviews from Trip. Advisor divides reviews into the categories Excellent, Very good, Average, Poor, and Terrible, so a stratified sample was obtained containing 5 Excellent reviews (out of 21), 13 Very good (out of 51), 3 Average (out of 11), 1 Poor (out of 4), and 0 Terrible (out of 2). Within each stratum the reviews were selected as in the booking. com sample (every n-th review) 3) 1 review from Twitter 72
Step 2: Creating the Term-Document Matrix An Excel spreadsheet was created, with columns representing terms and rows representing each document (review). In places where a phrase was more important than a plain word, the phrase was used as a term (for example "good value for money" instead of "good", "value", and "money"). Synonymous phrases were stored as one term (for example "good location", "great location" and "liked location" became "liked location, good location"). 91 terms-phrases were recorded. Afterwards we did a further reduction of the data, by further replacing synonyms 73
Replacement of synonymous terms Initial terms Final (replacement) term "excellent Wi-fi", "free Wi-fi", "Wi-fi" "no Wi-fi", "disconnecting Wi-fi" "bad Wi-fi" "shower pressure low", "shower needs replacing" "shower problems" "substandard breakfast", "bad breakfast" "church bells", "noisy street", "noisy common area", "water pipe noise" "noise" 74
Replacement of synonymous terms This was done in order to not only reduce the number of terms, but also to increase the frequency of some rare terms in the total amount of documents so that they would be more meaningful (for example "shower pressure low" and "shower needs replacing" appeared in only 1 document each, but when replaced with the same synonym it appears in 2 documents). This left a final 83 terms. 75
Step 3: Extracting the knowledge -The terms were sorted by frequency, i. e. how many documents they appeared in. - A histogram was created with the 35 most common terms. -Afterwards, the terms were divided into positive and negative terms and again sorted by frequency. - Histograms were created for the top 30 positive and all (21) negative terms. - Rapid. Miner can be used to find potential associations among the data. - Various algorithms could be used for this. - Examples of data sets for experimentation: 1) one containing all the data (documents and terms) 2) one containing all the documents but only the negative terms 3) one containing all the terms but only the documents that contained negative terms. 76
Sample - Example 77
78
79
80
Example of Business model 81