M North Data Mining for the Masses 2012


 • Sonia’s goal is to")


 24")


- Slides: 36
Ενδεικτική Βιβλιογραφία • M. North, Data Mining for the Masses, 2012, ISBN: 978 -0615684376 • This book is licensed under a Creative Commons Attribution 3. 0 License
CRISP-DM Conceptual Model Data Mining for the Masses 3
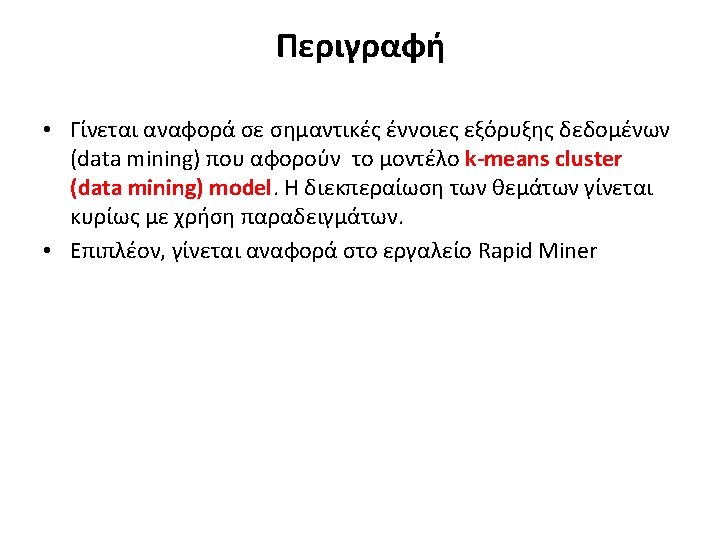
παράδειγμα: k-means cluster data mining model (χρήση Rapid. Miner) • Sonia’s goal is to identify and then try to reach out to individuals insured by her employer who are at high risk for coronary heart disease because of their weight and/or high cholesterol. She understands that those at low risk, that is, those with low weight and cholesterol, are unlikely to participate in the programs she will offer. She also understands that there are probably policy holders with high weight and low cholesterol, those with high weight and high cholesterol, and those with low weight and high cholesterol. She further recognizes there are likely to be a lot of people somewhere in between. In order to accomplish her goal, she needs to search among the thousands of policy holders to find groups of people with similar characteristics and craft programs and communications that will be relevant and appealing to people in these different groups. • (M. North, Data Mining for the Masses, 2012 Διασκευή παραδείγματος κεφαλαίου 6) 4
https: //sites. google. com/site/dataminingforthemasses/ Weight, Cholesterol, Gender 102, 111, 1 115, 135, 1 115, 136, 1 140, 167, 0 130, 158, 1 198, 227, 1 114, 131, 1 145, 176, 0 191, 223, 0 5
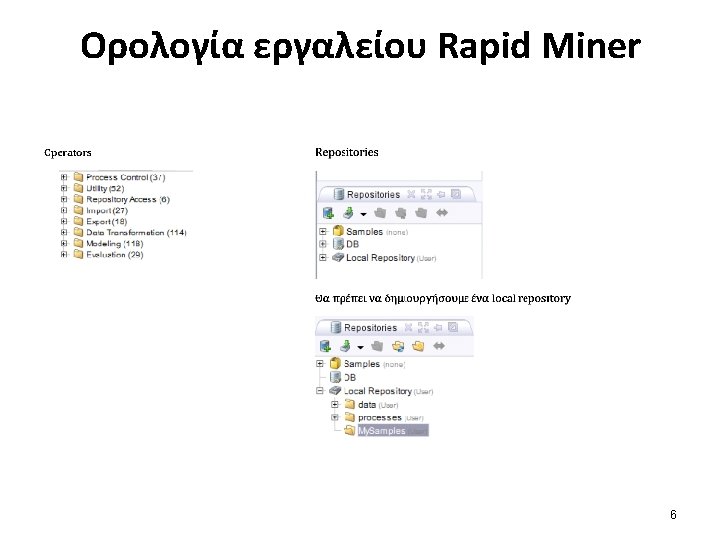
A new data mining project in Rapid. Miner The Rapid. Miner start screen 7
Import Data Set 8
Import Data Set 9
Names of the attributes 10
Where to store 11
Data View 12
Meta Data View 13
Toggle between Design Perspective and Results Perspective Design Perspective 14
Design Perspective 15
Play 16
modeling The ‘k’ in k-means clustering stands for some number of groups, or clusters. The aim of this data mining methodology is to look at each observation’s individual attribute values and compare them to the means, or in other words averages, of potential groups of other observations in order to find natural groups that are similar to one another. The k-means algorithm accomplishes this by sampling some set of observations in the data set, calculating the averages, or means, for each attribute for the observations in that sample, and then comparing the other attributes in the data set to that sample’s means. The system does this repetitively in order to ‘circle-in’ on the best matches and then to formulate groups of observations which become the clusters. As the means calculated become more and more similar, clusters are formed, and each observation whose attributes values are most like the means of a cluster 17 become members of that cluster.
K-means operators 18
model 19
Parameter pane: 2 clusters, max runs 10 20
Initial report 21
Parameter pane: 4 clusters, max runs 10 22
4 clusters 23
Centroid table (“cluster 0 is where Sonia will likely focus her early efforts”) 24
Folder view
cluster_0 26
details 27
Filter 28
Filter Examples 29
Parameters 30
Data view: Filtered results for cluster 0 observations 31