Gene expression studies of cancer gene transcription signatures


 make thousands")
 terms • The Gene Ontology project provides a")
 • From the Broad Institute")


 • Number of genes in total population: G")
 • • • Number of genes in total")
? • Can represent the number of genes")


 enrichment analysis All the genes in the dataset are used here Subramanian,")

 is")
 enrichment analysis Subramanian, Aravind et al. (2005) Proc. Natl. Acad. Sci. USA")
 enrichment analysis Subramanian, Aravind et al. (2005) Proc. Natl. Acad. Sci. USA")


")
 • Q 1: Compare enrichment")


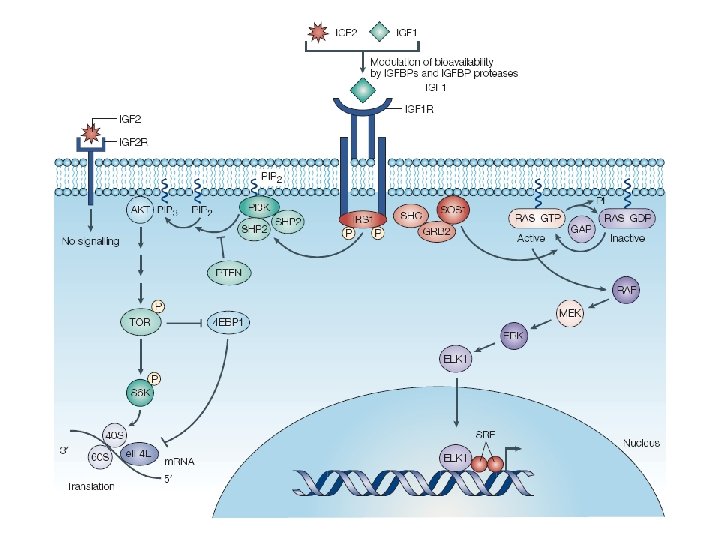
 • Substantial evidence implicates insulin-like")

")


 gene signature in fibroblasts •")


 • Array 1 is the")
 • Number 1, number 2, . .")

 • Lookup_value is the value you use to")

")


- Slides: 112
Gene expression studies of cancer: gene transcription signatures Chad Creighton February 2009
Oncogenic signaling pathways in cancer Mutation/deregulation of a handful of genes can make cells into cancer cells. Hanahan and Weinberg. Cell. 2000 100: 57 -70
Widespread deregulation of gene expression in cancer • Gene expression profiling distinguishes prostate cancer from normal prostate and from BPH. Dhanasekaran et al. Nature. 2001 Aug 23; 412(6849): 822 -6.
Widespread deregulation of gene expression in cancer • Gene expression profiling identifies different subtypes of breast cancer. Sorlie et al. PNAS. 2003 100(14): 8418 -23
A gene-expression signature as a predictor of survival in breast cancer www. agendia. com Van de Vijver et al. NEJM 2002 347(25): 1999 -2009.
Oncogenic pathway signatures in human cancers as a guide to targeted therapies Bild et al. Nature. 2006 439(7074): 353 -7. • Use oncogenic signatures to predict response of cell lines to targeted therapy.
Oncogenic signatures of ERBB 2, EGFR, MEK RAF, and MAPK in breast cancer cells Creighton et al. Cancer Res. 2006 66(7): 3903 -11.
Preliminary gene expression profiling studies of cancer • Hundreds of genes are deregulated in cancer. • Different subtypes of cancer are defined by gene expression profiling. • Gene expression signatures may predict cancer patient survival. • Gene expression signatures of oncogenic signaling pathways can be defined using experimental models (cell lines, mice).
Potential uses for gene expression profiling of cancer • Define and understand the molecular pathways that underlie cancer. • Define subgroups of patients for the purposes of optimizing treatment. – Determine whether or not a patient would benefit from a given therapy (e. g. chemotherapy). – Determine what specific pathways are deregulated in the tumor and treat the tumor with therapies that target that pathway (e. g. hormone therapy for ER+ breast cancer).
General concepts of gene expression analysis • Low level analysis – Processing image files – Normalization – Quality Control (QC) • High level analysis – Clustering – Selecting differentially expressed genes – Enrichment analysis or “Meta-analysis”
Publicly available gene expression profile data represents a rich resource • When publishing studies using gene expression profile data, authors are encouraged to make the data available to everyone. • Subsequent studies can re-analyze the data with different questions in mind from what the original authors had.
• GEO database (http: //www. nc bi. nlm. nih. gov/ geo/) make thousands of expression profile datasets publicly available. • Many top journals require microarray studies to make data public on GEO
Pathway-related gene sets: Gene Ontology (GO) terms • The Gene Ontology project provides a controlled vocabulary to describe gene attributes. • Three major categories: – Cellular component – Biological process – Molecular function • The controlled vocabularies are structured so that they can be queried at different levels: – For example, use GO to find all gene products involved in ‘signal transduction’, or zoom in on all ‘receptor tyrosine kinases’. www. geneontology. org
Pathway-related gene sets: Molecular Signature Database (m. Sig. DB) • From the Broad Institute • Collection of gene sets curated from the literature (including gene expression profiling studies). • Current version represents over 1800 pathway-associated genes sets http: //www. broad. mit. edu/gsea/msigdb/index. jsp
Gene “signatures” • Will be loosely defined here to mean a set of genes that are functionally associated with each other in some way. • Ways to define gene signatures: – Gene annotation (e. g. Gene Ontology terms) – Curated pathway-associated gene sets – Literature review articles – “Gene expression signature”, gene signature defined using expression profiling data • e. g. what genes go up or down in response to treatment in an experimental model)
Gene expression signatures • When using expression profiling to define genes, a gene expression signature consists of two things: – A set of genes going “up” (relative to something). – A set of genes going “down” (relative to something). • Relative direction of the genes (up-regulated vs down-regulated, or over-expressed vs underexpressed) is important. • Keep the “up” genes separated from the “down” genes.
How do we relate gene expression profile results from different datasets to each other?
The enrichment problem • A: Given a gene set or sets of interest. – i. e. a “gene signature” • B: Given an independent expression dataset with the profiled genes being ranked by a specified metric. – e. g. “cancer vs. normal” or “correlation with MYC. ” • Are the genes in (A) enriched within (B)? – i. e. do the results of (A) and (B) overlap significantly?
Methods for determining enrichment • Venn diagram, or “marble jar” approach – Take the top set of genes from the expression dataset (dataset B), tabulate the amount of overlap with the independent gene set of interest (dataset A). • Rank-based approach – Use the entire dataset, including genes of borderline significance or showing a weak trend towards significance. • Correlation approach – For a set of genes, compute correlation between two sets of weighting factors (based on different profiling datasets).
Venn diagram enrichment analysis • Requires us to make a “cut” to define what the top genes are. • Significance of overlap may be determined by chi -square or one-sided Fisher’s exact tests.
Venn diagram enrichment analysis Define gene set of interest • Requires us to make a “cut” to define what the top genes are. • Significance of overlap may be determined by chi -square or one-sided Fisher’s exact tests.
Venn diagram enrichment analysis Define differentially expressed genes • Requires us to make a “cut” to define what the top genes are. • Significance of overlap may be determined by chi -square or one-sided Fisher’s exact tests.
Venn diagram enrichment analysis Determine overlap between the two gene sets • Requires us to make a “cut” to define what the top genes are. • Significance of overlap may be determined by chi -square or one-sided Fisher’s exact tests.
Hypergeometric formula (one-sided Fisher’s exact test) • Number of genes in total population: G • Genes in G falling under pre-defined class: A • Number of genes selected: k • Number of selected genes k in class A: n • The number of genes expected to overlap by chance: (k X A)/G • One-sided Fisher’s exact test determines whether n is significantly greater than (k. XA)/G
Hypergeometric formula (one-sided Fisher’s exact test) • • • Number of genes in total population: G Genes in G falling under pre-defined class: A Number of genes selected: k Number of selected genes k in class A: n The probability P for the term occurring n or more times within a set of k genes randomly selected from the population:
What is the total gene population (G)? • Can represent the number of genes profiled on the array chip. • What if two different array platforms were used (a different set of genes are typically represented in each)? – Use the common set of genes represented on both array chips as the total population (do not consider genes not represented on both arrays) – Use ONE of the two array platforms to define the gene population (do not consider genes on the other array platform that are not represented on the first platform)
A gene signature of mutation of EGFR in NSCLC cell lines • Compared lung cancer cell lines with or without an activating mutation in EGFR. • Wanted to compare this gene signature with another gene signature of EGFR Lung cancer cell lines Choi, Creighton, et al. , PLo. S ONE 2(11): e 1226.
Oncogenic signatures of ERBB 2, EGFR, MEK RAF, and MAPK in breast cancer cells • Does the published MCF-7+EGFR signature overlap with the NSCLC EGFR signature? Creighton et al. Cancer Res. 2006 66(7): 3903 -11.
Compare NSCLC EGFR mutant signature with a signature of EGFRtransfected MCF-7 cells significance of One-sided Fisher’s exact test overlap p<1 E-10 • EGFR wt NSCLC genes: 119 • MCF 7 EGFR genes: 1152 • Genes shared between MCF 7/NSCLC array platforms: 11079 • Genes shared between MCF 7/NSCLC gene signatures: 44 Choi, Creighton, et al. , PLo. S ONE 2(11): e 1226.
A gene signature of mutation of EGFR in NSCLC cell lines is enriched with EGFR-depended genes. Choi, Creighton, et al. , PLo. S ONE 2(11): e 1226.
Experimental models versus clinical tumors • Molecular data from experimental models represent dynamic information, but clinical relevance is not always clear (e. g. could represent experimental artifacts). • Data from clinical tumor specimens represent more static information, where the associations observed may be pathologically relevant.
Experimental models versus clinical tumors • From clinical data, cannot distinguish cause-and-effect associations from correlation alone. • In cancer studies, important to combine the experimental with the clinical. – Some researchers may doubt the validity of experimental results unless they can be shown to apply to human tissues
Ranked-based enrichment analysis Rank ordered genes from dataset A Locations of genes from set B • Rank-based approaches use all of the genes from one of the datasets to determine enrichment (does not make a “cut”).
GSEA (rank-based) enrichment analysis All the genes in the dataset are used here Subramanian, Aravind et al. (2005) Proc. Natl. Acad. Sci. USA 102, 15545 -15550 • Start from the top of the Ranked list. • Add points to “Random walk” for each gene you find in S. • Remove points from “Random walk” for each gene not in S.
GSEA Kolmogorov-Smirnov statistic Consider the genes R 1, . . , RN that are ordered on the basis of the difference metric between the two classes and a gene set S containing G members. We define if Ri is not a member of S, or if Ri is a member of S. We then compute a running sum across all N genes. The ES is defined as or the maximum observed positive deviation of the running sum.
GSEA Kolmogorov-Smirnov statistic • The ES score (the “peak” of the Random walk) is just a number. • Need to evaluate the significance of the number by some type of permutation testing: – Permute the sample labels many times, OR – Permute the gene sets (i. e. randomly generate gene sets). • In either case, compare distribution of scores from random tests with the actual score.
GSEA (rank-based) enrichment analysis Subramanian, Aravind et al. (2005) Proc. Natl. Acad. Sci. USA 102, 15545 -15550 Examples of GSEA running enrichment scores
GSEA (rank-based) enrichment analysis Subramanian, Aravind et al. (2005) Proc. Natl. Acad. Sci. USA 102, 15545 -15550 Sets with genes not located at the top of the ranked gene population may still yield significant enrichment scores.
A mechanism of cyclin D 1 action encoded in the patterns of gene expression in human cancer Lamb, et al. Cell 114: 323 -34, 2003
The Connectivity Map of gene signatures induced by 164 different small molecule inhibitors Lamb et al. , Science. 2006 313(5795): 1929 -35
The Connectivity Map (Scoring derived from GSEA statistic)
Q 1 -Q 2 analysis (another ranked based approach) • Q 1: Compare enrichment pattern to that for randomly select gene sets • Q 2: Compare enrichment pattern to that for randomly permuted labels in the reference profile dataset Tian, et al. PNAS 102: 13544 -13549, 2003
A gene expression signature of Akt overexpression from a transgenic mouse model Majumder et al. Nat Med 10: 594– 601, 2004
Creighton CJ, Oncogene. 2007 26: 4648 -55
Venn diagram vs Rank-based methods • Venn diagram results more easily interpretable. • For rank-based methods, genes that are not at all significant individually may contribute to enrichment. – What gene do you go after for validation? • With venn diagram, have to make a cut. – May not include enough genes in the test.
Venn diagram vs Rank-based methods
Venn diagram vs Rank-based methods, what is a significant p-value? • If using the Venn diagram method in expression studies, p-value should be very low if working with sizable gene sets (e. g. <1 E-6). • If using rank-based method, can consider a nominally significant p-value (e. g. p<0. 05) to be good if permuting the sample labels is involved. • Can always try both ways in order to be certain of an enrichment association.
Rank-based: Q 1 -Q 2 versus GSEA • Q 1 -Q 2 enrichment score is much simpler – Take the sum of the t-statistic values for each gene in the set. – GSEA scoring is more complicated. • GSEA has user-friendly public software (http: //www. broad. mit. edu/gsea/) – No software yet for Q 1 -Q 2, have to write your own.
Correlation-based approach • Take the correlation between two sets of profiling results from different datasets. • May use all of the genes profiled or a specified subset (e. g. genes in a gene signature). • The correlation metric may be any one of a number of valid metrics (e. g. Pearson’s or Spearman’s rank).
Correlation-based approach • Each gene used in the correlation may be “weighted” in a number of ways – t-statistic, comparing two groups – Mean-centered expression values – “+1” or “-1” for “up” or “down, ” respectively • Again, direction of the genes is important – Positive correlation indicates similar overall patterns between the two datasets. • Example: IGF “activation score” from Creighton et al. , JCO 2008.
Example analyses comparing gene transcription signatures from different studies
Gene expression signatures of oncogenic pathways from published studies Includes: • MYC • erb. B-2 • E 2 F 3 • c-Src • MEK • androgen • beta-catenin • EGFR • estrogen • Cell cycle • Raf • Ras • cyclin D 1 • MAPK • Akt
Multiple public gene expression profile datasets of prostate tumors
Experimentally-derived oncogenic signatures in human prostate cancer • Are there patterns of interest shared between the oncogenic signatures and the prostate tumors? • Examine gene that are high/low with oncogene expression in the human tumors. – Is the corresponding oncogenic signature enriched in those tumors. • Use both Q 1 -Q 2 (rank based) and one-sided Fisher’s exact (“Venn diagram”) methods
A mechanism of cyclin D 1 action encoded in the patterns of gene expression in human cancer Lamb, et al. Cell 114: 323 -34, 2003 Use same idea from Lamb et al. , only look at multiple signatures in multiple prostate tumor datasets
Genes up-regulated by a specific oncogene in experimental models are co-expressed as a group with the oncogene in clinical prostate tumors Enrichment results using Q 1 -Q 2 rank-based method
Number of genes overlapping between oncogenic signatures and clinical tumor correlates. Oncogenic signature Prostate Signature tumor Expected genes* genes overlap Actual overlap Pvalue*** androgen_up_Chen 559 176 7 29 1. 2 E-11 Myc_up_Bild 993 150 10 33 5. 5 E-10 Src_up_Bild 1566 118 12 23 0. 002 erb. B-2_up_Creighton 1315 307 27 91 1. 1 E-26 EGFR_up_Creighton 734 28 1 1 0. 75 cyclin_D 1_up_Lamb 206 139 2 8 0. 0006 Akt_up_Majumder 770 280 14 47 3. 8 E-13 *Number of genes positively correlated with corresponding oncogene/biomarker in human prostate tumors (Criterion: p<0. 05 in at least three out of four profile datasets). ***By one-sided Fisher's exact test.
A gene signature of Insulin-like growth factor I (IGF-I) • Substantial evidence implicates insulin-like growth factor I (IGF-I) signaling in the development and progression of breast cancer. • Gene expression profiling of IGF-I-stimulated MCF-7 cells was performed. • An IGF-I gene signature was examined in human breast tumors, as well as in experimental models for specific oncogenic signaling pathways. Creighton CJ, et al. , Lee AV. JCO. 26: 4078 -85.
Genes altered by IGF-I at 3 hr or 24 hr or both
A gene signature of Insulin-like growth factor I (IGF-I)
Oncogenic pathway signatures in human cancers as a guide to targeted therapies Bild et al. Nature. 2006 439(7074): 353 -7. • Examine previously published dataset for oncogenic signatures overlapping with IGF signature
The IGF is enriched for transcriptional targets of the Ras pathway
The Connectivity Map of gene signatures induced by 164 different small molecule inhibitors Lamb et al. , Science. 2006 313(5795): 1929 -35
The IGF is enriched for transcriptional targets of the PI 3 K/Akt/m. TOR pathway
IGF signature is present in human breast cancers
Widespread deregulation of gene expression in cancer • Gene expression profiling identifies different subtypes of breast cancer. Sorlie et al. PNAS. 2003 100(14): 8418 -23
IGF signature is present in luminal B and basal breast tumors Data from Sorlie et al. PNAS. 2003 100(14): 8418 -23
IGF signature is associated with poor prognosis in ER+ breast tumors
Relating gene expression profile results from different datasets to each other by unsupervised clustering methods: USUALLY NOT A GOOD IDEA • Unsupervised clustering is a technique for data analysis that partitioning a data set into subsets whose elements share common traits • Many groups will try to relate a gene signature to another dataset by clustering the samples in the dataset using the genes in the signature • The main problem with this: Unsupervised clustering does not take the direction of the genes in the signature into account.
• Identification of a Common Serum Response (CSR) gene signature in fibroblasts • Starve fibroblasts, then give them serum and see what genes are up-regulated or down-regulated. Chang et al. , PLo. S Biol. 2004 Feb; 2(2): E 7
Survey of fibroblast CSR gene expression in human cancers • Using the genes in the CSR signature, cluster human tumors. • Tumor form two major groups. Chang et al. , PLo. S Biol. 2004 Feb; 2(2): E 7
Prognostic value of fibroblast CSR in epithelial tumors • Tumors in the “activated” group had worse outcome. Chang et al. , PLo. S Biol. 2004
What issues are these with this type of analysis approach? • The clustering method does not tell us which direction the CSR gene are moving. • Are genes up in the CSR signature also up in the “Activated” tumor set?
What issues are these with this type of analysis approach? • These bars indicate the direction of the CSR genes in these clusters (red=up) • CSR pattern does appear here to be manifested in half the tumors.
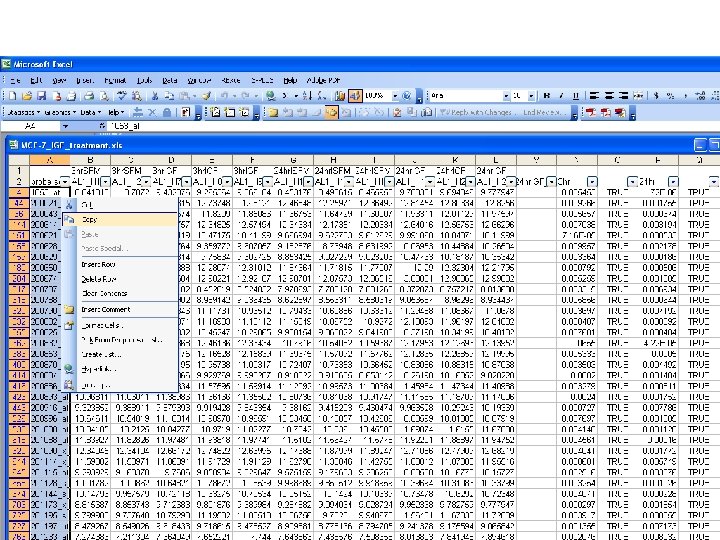
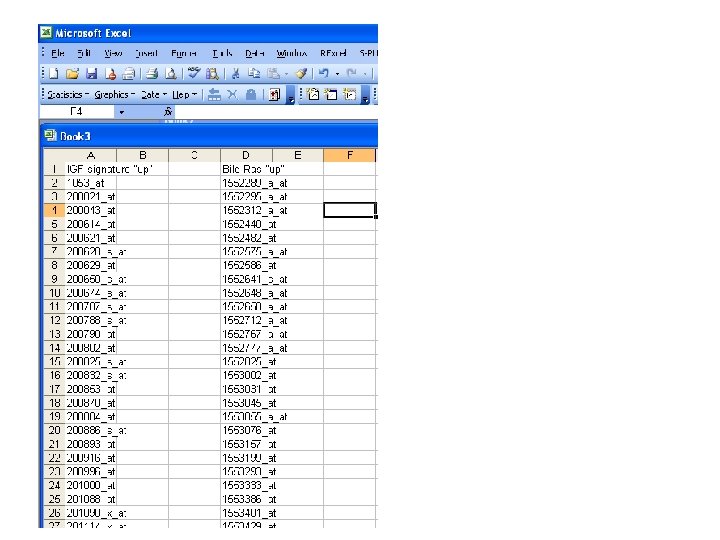
Excel functions/features you will need for the computational exercise
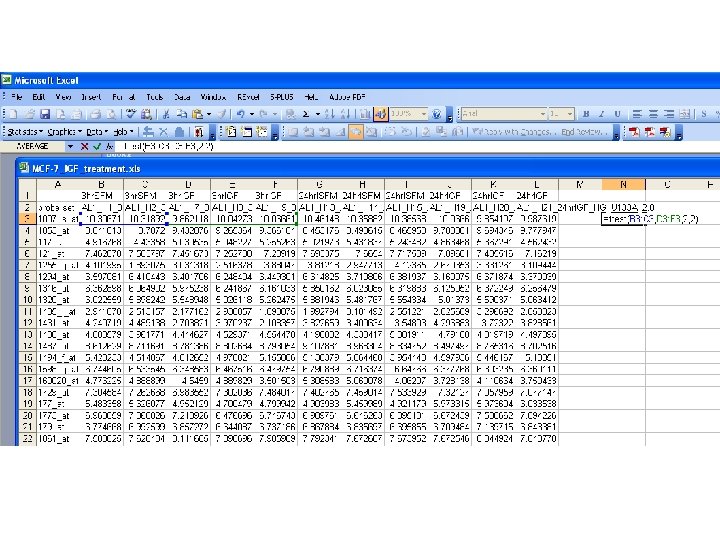
TTEST Worksheet function TTEST(array 1, array 2, tails, type) • Array 1 is the first data set. • Array 2 is the second data set. • Tails specifies the number of distribution tails (Use “ 2” for the computational exercise. ) • Type is the kind of t-Test to perform (Use “ 2”).
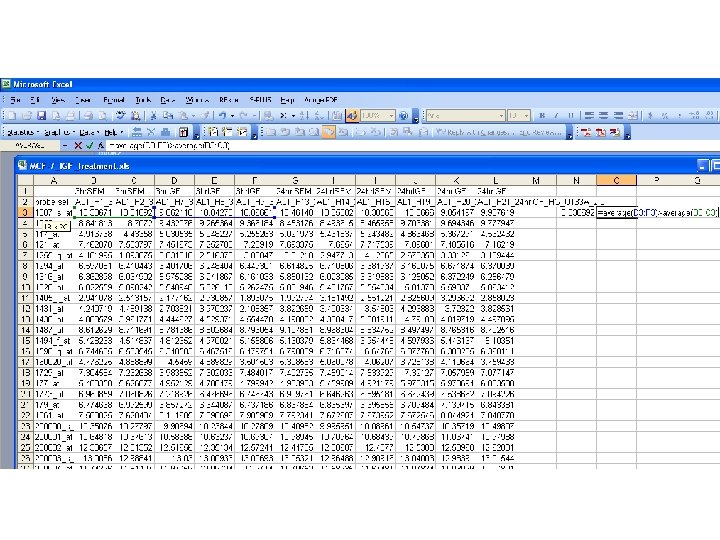
AVERAGE Worksheet function AVERAGE(number 1, number 2) • Number 1, number 2, . . . are 1 to 30 numeric arguments for which you want the average. • The arguments must either be numbers or be names, arrays, or references that contain numbers.
Data->Filter->Auto. Filter 1. Unfiltered range 2. Filtered range • When you use the Auto. Filter command, Auto. Filter arrows appear to the right of the column labels in the filtered range. • Microsoft Excel indicates the filtered items with blue. • You use custom Auto. Filter to display rows that meet complex criteria; for example, you might display rows that contain values within a specific range (e. g. p<0. 01)
MATCH Worksheet function MATCH(lookup_value, lookup_array, match_type) • Lookup_value is the value you use to find the value you want in a table. – Lookup_value is the value you want to match in lookup_array. For example, when you look up someone's number in a telephone book, you are using the person's name as the lookup value, but the telephone number is the value you want. – Lookup_value can be a value (number, text, or logical value) or a cell reference to a number, text, or logical value. • Lookup_array is a contiguous range of cells containing possible lookup values. Lookup_array must be an array or an array reference. • Match_type should be set to 0 for our purposes.
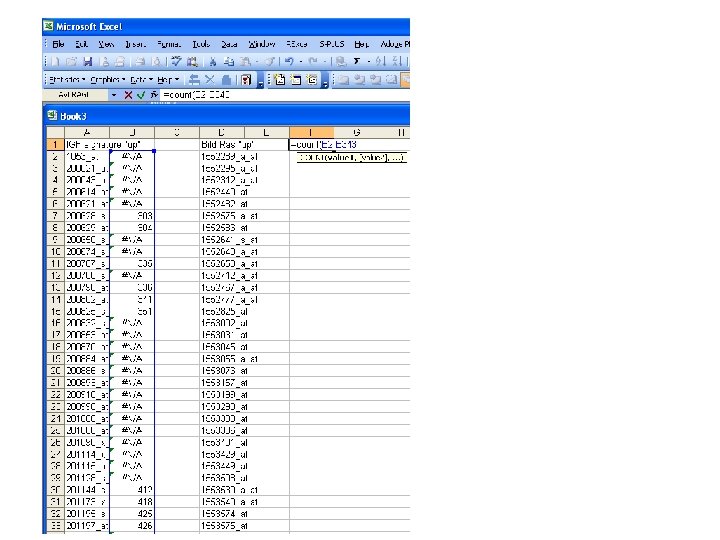
COUNT Worksheet function • If an argument is an array or reference, only numbers in that array or reference are counted. Empty cells, logical values, text, or error values in the array or reference are ignored.
(Don’t forget the $)
R functions you will need for the computational exercise
dhyper function in R • Example: – 100 balls – 10 of the balls are red – I grab 20 balls – Five of my 20 balls are red • Was the number of red balls I selected a significant number ? > m<-10 #number of red balls > n<-90 #number of other balls (total pop-m) > k<-20 #number of balls selected > x<-0: k #vector of successes > 1 -sum(dhyper(x, m, n, k)[1: 5]) [1] 0. 02546455
Compare NSCLC EGFR mutant signature with a signature of EGFRtransfected MCF-7 cells significance of One-sided Fisher’s exact test overlap p<1 E-10 • EGFR wt NSCLC genes: 119 • MCF 7 EGFR genes: 1152 • Genes shared between MCF 7/NSCLC array platforms: 11079 • Genes shared between MCF 7/NSCLC gene signatures: 44 Choi, Creighton, et al. , PLo. S ONE 2(11): e 1226.
dhyper function in R • EGFR mutant signature example: – 11079 Genes shared between MCF 7/NSCLC array platforms – 119 EGFR wt NSCLC genes – 1162 MCF 7 EGFR genes – 44 genes shared between MCF 7/NSCLC gene signatures > m<-119 #number of EGFR wt NSCLC genes > n<-11079 -119 #number of other genes > k<-1162 #number of MCF 7 EGFR genes > x<-0: k #vector of successes > 1 -sum(dhyper(x, m, n, k)[1: 44]) [1] 1. 265654 e-14
General concepts of gene expression analysis
General concepts of gene expression analysis • Low level analysis – Processing image files. – Normalization – QC • High level analysis – Clustering – Selecting differentially expressed genes. – Enrichment analysis
Processing image files • From CEL, GPR, or TXT files with image information, want to generate gene expression values • For two color arrays (e. g. Stanford c. DNA arrays), can use Bioconductor • For one channel array (e. g. Affymetrix), can use d. Chip or Bioconductor
Normalization • Purpose: To adjust the overall chip brightness of the arrays to a similar level • Methods: – Two channel arrays • ‘Loess’ normalization is good – One channel arrays • Total intensity normalization • Quantile normalization • Invariant set normalization
Before Normalization After Normalization www. dchip. org
High level analysis • Selecting differentially expressed genes – Account for multiple testing • Clustering – Hierarchical clustering – Principal Components analysis – K-means clustering • Enrichment analysis or “Meta-analysis”
Selecting differentially expressed genes • Student’s t-test or ANOVA typically used – Works best on log-transformed data • Other criteria – “fold change” – Higher average signal intensity might indicate greater abundance • What p-value cutoff do you choose? – No “right” answer – Need to balance between false positives and false negatives • More stringent p-value, fewer false positives, more false negatives • Less stringent p-value, fewer false negatives, more false positives
Multiple testing • When evaluating thousands of genes, some will show a nominally significant Pvalue by chance alone • Somewhat like buying lots and lots of lottery tickets: your chances of winning greatly improve. • Want to estimate false discovery rate (FDR)
Multiple testing • Estimate FDR by method from Storey et al. (PNAS 2003 100: 9440 -5). FDR = [Number of genes on the array] X [nominal P-value] [Number of genes significant with that P-value] • Use permutation testing (e. g. SAM analysis, Tusher et al. , PNAS 2001 98: 5116 -21) – Randomly assign sample labels and do the test – Do it many times to get a distribution of false positives
Cluster analysis • Cluster analysis relates to grouping or segmenting a collection of objects (e. g. genes or samples) into subsets or "clusters", such that those within each cluster are more closely related to one another than objects assigned to different clusters. • Central to cluster analysis is the notion of degree of similarity (or dissimilarity) between the individual objects being clustered.
Cluster analysis • Major methods of clustering include hierarchical clustering, k-means clustering, and principal components analysis (PCA) • Heirarchical clustering most common for expression profile data analysis • “Cluster” and “Java. Treeview” public software programs fomr Eisen et al. (http: //rana. lbl. gov/) are handy for cluster analysis and/or generating heat maps
Hierarchical clustering – 3 methods for measuring distance between clusters • Single linkage, using the members of each cluster that are closest to each other http: //www. resample. com/xlminer/help/HClst_intro. htm
Hierarchical clustering – 3 methods for measuring distance between clusters • Complete linkage, using the members of each cluster that are furthest from each other http: //www. resample. com/xlminer/help/HClst_intro. htm
Hierarchical clustering – 3 methods for measuring distance between clusters • Average linkage, using the average of each cluster, most commonly used. http: //www. resample. com/xlminer/help/HClst_intro. htm
Widespread deregulation of gene expression in cancer • Gene expression profiling identifies different subtypes of breast cancer. Sorlie et al. PNAS. 2003 100(14): 8418 -23
Final words on gene expression profile analysis • “All good roads lead to Rome. ” • i. e. , there are many ways to go about exploratory analysis, which can lead to the same overall conclusions • What’s important – Be clear and concise about what you did (so others can understand it and repeat it) – Don’t try to fool anybody (including yourself)