Regulation of Gene Expression Chapter 18 Gene expression


 w Prevent RNA polymerase")


 Stimulates transcription of operons")


 w Attach to Lysines")

 w Represses transcription w Embryo development")


 Poly-A signal sequence Termination region Proximal")
 w General transcription")


 w Aconitase: w Translation repressor protein w")


")


 Fertilized eggs of a frog")

 Fertilized egg (b) Four-cell stage (c) Early blastula (d) Later")

 5 weeks (b) 14 weeks (c) 20 weeks")


 Signal transduction pathway Signal receptor Signal")


")


- Slides: 122
Regulation of Gene Expression Chapter 18
Gene expression w Flow of genetic information w Genotype to phenotype w Genes to proteins w Proteins not made at random w Specific purposes w Appropriate times
Control of gene expression w Selective expression of genes w All genes are not expressed at the same time w Expressed at different times
Prokaryote regulation
Control of gene expression w Regulate at transcription w Gene expression responds to w Environmental conditions w Type of nutrients w Amounts of nutrients w Rapid turn over of proteins
Fig. 18 -2 Precursor Feedback inhibition trp. E gene Enzyme 1 trp. D gene Regulation of gene expression Enzyme 2 trp. C gene trp. B gene Enzyme 3 trp. A gene Tryptophan (a) Regulation of enzyme activity (b) Regulation of enzyme production
Prokaryote w Anabolism: w Building up of a substance w Catabolism: w Breaking apart a substance
Prokaryote w w w w Operon Section of DNA Enzyme-coding genes Promoter Operator Sequence of nucleotides Overlaps promoter site Controls RNA polymerase access to the promoter
Figure 18. 3 a trp operon DNA Promoter Regulatory gene Promoter Genes of operon trp. E trp. R m. RNA 3′ RNA polymerase Operator Start codon trp. D trp. C trp. B trp. A Stop codon m. RNA 5′ 5′ Protein Inactive repressor E D C B Polypeptide subunits that make up enzymes for tryptophan synthesis (a) Tryptophan absent, repressor inactive, operon on A
Prokaryote w Multiple genes are expressed in a single gene expression w trp operon – Trytophan – Synthesis w Lac operon – Lactose – Degradation
Prokaryote w trp Operon: w Control system to make tryptophan w Several genes that make tryptophan w Regulatory region
Fig. 18 -3 a trp operon Promoter Genes of operon trp. E m. RNA Operator Start codon m. RNA 5 5 RNA polymerase E trp. D trp. C trp. B trp. A B A Stop codon D C Polypeptide subunits that make up enzymes for tryptophan synthesis
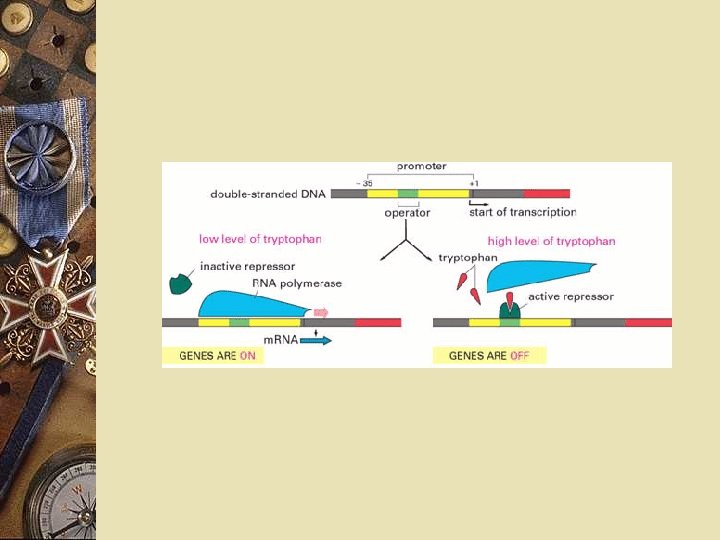
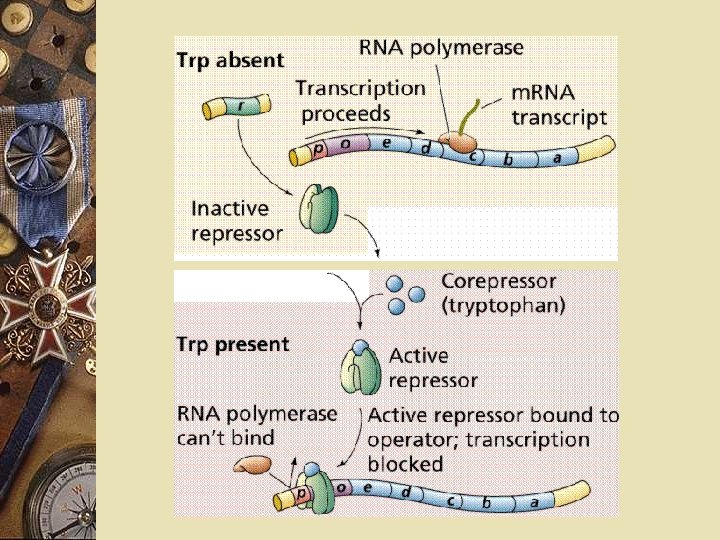
Prokaryote w ⇧tryptophan present w Bacteria will not make tryptophan w Genes are not transcribed w Enzymes will not be made w Repression
Prokaryote w Repressors w Proteins w Bind regulatory sites (operator) w Prevent RNA polymerase attaching to promoter w Prevent or decrease the initiation of transcription
Prokaryote w Repressors w Allosteric proteins w Changes shape w Active or inactive
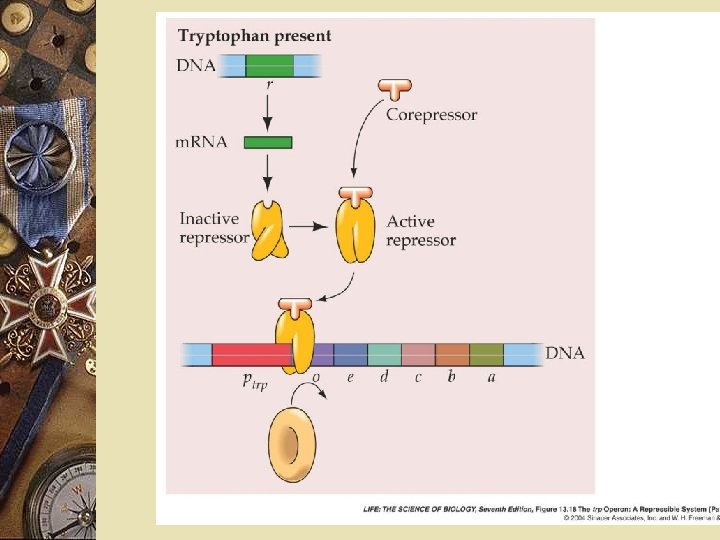
Prokaryote w ⇧tryptophan w Tryptophan binds the trp repressor w Repressor changes shape w Active shape w Repressor fits DNA better w Stops transcription w Tryptophan is a corepressor
Fig. 18 -3 b-2 DNA No RNA made m. RNA Protein Active repressor Tryptophan (corepressor) (b) Tryptophan present, repressor active, operon off
Prokaryote w ⇩tryptophan w Nothing binds the repressor w Inactive shape w RNA polymerase can transcribe
Fig. 18 -3 a trp operon Promoter DNA trp. R Regulatory gene m. RNA 5 Protein Genes of operon trp. E 3 Operator Start codon m. RNA 5 RNA polymerase Inactive repressor trp. D trp. C trp. B trp. A B A Stop codon E D C Polypeptide subunits that make up enzymes for tryptophan synthesis (a) Tryptophan absent, repressor inactive, operon on
Prokaryote w Lactose w Sugar used for energy w Enzymes needed to break it down w Lactose present w Enzymes are synthesized w Induced
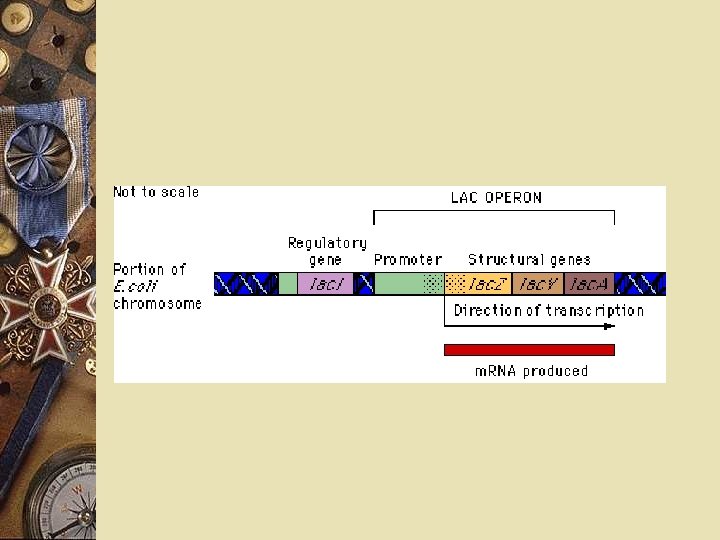
Prokaryote w lac Operon w Promoter w Operator w Genes to code for enzymes w Metabolize (break down) lactose
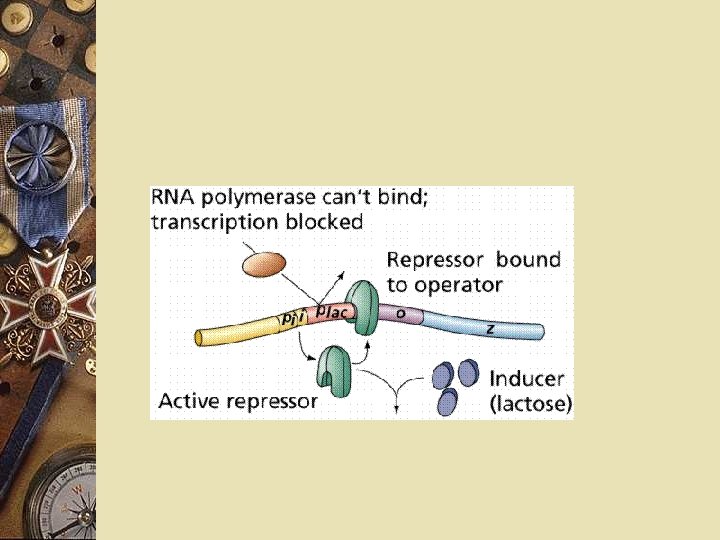
Prokaryote w Lactose is present w Repressor released w Genes expressed w Lactose absent w Repressor binds DNA w Stops transcription
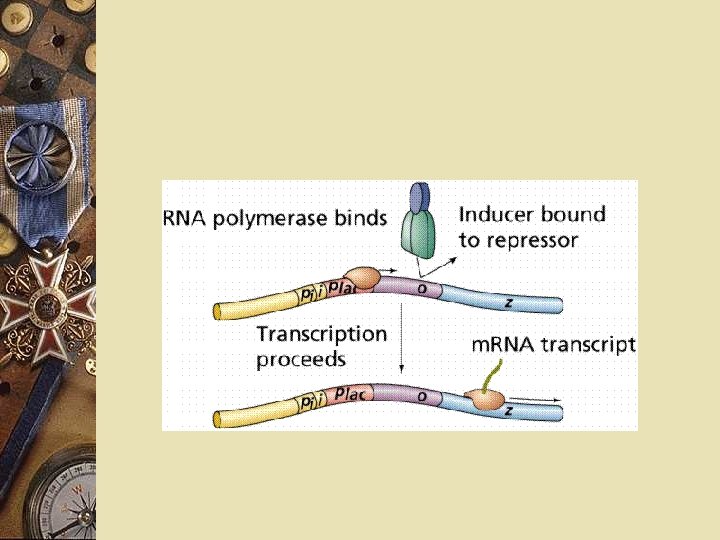
Prokaryote w w w w Allolactose: Binds repressor Repressor releases from DNA Inducer Transcription begins Lactose levels fall Allolactose released from repressor Repressor binds DNA blocks transcription
Fig. 18 -4 b lac operon lac. Z lac. Y -Galactosidase Permease lac. I DNA 3 m. RNA 5 RNA polymerase m. RNA 5 Protein Allolactose (inducer) lac. A Inactive repressor (b) Lactose present, repressor inactive, operon on Transacetylase
Fig. 18 -4 a Regulatory gene Promoter Operator lac. I DNA lac. Z No RNA made 3 m. RNA Protein 5 RNA polymerase Active repressor (a) Lactose absent, repressor active, operon off
Prokaryote w w w w Lactose & tryptophan metabolism Adjustment by bacteria Regulates protein synthesis Response to environment Negative control of genes Operons turned off by active repressors Tryptophan repressible operon Lactose inducible operon
Prokaryote
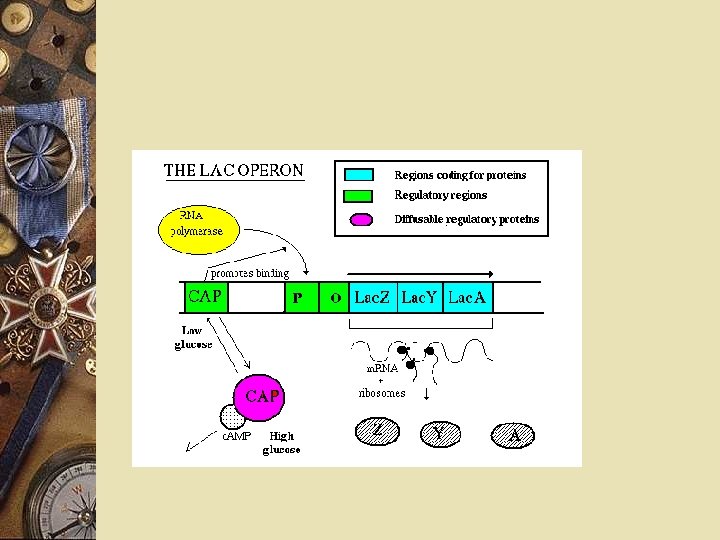
Prokaryote w Activators: w Bind DNA w Stimulate transcription w Involved in glucose metabolism w lac operon
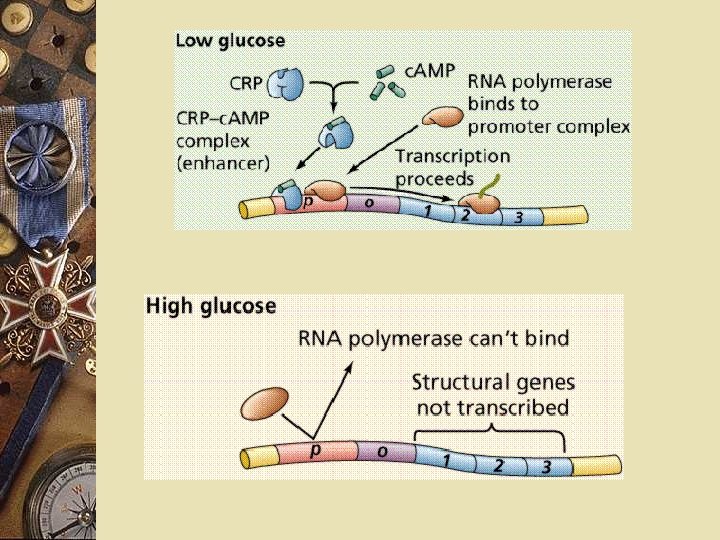
Prokaryote w w w w Activator: Catabolite activator protein (CAP) Stimulates transcription of operons Code for enzymes to metabolize sugars c. AMP helps CAP c. AMP binds CAP to activate it CAP binds to DNA (lac Operon)
Prokaryote w Glucose elevated c. AMP low w c. AMP not available to bind CAP w Does not stimulate transcription w Bacteria use glucose w Preferred sugar over others.
Prokaryote w w w w lac operon Regulated by positive & negative control Low lactose Repressor blocks transcription High lactose Allolactose binds repressor Transcription happens
Prokaryote w lac operon w Glucose also present w CAP unable to bind w Transcription will proceed slowly w Glucose absent w CAP binds promoter w Transcription goes quickly
Figure 18. 5 Promoter Operator DNA lac I lac. Z CAP-binding site Active CAP c. AMP Inactive CAP Allolactose RNA polymerase binds and transcribes Inactive lac repressor (a) Lactose present, glucose scarce (c. AMP level high): abundant lac m. RNA synthesized Promoter DNA lac I CAP-binding site Inactive CAP lac. Z Operator RNA polymerase less likely to bind Inactive lac repressor (b) Lactose present, glucose present (c. AMP level low): little lac m. RNA synthesized
Eukaryote gene expression w All cells in an organism have the same genes w Some genes turned on w Others remain off w Leads to development of specialized cells w Cellular differentiation
Eukaryote gene expression w Gene expression assists in regulating development w Homeostasis w Changes in gene expression in one cell helps entire organism
Control of gene expression w Chromosome structure w Transcriptional control w Posttranscriptional control
Fig. 18 -6 Signal NUCLEUS Chromatin modification DNA Gene available for transcription Gene Transcription RNA Exon Primary transcript Intron RNA processing Tail Cap m. RNA in nucleus Transport to cytoplasm CYTOPLASM m. RNA in cytoplasm Degradation of m. RNA Translatio n Polypeptide Protein processing Degradation of protein Active protein Transport to cellular destination Cellular function
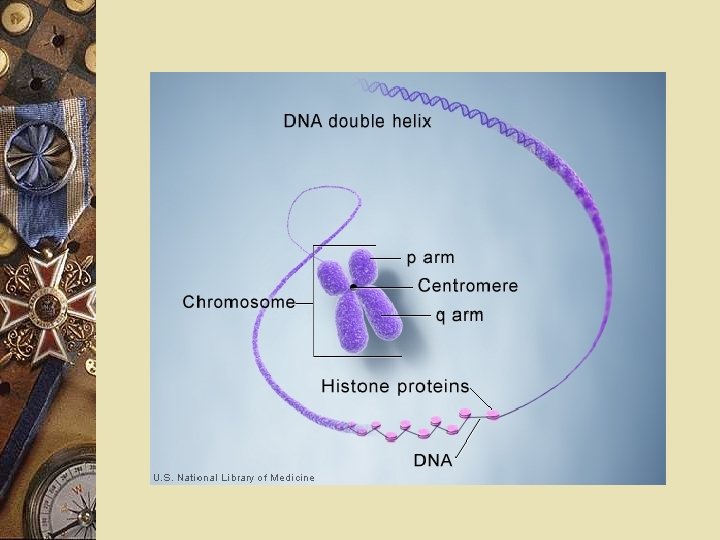
Eukaryotes w 1. DNA is organized into chromatin w 2. Transcription occurs in nucleus w 3. Each gene has its own promoter
Chromatin structure w w w w DNA is tightly packaged Heterochromatin: Tightly packed Euchromatin: Less tightly packed Influences gene expression Promoter location Modification of histones
Chromatin structure w Histone acetylation w Acetyl groups (-COCH 3) w Attach to Lysines in histone tails w Loosen packing w Histone methylation w Methyl groups (-CH 3) w Tightens packing
Fig. 18 -7 Histone tails DNA double helix Amino acids available for chemical modification (a) Histone tails protrude outward from a nucleosome Unacetylated histones Acetylated histones (b) Acetylation of histone tails promotes loose chromatin structure that permits transcription
Chromatin structure w Methylation of bases (cytosine) w Represses transcription w Embryo development
Eukaryotes w Epigenetic change: w Chromatin modifications w Change in gene expression w Passed on to the next generation w Not a DNA sequence change
Transcription control w RNA polymerase must bind DNA w Proteins regulate by binding DNA w RNA polymerase able to bind or not w Stimulates transcription or blocks it
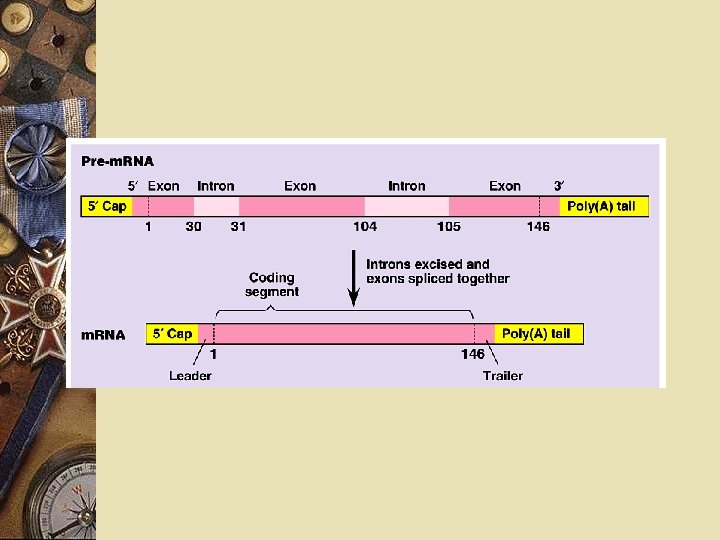
Fig. 18 -8 -3 Enhancer (distal control elements) Poly-A signal sequence Termination region Proximal control elements Exon DNA Upstream Intron Promoter Primary RNA 5 transcript Exon Intron Exon Downstream Transcription Exon Intron Exon RNA processing Cleaved 3 end of primary transcript Poly-A signal Intron RNA Coding segment m. RNA 3 5 Cap 5 UTR Start codon Stop codon 3 UTR Poly-A tail
Eukaryotes w Transcription w RNA Polymerase w Transcription factors (regulatory proteins) w General transcription factors (initiation complex) w Specific transcription factors
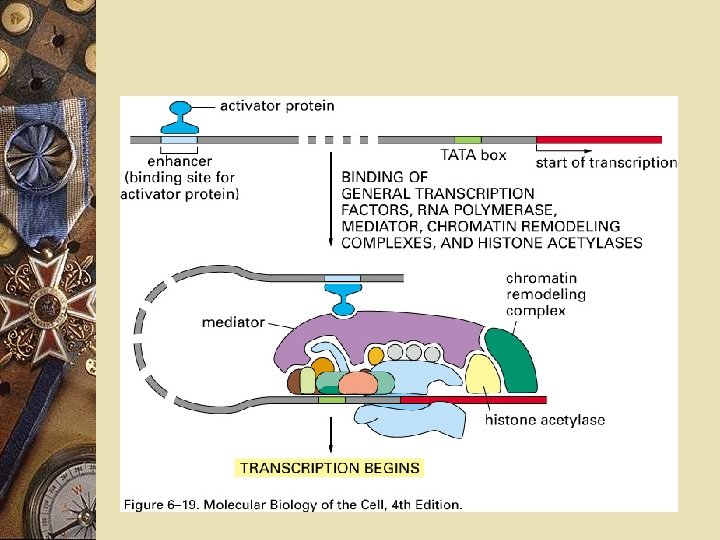
Eukaryotes w w w w Initiation of transcription Activator proteins Activator binds the enhancers Enhancers (DNA sequences) Interacts with the transcription factors Binds to the promoter RNA polymerase binds and transcription begins
Fig. 18 -9 -2 Promoter Activators DNA Enhancer Distal control element Gene TATA box General transcription factors DNA-bending protein Group of mediator proteins
Fig. 18 -9 -3 Promoter Activators DNA Enhancer Distal control element Gene TATA box General transcription factors DNA-bending protein Group of mediator proteins RNA polymerase II Transcription initiation complex RNA synthesis
Eukaryotes
Fig. 18 -10 Enhancer Promoter Control elements Albumin gene Crystallin gene LIVER CELL NUCLEUS Available activators LENS CELL NUCLEUS Available activators Albumin gene not expressed Albumin gene expressed Crystallin gene not expressed (a) Liver cell Crystallin gene expressed (b) Lens cell
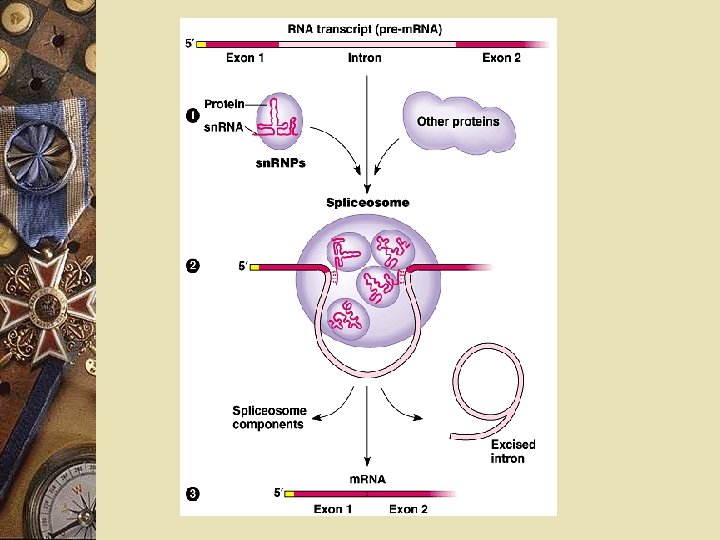
Post transcriptional control w RNA processing w Primary transcript: w Exact copy of the entire gene w RNA splicing w Introns removed from the m. RNA w sn. RNP’s (small nuclear ribonulceoproteins)
Post transcriptional control w Splicing plays a role in gene expression w Exons can be spliced together in different ways. w Leads to different polypeptides w Originated from same gene
Post transcriptional control w Example in humans w Calcitonin & CGRP w Hormones released from different organs w Derived from the same transcript
Fig. 18 -11 Exons DNA Troponin T gene Primary RNA transcript RNA splicing m. RNA or
Post transcriptional control
Post transcriptional control w Transport of transcript w Passes through nuclear pores w Active transport w Cannot pass until all splicing is done
Post transcriptional control w m. RNA degradation w Life span w Some can last hours, a few weeks w m. RNA for hemoglobin survive awhile
Post transcriptional control
Post transcriptional control w w w w Translation of RNA Translation factors are necessary Regulate translation Translation repressor proteins Stop translation Bind transcript Prevents it from binding to the ribosome
Post transcriptional control
Post transcriptional control w Ferritin (iron storage) w Aconitase: w Translation repressor protein w Binds ferritin m. RNA w Iron will bind to aconitase w Aconitase releases the m. RNA w Ferritin production increases
Post transcriptional control w Protein modification w Phosphorylation w Other alterations can affect the activity of protein w Insulin w Starts out as a larger molecule w Cut into more active sections
Post transcriptional control w Protein modification w Degradation w Protein is marked by small protein w Protein complex then breaks down proteins w Proteasomes
Post transcriptional control
Post transcriptional control
Fig. 18 -UN 4 Chromatin modification • Genes in highly compacted chromatin are generally not transcribed. • Histone acetylation seems to loosen chromatin structure, enhancing transcription. • DNA methylation generally reduces transcription. Transcription • Regulation of transcription initiation: DNA control elements bind specific transcription factors. Bending of the DNA enables activators to contact proteins at the promoter, initiating transcription. • Coordinate regulation: Enhancer for liver-specific genes Enhancer for lens-specific genes Chromatin modification RNA processing Transcription RNA processing • Alternative RNA splicing: Primary RNA transcript m. RNA degradation Translation m. RNA or Protein processing and degradation Translation • Initiation of translation can be controlled via regulation of initiation factors. m. RNA degradation • Each m. RNA has a characteristic life span, determined in part by sequences in the 5 and 3 UTRs. Protein processing and degradation • Protein processing and degradation by proteasomes are subject to regulation.
Post transcriptional control w Most gene regulation-transcription w New discovery w Small RNA’s w 21 -28 nucleotides long w Play a role in gene expression w New transcript before leaving the nucleus
Post transcriptional control w RNA interference w RNA forming double stranded loops from newly formed m. RNA w Loops are formed w Halves have complementary sequences w Loops inhibit expression of genes w Where double RNA came from
Post transcriptional control w Dicer: w Cuts double stranded RNA into smaller RNA’s called w micro. RNA (mi. RNA) w Small interfering RNA (si. RNA’s)
Fig. 18 -13 Hairpin mi. RNA Hydrogen bond Dicer mi. RNA 5 3 (a) Primary mi. RNA transcript m. RNA degraded mi. RNAprotein complex Translation blocked (b) Generation and function of mi. RNAs
Post transcriptional control w mi. RNA’s bind m. RNA w Prevents translation w si. RNA’s breaks apart m. RNA before it’s translated
Post transcriptional control w si. RNAs play a role in heterochromatin formation w Block large regions of the chromosome w Small RNAs may also block transcription of specific genes
Fig. 18 -UN 5 Chromatin modification • Small RNAs can promote the formation of heterochromatin in certain regions, blocking transcription. Transcription RNA processing m. RNA degradation Translation • mi. RNA or si. RNA can block the translation of specific m. RNAs. Translation Protein processing and degradation m. RNA degradation • mi. RNA or si. RNA can target specific m. RNAs for destruction.
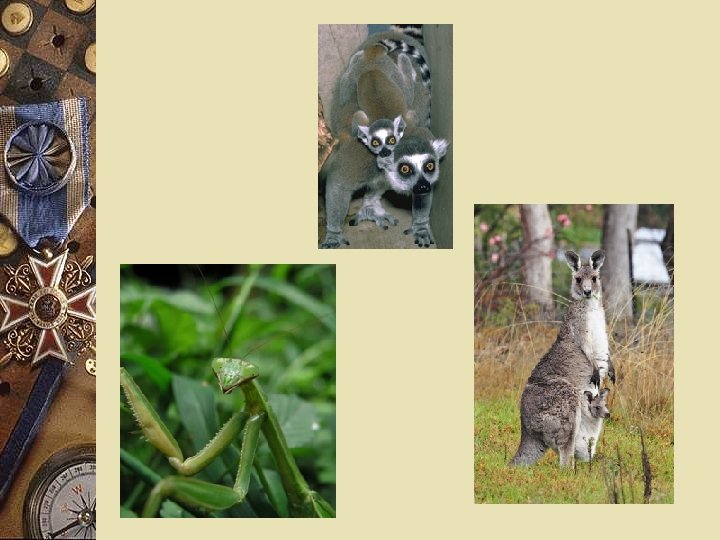
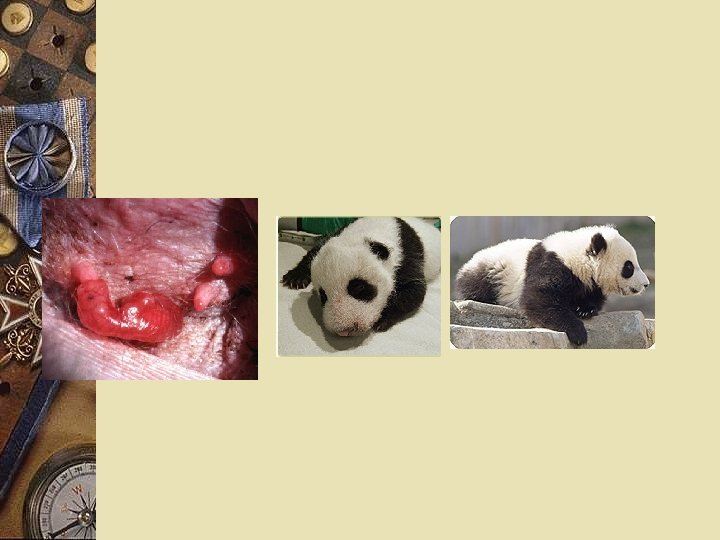
Embryonic development w Zygote gives rise to many different cell types w Cells →tissues → w organs → organ systems w Gene expression w Orchestrates developmental programs of animals
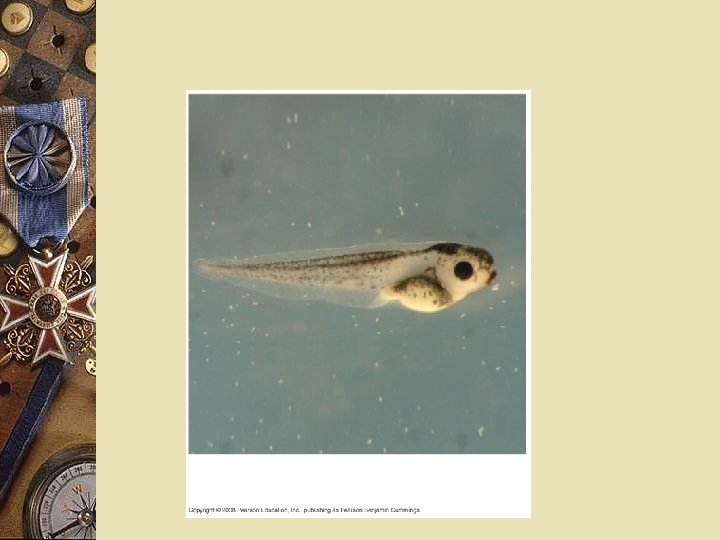
Fig. 18 -14 a (a) Fertilized eggs of a frog
Embryonic development Zygote to adult results Cell division Cell differentiation: Cells become specialized in structure & function w Morphogenesis: w “creation of from” w Body arrangement w w
Fig. 47 -6 (a) Fertilized egg (b) Four-cell stage (c) Early blastula (d) Later blastula
Fig. 47 -1 1 mm
Fig. 46 -17 (a) 5 weeks (b) 14 weeks (c) 20 weeks
Embryonic development w All cells same genome w Differential gene expression w Genes regulated differently in each cell type
Fig. 18 -10 Enhancer Promoter Control elements Albumin gene Crystallin gene LIVER CELL NUCLEUS Available activators LENS CELL NUCLEUS Available activators Albumin gene not expressed Albumin gene expressed Crystallin gene not expressed (a) Liver cell Crystallin gene expressed (b) Lens cell
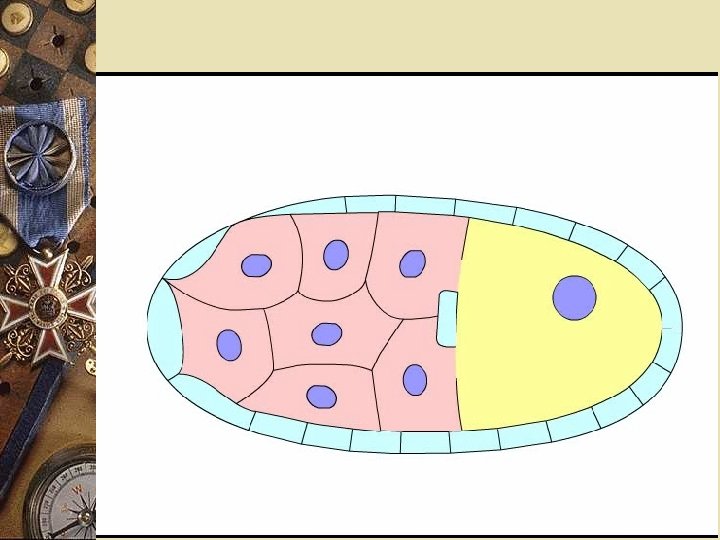
Embryonic development w Specific activators w Materials in egg cytoplasm w Not homogeneous w Set up gene regulation w Carried out as cells divide
Embryonic development w Cytoplasmic determinants w Maternal substances in the egg w Influence early development w Zygote divides by mitosis w Cells contain different cytoplasmic determinants w Leads to different gene expression
Fig. 18 -15 a Unfertilized egg cell Sperm Fertilization Nucleus Two different cytoplasmic determinants Zygote Mitotic cell division Two-celled embryo (a) Cytoplasmic determinants in the egg
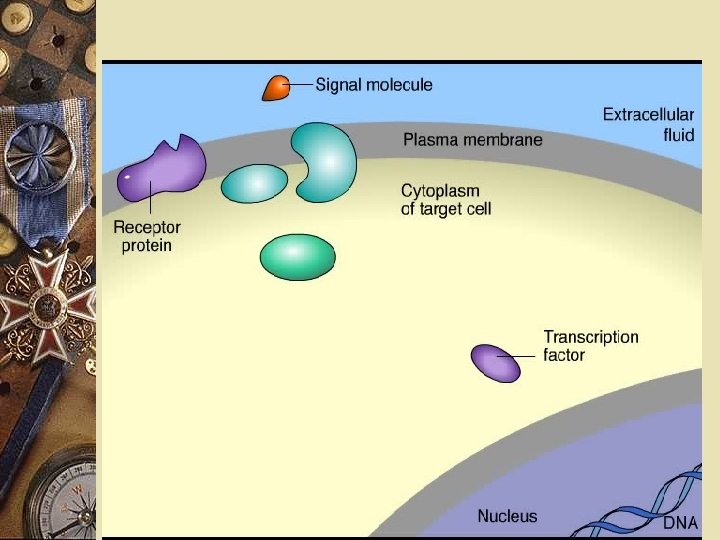
Embryonic development w Environment around cell influences development w Induction: w Signals from nearby embryonic cells w Cause transcriptional changes in target cells w Interactions between cells induce differentiation of specialized cell types
Fig. 18 -15 b Early embryo (32 cells) Signal transduction pathway Signal receptor Signal molecule (inducer) (b) Induction by nearby cells NUCLEUS
Embryonic development Determination: Observable differentiation of a cell Commits a cell to its final fate Cell differentiation is marked by the production of tissue-specific proteins w Gives cell characteristic structure & function w w
Embryonic development Myoblasts: Produce muscle-specific proteins Form skeletal muscle cells Myo. D One of several “master regulatory genes” w Produces proteins w Commit cells to becoming skeletal muscle w w w
Embryonic development w Myo. D protein w Transcription factor w Binds to enhancers of various target genes w Causes expression
Fig. 18 -16 -1 Nucleus Master regulatory gene myo. D Embryonic precursor cell Other muscle-specific genes DNA OFF
Fig. 18 -16 -2 Nucleus Master regulatory gene myo. D Embryonic precursor cell Myoblast (determined) Other muscle-specific genes DNA OFF m. RNA OFF Myo. D protein (transcription factor)
Fig. 18 -16 -3 Nucleus Master regulatory gene myo. D Embryonic precursor cell Other muscle-specific genes DNA Myoblast (determined) OFF m. RNA OFF Myo. D protein (transcription factor) m. RNA Myo. D Part of a muscle fiber (fully differentiated cell) m. RNA Another transcription factor m. RNA Myosin, other muscle proteins, and cell cycle– blocking proteins
Embryonic development w Pattern formation: w Development of spatial organization of tissues & organs w Begins with establishment of the major axes w Positional information: w Molecular cues control pattern formation w Tells a cell its location relative to the body axes & neighboring cells
Figure 18. 24 1 Growth factor 3 G protein P P P Ras GTP 2 Receptor NUCLEUS 5 Transcription factor (activator) 6 Protein that stimulates the cell cycle 4 Protein kinases MUTATION Ras GTP Ras protein active with or without growth factor. NUCLEUS Transcription factor (activator) Overexpression of protein
Figure 18. 25 2 Protein kinases 5 Protein that NUCLEUS UV light 1 DNA damage in genome UV light 3 Active form 4 Transcription of p 53 MUTATION DNA damage in genome inhibits the cell cycle Defective or missing transcription factor. Inhibitory protein absent
Fruit fly w Unfertilized egg contains cytoplasmic determinants w Determines the axes before fertilization w After fertilization, w Embryo develops into a segmented larva with three larval stages
Fig. 18 -17 a Head Thorax Abdomen 0. 5 mm Dorsal BODY AXES (a) Adult Anterior Left Ventral Right Posterior
Fig. 18 -17 b Follicle cell 1 Egg cell developing within ovarian follicle Nucleus Egg cell Nurse cell Egg shell 2 Unfertilized egg Depleted nurse cells Fertilization Laying of egg 3 Fertilized egg Embryonic development 4 Segmented embryo 0. 1 mm Body segments Hatching 5 Larval stage (b) Development from egg to larva
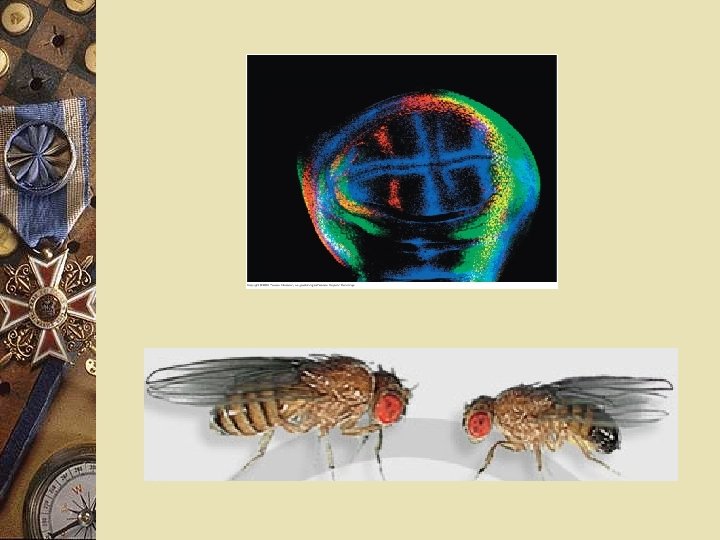
Fruit fly w Homeotic genes: w Control pattern formation in late embryo, larva and adult
Fig. 18 -18 Eye Leg Antenna Wild type Mutant
Fruit fly w Maternal effect genes: w Encode for cytoplasmic determinants w Initially establish the axes of the body of Drosophila w Egg-polarity genes: w Maternal effect genes w Control orientation of the egg w Consequently the fly
Fruit Fly Bicoid gene Maternal effect gene Affects the front half of the body An embryo whose mother has a mutant bicoid gene w Lacks the front half of its body w Duplicate posterior structures at both ends w w
Fig. 18 -19 a EXPERIMENT Tail Head T 1 T 2 T 3 A 1 A 2 A 6 A 3 A 4 A 5 A 7 A 8 Wild-type larva Tail A 8 A 7 Mutant larva (bicoid) A 6 A 7 A 8