Regulation of Gene Expression Pretranscriptional regulation chromatin compaction


 1. Single initiation sites (genes with")


- Slides: 27
Regulation of Gene Expression Pre-transcriptional regulation • chromatin compaction eg deacetylation, methylation • transcriptional initiation ie transcription factors to activate or repress • alternative promoters =? > alternative transcripts During transcription • number of transcripts made, rate of transcription • alternative m. RNA splicing =? > splice variants (alternative transcripts) • regulation of m. RNA stability (3’UTR, mi. RNA etc) Post-transcriptional regulation • 5’UTR regulatory functions not yet fully understood • regulation of translation initiation • during folding of the protein • later control of protein activity (acetylation, phosphorylation etc)
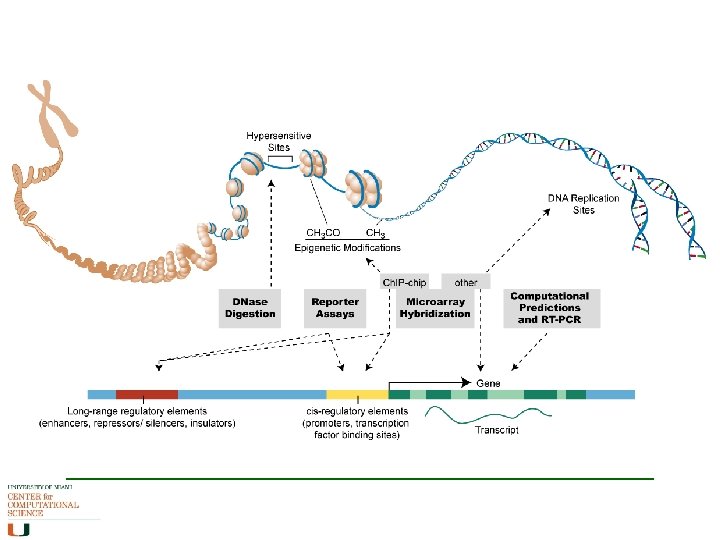
What is a promoter A DNA sequence that is involved in the regulation of a gene. It has a binding site for RNA polymerase and binding sites for transcription factors. Was thought to be immediately upstream of a gene, but in fact is symmetrical around the transcriptional start site (ENCODE, 2007) Activity of protein complexes bound to promoter regions can activate a gene (switch on) or repress its transcription (switch off) or somewhere in between (dimmer switch)
Translation initiation site Initiation codon ATG promoter 5’UTR Exon 1 5’ Exon 2 TSS Transcriptional Start Site Exon 1 Transcription factor binding sites TFBSs Exon 2 3’
Classifying Promoters • By distance from TSS – but where is the TSS • By signal in ATCG content (Landolin et al. , 2013) – but does this apply in all species and cell types? • By concentration of TFBSs along the length of the gene, around the TSS or several TSSs – but what if these signals are only relevant in certain tissues at certain times?
By distance from TSS Length of a promoter varies greatly. Usually has many transcription factor binding sites along it – but spacing can be large. BASIC CATEGORIES OF PROMOTERS Core promoter is the region ± 40 from the TSS; Proximal promoter is the region ± 250 from the TSS. Many current promoter analysis studies actually take a promoter region which is ± 500, ± 1000 or even ± 5000 bases from the TSS. An enhancer is a sequence located several Kb upstream or downstream of a gene that its regulates transcription.
Transcription Factors Activators or Repressors and cofactors, chaperones, modifiers • Usually work in large protein complexes • Need 2 -4 per promoter • Two TFs may compete for same binding site: e. g. one is repressing, needs to be modified in some way to allow an activator to bind and switch that gene on. • Regulate transcription per tissue, time, physiological state, etc
Finding TFBSs • Sequence based. Some literature reports include protein structure parameters. • Motif finding algorithms abound. • Start with a multiple sequence alignment, most are probabilistic. – PSSM – HMM – Weight array matrix with Markov dependence assumptions – Trees or Baysian networks Mostly based on assumption that TFBSs are of fixed length • Non-probabilistic models allow variable length through degeneracy CTGTCCAGAACT ATGCGGGTACT GTATCTTAGT Exon 1 Exon 2
Defining TFBSs a C a a C Alignment G c c g A g g g t t t a a T C a c A A c c T g g A g t t G _________ Profile A C G T 3 2 0 0 0 4 1 0 4 0 0 5 3 1 0 1 2 3 0 0 1 0 3 1 0 0 1 4 _________ Consensus A C G T Regular expression [A/C] C G T N [A/C] {C} T
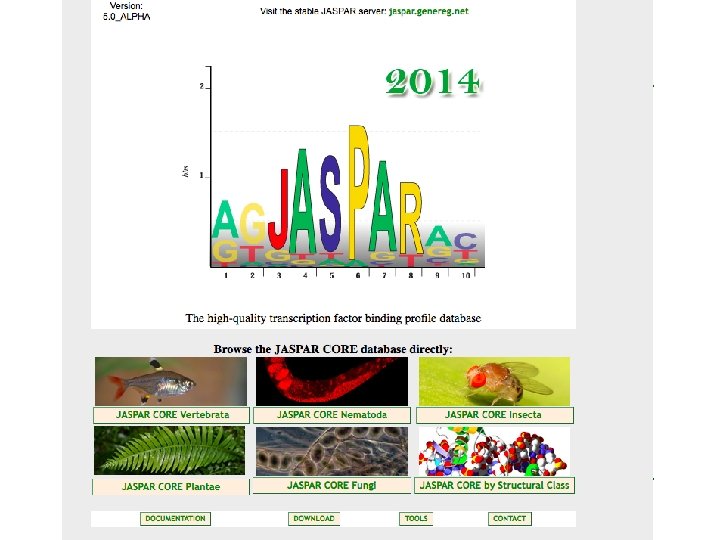
Representing TFBSs • If very conserved, easy to define a motif – Consensus or regular expression • Graphical representation (logo) – Frequency counts
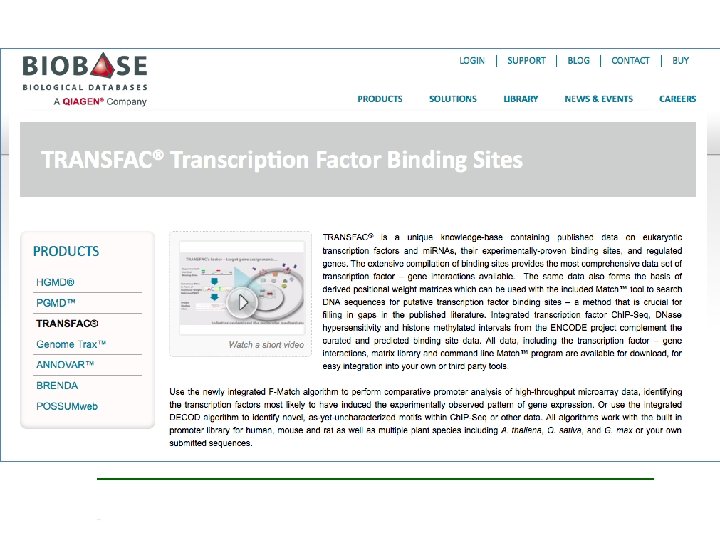
Confirming TFBSs • Found a motif, now search it against TFBS databases • CHIP-seq experimental evidence • Chromatin accessibility • Found a TFBS… stimulus, time, tissue? – SP 1, PAX 9, HNF 1 alpha
It’s Complicated • Sequence analysis might find several on a promoter • When, where, how… • Include activators and repressors • For shorter TFBSs, lots of false positives • Modules of 3 or 4 work together to regulate the transcription of a gene. Exon 1 Exon 2
Prediction of promoter regions Closely linked to prediction of ORFs where there is an ORF there is a promoter (? TATA box) Two main methods: - Pattern Driven a concentration of TFBSs - Conservation Across Species conserved TFBS patterns Problems with both: - TFBSs are only 5 -15 bp long, and can be variable - vary between species, and relevance to tissues - methods say nothing about context of the sites, interactions between TFs, or probability that a site is functional
Eukaryotic Promoter Database A collection of experimentally verified TSSs and the promoter regions associated with them. >When it began Experimental evidence, one gene at a time. Results using the techniques of the time found that each gene had one TSS and one promoter, upstream of TSS. >Now More sophisticated techniques and high-throughput methods, one genome at a time (e. g. 5’ESTs). A gene can have multiple TSSs, multiple promoters, symmetrical around TSS >How Partly experimental, partly computational. Recognises promoters by presence of “promoter elements” (TATA boxes, Cp. G islands, etc)
EPD: Three classes of promoters (with experimental evidence) 1. Single initiation sites (genes with one TSS) 2. Clustered multiple initiation sites (genes with several TSSs close together) 3. Transcriptional initiation regions (several TSSs far apart) These genes may have alternative promoters
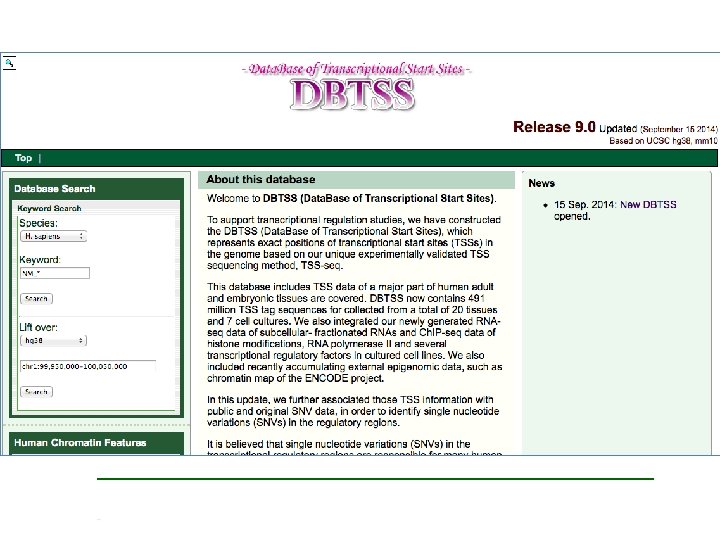
Which one is it? Experimental methods for finding TSSs rely on specialized sequencing of 5’ end of full length clones Multiple TSSs are always found per gene, which one is the “real” one? Depends on tissue and time, physiological state, stimulus, etc For your research, do you: Take the TSS farthest 5’end from the ATG (translation initiation codon) or the TSS most frequently found before the ATG? Or see if both apply, and assign multiple TSSs and promoters accordingly? EPD and DBTSS both can help you do that
Web Tools for Promoter Analysis Lots of promoter analysis web tools out there- check date last modified and/or updated, read the paper, test it out, try out more than one. Many need a multiple alignment of promoter regions as input. Remember possibility of alternative promoters. Following slides are a couple of good databases and several tools.
Eukaryotic Promoter Database
Melina II uses four different pattern searching algorithms for promoter analysis
Promoter Analysis Project Example Best strategy is to conduct a pattern finding search (use more than one web tool for this), followed by conservation analysis across comparable species to identify possible active TFBSs. HDAC 11 Chr 3 p 25. 1 Prot(aa) 347 nuclear cytoplasmic HDAC 1 HDAC 2 HDAC 3 HDAC 8 1 p 34. 1 6 q 21 5 q 31. 2 Xq 13 482 488 428 377 HDAC 4 HDAC 5 HDAC 7 HDAC 9 2 q 37. 2 17 q 21 12 q 13. 1 7 p 21. 1 1084 1122 952 1011 HDAC 6 HDAC 10 Xp 11. 23 22 q 13. 31 1215 669
Number of motif species 140 2000 bp region 600 bp region 120 100 80 60 40 20 0 HDAC 1 HDAC 2 HDAC 3 HDAC 4 HDAC 5 HDAC 6 HDAC 7 HDAC 8 HDAC 9 HDAC 10 HDAC 11 Human HDACs Predicted motifs on 2000 bp region of HDACs. The region 500 bp upstream and 100 bp downstream of TSS, contains more than half of predicted motif species.
The conserved motifs among mammals were identified by footprint. The pattern of conserved motifs is distinct in different species groups. (Z. Jiang and S. Khuri using Genomatix software suite)
The predicted motifs on HDAC 1 were grouped by tissue specificity feature. The motifs we found point to transcription factors that have some tissue and time preferences, which implies distinct expression patterns among the HDACs.