12 1 Multiple Linear Regression Models 12 1


")

")
")


- Slides: 94
12 -1 Multiple Linear Regression Models 12 -1. 1 Introduction • Many applications of regression analysis involve situations in which there are more than one regressor variable. • A regression model that contains more than one regressor variable is called a multiple regression model.
12 -1 Multiple Linear Regression Models 12 -1. 1 Introduction • For example, suppose that the effective life of a cutting tool depends on the cutting speed and the tool angle. A possible multiple regression model could be where Y – tool life x 1 – cutting speed x 2 – tool angle
12 -1 Multiple Linear Regression Models 12 -1. 1 Introduction Figure 12 -1 (a) The regression plane for the model E(Y) = 50 + 10 x 1 + 7 x 2. (b) The contour plot
12 -1 Multiple Linear Regression Models 12 -1. 1 Introduction
12 -1 Multiple Linear Regression Models 12 -1. 1 Introduction Figure 12 -2 (a) Three-dimensional plot of the regression model E(Y) = 50 + 10 x 1 + 7 x 2 + 5 x 1 x 2. (b) The contour plot
12 -1 Multiple Linear Regression Models 12 -1. 1 Introduction Figure 12 -3 (a) Three-dimensional plot of the regression model E(Y) = 800 + 10 x 1 + 7 x 2 – 8. 5 x 12 – 5 x 22 + 4 x 1 x 2. (b) The contour plot
12 -1 Multiple Linear Regression Models 12 -1. 2 Least Squares Estimation of the Parameters
12 -1 Multiple Linear Regression Models 12 -1. 2 Least Squares Estimation of the Parameters • The least squares function is given by • The least squares estimates must satisfy
12 -1 Multiple Linear Regression Models 12 -1. 2 Least Squares Estimation of the Parameters • The least squares normal Equations are • The solution to the normal Equations are the least squares estimators of the regression coefficients.
12 -1 Multiple Linear Regression Models Example 12 -1
12 -1 Multiple Linear Regression Models Example 12 -1
12 -1 Multiple Linear Regression Models Figure 12 -4 Matrix of scatter plots (from Minitab) for the wire bond pull strength data in Table 12 -2.
12 -1 Multiple Linear Regression Models Example 12 -1
12 -1 Multiple Linear Regression Models Example 12 -1
12 -1 Multiple Linear Regression Models Example 12 -1
12 -1 Multiple Linear Regression Models 12 -1. 3 Matrix Approach to Multiple Linear Regression Suppose the model relating the regressors to the response is In matrix notation this model can be written as
12 -1 Multiple Linear Regression Models 12 -1. 3 Matrix Approach to Multiple Linear Regression where
12 -1 Multiple Linear Regression Models 12 -1. 3 Matrix Approach to Multiple Linear Regression We wish to find the vector of least squares estimators that minimizes: The resulting least squares estimate is
12 -1 Multiple Linear Regression Models 12 -1. 3 Matrix Approach to Multiple Linear Regression
12 -1 Multiple Linear Regression Models Example 12 -2
Example 12 -2
12 -1 Multiple Linear Regression Models Example 12 -2
12 -1 Multiple Linear Regression Models Example 12 -2
12 -1 Multiple Linear Regression Models Example 12 -2
12 -1 Multiple Linear Regression Models Example 12 -2
12 -1 Multiple Linear Regression Models Estimating 2 An unbiased estimator of 2 is
12 -1 Multiple Linear Regression Models 12 -1. 4 Properties of the Least Squares Estimators Unbiased estimators: Covariance Matrix:
12 -1 Multiple Linear Regression Models 12 -1. 4 Properties of the Least Squares Estimators Individual variances and covariances: In general,
12 -2 Hypothesis Tests in Multiple Linear Regression 12 -2. 1 Test for Significance of Regression The appropriate hypotheses are The test statistic is
12 -2 Hypothesis Tests in Multiple Linear Regression 12 -2. 1 Test for Significance of Regression
12 -2 Hypothesis Tests in Multiple Linear Regression Example 12 -3
12 -2 Hypothesis Tests in Multiple Linear Regression Example 12 -3
12 -2 Hypothesis Tests in Multiple Linear Regression Example 12 -3
12 -2 Hypothesis Tests in Multiple Linear Regression Example 12 -3
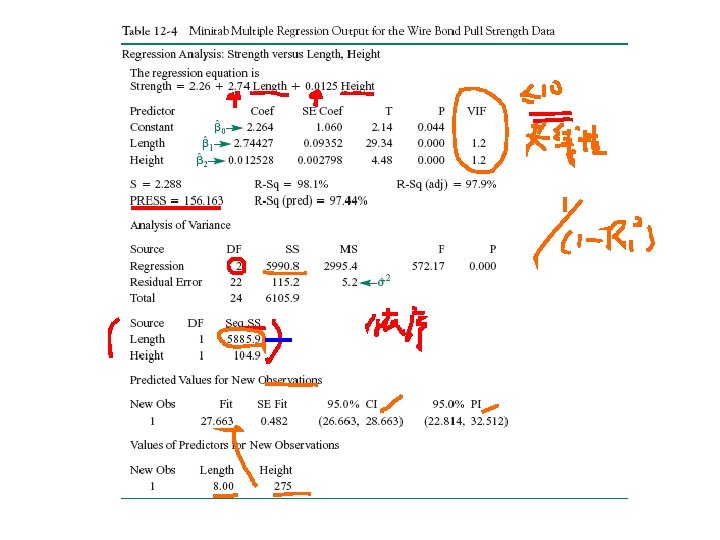
12 -2 Hypothesis Tests in Multiple Linear Regression R 2 and Adjusted R 2 The coefficient of multiple determination • For the wire bond pull strength data, we find that R 2 = SSR/SST = 5990. 7712/6105. 9447 = 0. 9811. • Thus, the model accounts for about 98% of the variability in the pull strength response.
12 -2 Hypothesis Tests in Multiple Linear Regression R 2 and Adjusted R 2 The adjusted R 2 is • The adjusted R 2 statistic penalizes the analyst for adding terms to the model. • It can help guard against overfitting (including regressors that are not really useful)
12 -2 Hypothesis Tests in Multiple Linear Regression 12 -2. 2 Tests on Individual Regression Coefficients and Subsets of Coefficients The hypotheses for testing the significance of any individual regression coefficient:
12 -2 Hypothesis Tests in Multiple Linear Regression 12 -2. 2 Tests on Individual Regression Coefficients and Subsets of Coefficients The test statistic is • Reject H 0 if |t 0| > t /2, n-p. • This is called a partial or marginal test
12 -2 Hypothesis Tests in Multiple Linear Regression Example 12 -4
12 -2 Hypothesis Tests in Multiple Linear Regression Example 12 -4
12 -2 Hypothesis Tests in Multiple Linear Regression The general regression significance test or the extra sum of squares method: We wish to test the hypotheses:
12 -2 Hypothesis Tests in Multiple Linear Regression A general form of the model can be written: where X 1 represents the columns of X associated with 1 and X 2 represents the columns of X associated with 2
12 -2 Hypothesis Tests in Multiple Linear Regression For the full model: If H 0 is true, the reduced model is
12 -2 Hypothesis Tests in Multiple Linear Regression The test statistic is: Reject H 0 if f 0 > f , r, n-p The test in Equation (12 -32) is often referred to as a partial F-test
12 -2 Hypothesis Tests in Multiple Linear Regression Example 12 -5
12 -2 Hypothesis Tests in Multiple Linear Regression Example 12 -5
12 -2 Hypothesis Tests in Multiple Linear Regression Example 12 -5
12 -3 Confidence Intervals in Multiple Linear Regression 12 -3. 1 Confidence Intervals on Individual Regression Coefficients Definition
12 -3 Confidence Intervals in Multiple Linear Regression Example 12 -6
12 -3 Confidence Intervals in Multiple Linear Regression 12 -3. 2 Confidence Interval on the Mean Response The mean response at a point x 0 is estimated by The variance of the estimated mean response is
12 -3 Confidence Intervals in Multiple Linear Regression 12 -3. 2 Confidence Interval on the Mean Response Definition
12 -3 Confidence Intervals in Multiple Linear Regression Example 12 -7
12 -3 Confidence Intervals in Multiple Linear Regression Example 12 -7
12 -4 Prediction of New Observations A point estimate of the future observation Y 0 is A 100(1 - )% prediction interval for this future observation is
12 -4 Prediction of New Observations Figure 12 -5 An example of extrapolation in multiple regression
12 -4 Prediction of New Observations Example 12 -8
12 -5 Model Adequacy Checking 12 -5. 1 Residual Analysis Example 12 -9 Figure 12 -6 Normal probability plot of residuals
12 -5 Model Adequacy Checking 12 -5. 1 Residual Analysis Example 12 -9
12 -5 Model Adequacy Checking 12 -5. 1 Residual Analysis Example 12 -9 Figure 12 -7 Plot of residuals against ŷi.
12 -5 Model Adequacy Checking 12 -5. 1 Residual Analysis Example 12 -9 Figure 12 -8 Plot of residuals against x 1.
12 -5 Model Adequacy Checking 12 -5. 1 Residual Analysis Example 12 -9 Figure 12 -9 Plot of residuals against x 2.
12 -5 Model Adequacy Checking 12 -5. 1 Residual Analysis
12 -5 Model Adequacy Checking 12 -5. 1 Residual Analysis The variance of the ith residual is
12 -5 Model Adequacy Checking 12 -5. 1 Residual Analysis
12 -5 Model Adequacy Checking 12 -5. 2 Influential Observations Figure 12 -10 A point that is remote in xspace.
12 -5 Model Adequacy Checking 12 -5. 2 Influential Observations Cook’s distance measure
12 -5 Model Adequacy Checking Example 12 -10
12 -5 Model Adequacy Checking Example 12 -11
12 -6 Aspects of Multiple Regression Modeling 12 -6. 1 Polynomial Regression Models
12 -6 Aspects of Multiple Regression Modeling Example 12 -12
12 -6 Aspects of Multiple Regression Modeling Example 12 -11 Figure 12 -11 Data for Example 12 -11.
Example 12 -12
12 -6 Aspects of Multiple Regression Modeling Example 12 -12
12 -6 Aspects of Multiple Regression Modeling 12 -6. 2 Categorical Regressors and Indicator Variables • Many problems may involve qualitative or categorical variables. • The usual method for the different levels of a qualitative variable is to use indicator variables. • For example, to introduce the effect of two different operators into a regression model, we could define an indicator variable as follows:
12 -6 Aspects of Multiple Regression Modeling Example 12 -13
12 -6 Aspects of Multiple Regression Modeling Example 12 -13
12 -6 Aspects of Multiple Regression Modeling Example 12 -13
Example 12 -12
12 -6 Aspects of Multiple Regression Modeling Example 12 -13
12 -6 Aspects of Multiple Regression Modeling Example 12 -13
12 -6 Aspects of Multiple Regression Modeling 12 -6. 3 Selection of Variables and Model Building
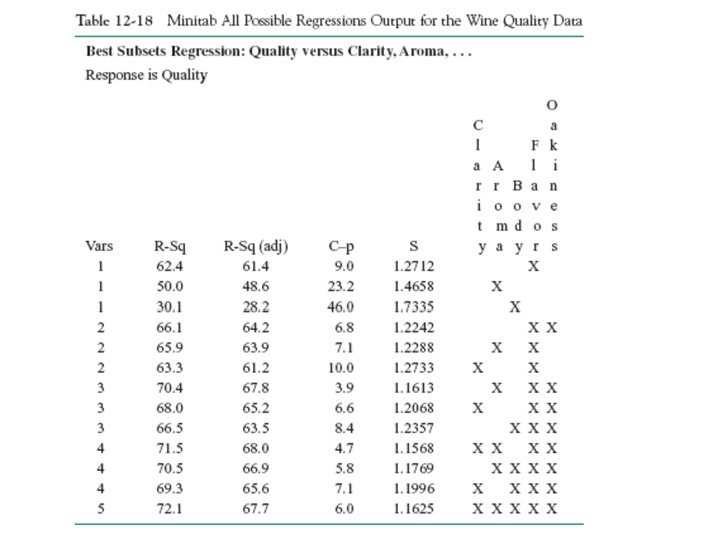
12 -6 Aspects of Multiple Regression Modeling 12 -6. 3 Selection of Variables and Model Building All Possible Regressions – Example 12 -15
12 -6 Aspects of Multiple Regression Modeling 12 -6. 3 Selection of Variables and Model Building All Possible Regressions – Example 12 -15
12 -6 Aspects of Multiple Regression Modeling 12 -6. 3 Selection of Variables and Model Building All Possible Regressions – Example 12 -15 Figure 12 -12 A matrix of Scatter plots from Minitab for the Wine Quality Data.
12 -6. 3 Selection of Variables and Model Building Stepwise Regression Example 12 -15
12 -6. 3 Selection of Variables and Model Building Backward Regression Example 12 -15
12 -6 Aspects of Multiple Regression Modeling 12 -6. 4 Multicollinearity Variance Inflation Factor (VIF)
12 -6 Aspects of Multiple Regression Modeling 12 -6. 4 Multicollinearity The presence of multicollinearity can be detected in several ways. Two of the more easily understood of these are: